• Обзор
  • Отзывы (66)
  • Обсуждение (250)
  • Что нового

The 1 2 3 Pattern Scanner

4.75

** All Symbols x All Timeframes scan just by pressing scanner button **

After 17 years of experience in the markets and programming, Winner indicator is ready. I would like to share with you!

*** Contact me to send you instruction and add you in "123 scanner group" for sharing or seeing experiences with other users.

Introduction

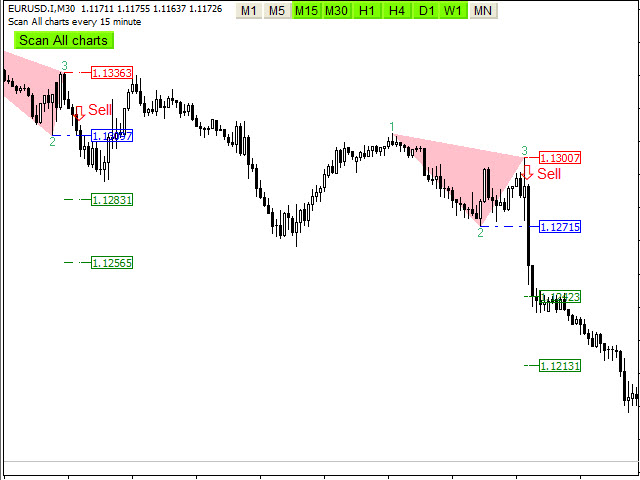
The 123 Pattern Scanner indicator with a special enhanced algorithm is a very repetitive common pattern finder with a high success rate. Interestingly, this Winner indicator indicates that the trend has changed its direction or the end of a trend retracement or even the 1 2 3 Pattern appears at the range market.

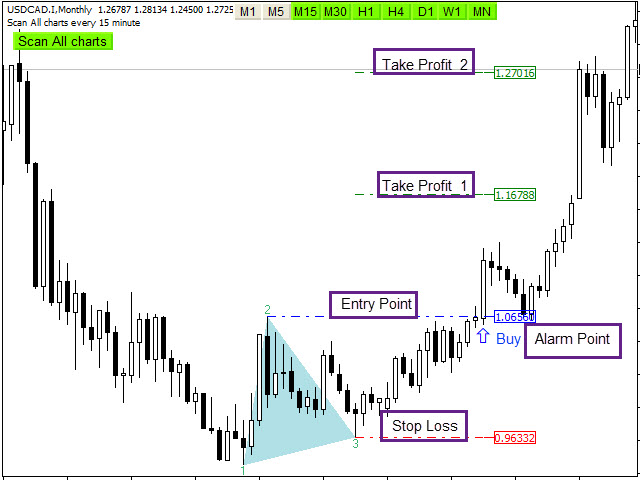
The 1,2,3 Pattern Scanner finds immediately with alarm and notification and also has stop loss, take profits and entry point with candlestick checking for easy trading.

Main Features

  • Use special enhanced algorithm
  • Detect the best and  most successful pattern with very repetitive in trend, swing and breakout.
  • Easy-to-use and user-friendly indicator
  • NO repaint
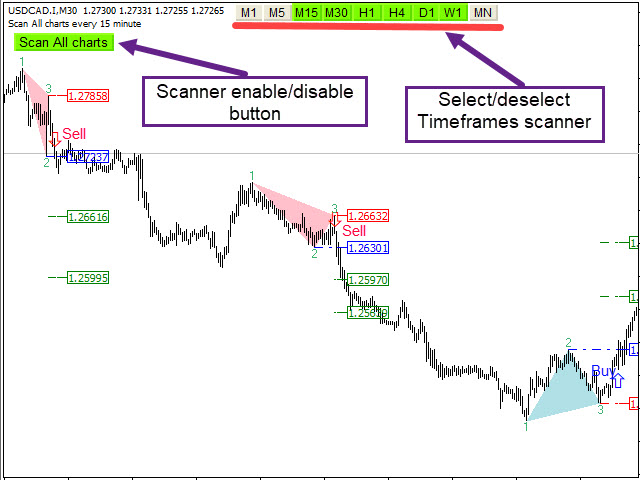
  • Scan all charts button ( Forex, Crypto, Indices and commodities)
  • Select and deselect time frames button for scan (M5,M15,M30,H1,H4,D1,W1,MN)
  • It displays and pushes notification stop-loss, entry-point and take-profit levels
  • Real Statistics Dashboard
  • Candlestick check for the best entry point
  • Method to choose how appearing pattern : breakout(after breakout the point 2) or pattern(in point 3)
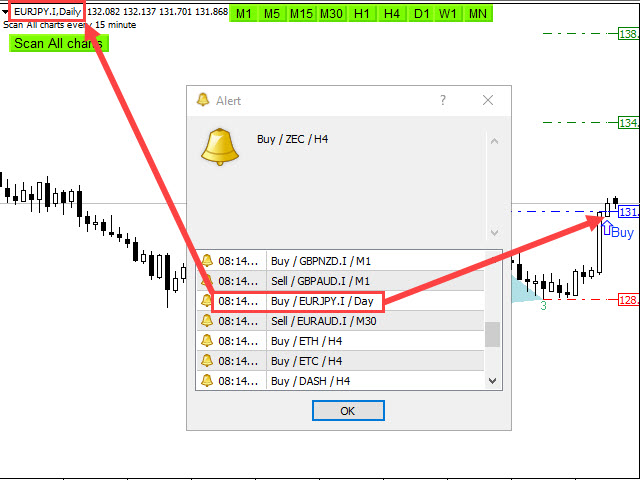
  • Sending the alert and push notification, email and files
  • Alert enable/disable base on your setting time
  • Adjust the pattern setting
  • Risk to Reward : 1:2
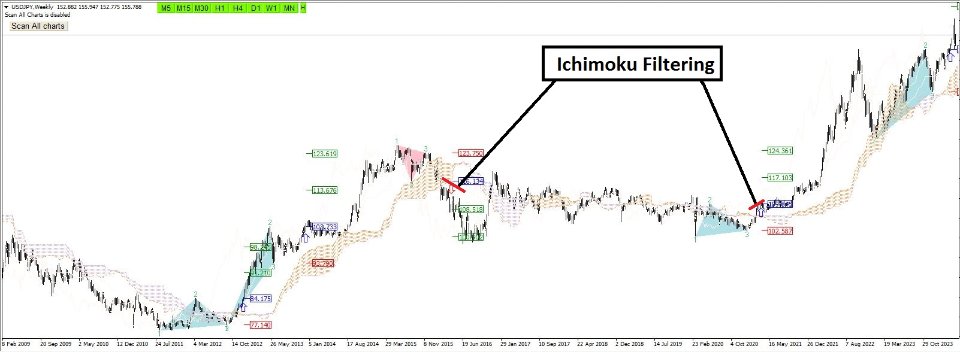
  • Ichimuku filtering

    Input Parameters

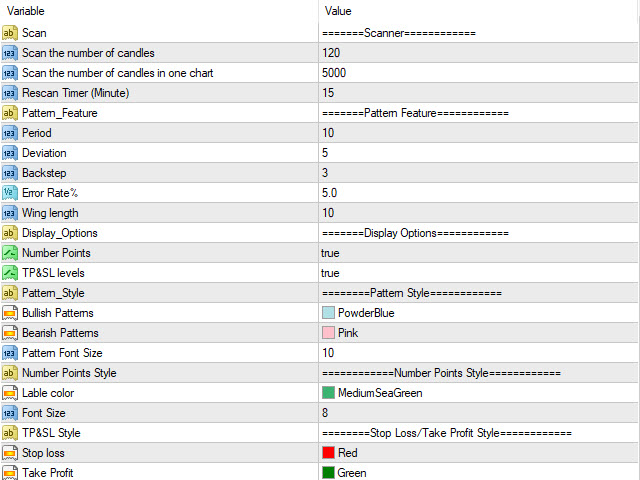
    =========Scanner============

    • Scan all charts - Enabled
    • Scan the number of candles – Amount of history bars to evaluate
    • Re-scan Timer – Re-scan all charts and all time frames after passing time
    • Method - choose how appearing a pattern : breakout(after breakout in point 2) or pattern(in point 3)

    =======Pattern Feature============

    • Pattern_Feature(Period, Deviation, Back step) - Algorithm Parameters for pattern recognition
    • Error_Rate – Maximum allowable error relative to pattern percentage
    • Wing length - Minimum distance between two legs in a pattern

    =======Display/style Options============

    • Display_Options – Display or do not display TP & SL levels
    • Stop Loss/Take Profit levels and Breakout Style - Set the Fonts and colors of patterns
    • Chart view - Color Scheme of chart (White / Black / Don't change)
    • Statistics Dashboard - Display or do not display Dashboard

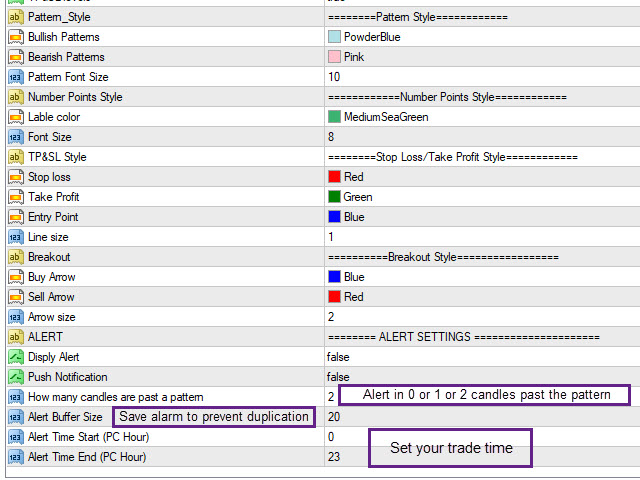
    ========ALERT SETTINGS ==========

    • Display Alert or Push Notification – Enable or disable Alert or Push Notification
    • How many candles are past a pattern – Maximum Number of candles Passed from a pattern to allow alert
    • Alert Buffer Size – Maximum save alert to prevent duplicate alerts
    • Alert start/end time  – Determine trading hours based on the computer clock to activate and deactivate the alarm
      Отзывы 20
      NaraChid
      71
      NaraChid 2024.09.25 17:07 
       

      Excellent tool and prompt support

      Khalid Karim
      390
      Khalid Karim 2024.09.12 07:36 
       

      great product. less but accurate signals. simple and smooth.

      aph.andy
      308
      aph.andy 2024.07.17 07:43 
       

      Very good indicator. If you follow the manual Reza give you, the indicator will be work like charm. Thank you for the support Reza. Really recommended.

      Рекомендуем также
      Description: This indicator draw ZigZag Line in multiple time frame also search for Harmonic patterns before completion of the pattern. Features: Five instances of ZigZag indicators can be configured to any desired timeframe and inputs. Draw Harmonic pattern before pattern completion. Display Fibonacci retracement ratios. Configurable Fibonacci retracement ratios. Draw AB=CD based on Fibonacci retracement you define. You can define margin of error allowed in Harmonic or Fibonacci calculatio
      FREE
      Этот индикатор нарисует вам следующие уровни: Дневная открытая линия: внизу – медвежий рынок, вверху – бычий. Средний дневной диапазон: максимум и минимум Азиатский рынок: взлеты и падения Вчерашний максимум и минимум Эти уровни являются сильными уровнями поддержки и сопротивления, на которые каждый должен обратить внимание. Если вы не использовали время, чтобы начать! Вам нужно обратить внимание, когда цена приближается к этим уровням! Наслаждайтесь торговлей, которая стала проще!
      FREE
      FxSProMT
      Sergiy Podolyak
      5 (1)
      Индикатор FxSProMT показывает текущую тенденцию на рынке и смену тренда. Параметры индикатора Ind_Period - Указывает число предыдущих баров для расчета фактических значений. Number_Bars - Число баров отображения индикатора. Большое количество баров может существенно замедлить работу торгового терминала. Signal_Sound - Сигнал при изменении тренда. Сигнал может звучать несколько раз, пока сигнал не будет подтвержден (бар закрыт). По умолчанию отключен. Signal_Alert - Алерт при изменении тренда.
      FREE
      Free automatic fibonacci - это индикатор, который автоматически строит коррекции Фибоначчи, основываясь на количестве баров, выбранных в параметре BarsToScan. Линии Фибоначчи автоматически обновляются в реальном времени при появлении новых максимальных и минимальных значений среди выбранных баров. В настройках индикатора можно выбрать уровни, значения которых будут отображены. Также можно выбрать цвет уровней, что позволяет трейдеру прикреплять индикатор несколько раз с разными настройками и цве
      FREE
      CYCLE WAVE OSCILLATOR indicator is an indicator based on cyclical price fluctuations. This indicator can help you determine overbought and oversold levels, and help you predict price trends within the cycle. MT5 Version here!  You can combine it with our indicators below to make your trading decisions more accurate: Supply Demand Ribbon MT4 Basic Feature: - Three Trend Types: + Zero + Basic + Advanced
      FREE
      This indicator filters the Zigzag indicator to calculate the main support and resistance levels. Variables minimum gap between peaks : is the distance (GAP) between the peaks of the Zigzag peaks sensitivity : Minimum number of nearby peaks look back: it means that it has to test the last 50 peaks in the Zigzag object name perfix: a prefix for level’s line name on chart
      FREE
      Valable ZigZag
      Sergey Ermolov
      4.5 (6)
      Версия MT5   |   Индикатор Trend Monitor VZ     |  Стратегия Owl Smart Levels |  Индикатор Owl Smart Levels  |   FAQ Волновая теория Эллиотта   – это интерпретация процессов на финансовых рынках, которая опирается на визуальную модель волн на графиках цены.   Индикатор Valable ZigZag   отображает   волновую структуру рынка , на которую можно опираться для принятия торговых решений. Индикатор Valable ZigZag  более стабилен  и не меняет часто свое направление подобно классическому индикатору ZigZ
      FREE
      [Отклонение каждого показателя MT4] представляет собой набор из 18 показателей, и один из них может быть произвольно выбран для участия в расчете. Он может рассчитать форму отклонения каждого индикатора и может вызвать тревогу. Описание настройки параметров: [показатели] - выбрать один из 18 показателей для участия в расчете (этот параметр очень важен) . [period] - это общий цикл для каждого индикатора. [Метод] является режимом MA некоторых индикаторов. [Apply_to] - цена приложения н
      FREE
      OrderBlock TS Roman
      Vladislav Vlastovskii
      3.8 (5)
      Индикатор строит блоки заказов (БЗ) по торговой системе (ТС) Романа. Поиск блоков осуществляется одновременно на двух таймфремах: текущем и старшем (определяемым в настройках). Для оптимизации и игнорирования устаревших блоков в настройках задается ограничение количества дней в пределах которых осуществляется поиск блоков. Блоки строятся по правилам ТС состоящем из трех шагов: какую свечу вынесли (что?); какой свечой вынесли (чем?); правило отрисовки (как?).
      FREE
      TrendPlus
      Sivakumar Subbaiya
      4.15 (13)
      Trend Plus   Trendplus  Indicator   Time Frame: Suitable for any time frame.  Purpose: Trend Prediction. Blue and red candle indicate the buy and sell call respectively. Buy: When the blue candle is formed buy call is initiated. close the buy trades when the next red candle will formed.   Sell: When the Red candle is formed Sell call is initiated. close the Sell trades when the next blue candle will formed.   Happy trade!!
      FREE
      Introduction This indicator detects volume spread patterns for buy and sell opportunity. The patterns include demand and supply patterns. You might use each pattern for trading. However, these patterns are best used to detect the demand zone (=accumulation area) and supply zone (=distribution area). Demand pattern indicates generally potential buying opportunity. Supply pattern indicates generally potential selling opportunity. These are the underlying patterns rather than direct price action. T
      FREE
      Индикатор отображает на ценовом графике сигналы осциллятора RSX.  (Для отображения этих сигналов в отдельном окне, вместе с осциллятором, используется другой индикатор - RSX Osc 4 AM ). Сигналы индикатора оптимально использовать как сигналы для открытия сделки при преодолении ценой максимума или минимума бара на котором сигнал был подан. Противоположный сигнал отменяет сигнал предыдущий. Настройки: Data period for indicator calculation - период данных для расчета индикатора; Data period to di
      FREE
      Necessary for traders: tools and indicators Waves automatically calculate indicators, channel trend trading Perfect trend-wave automatic calculation channel calculation , MT4 Perfect trend-wave automatic calculation channel calculation , MT5 Local Trading copying Easy And Fast Copy , MT4 Easy And Fast Copy , MT5 Local Trading copying For DEMO Easy And Fast Copy , MT4 DEMO Easy And Fast Copy , MT5 DEMO The homeopathic indicator is also called the CCI indicator. The CCI indicator was propos
      FREE
      Exclusive Channel on Zig Zag - это канальный индикатор для терминала MetaTrader 4. Данный индикатор строит канал по вершинам стандартного индикатора ZigZag. Если вы торгуете по индикатору ZigZag или по каналам, то Exclusive Channel on Zig Zag это отличный выбор для вас. Почему стоит выбрать Exclusive Channel on Zig Zag Индикатор прекрасно подходит для скальпинга и торговли внутри дня. Подходит для начинающих и опытных трейдеров. Работает на любых финансовых инструментах и рынках. Работает на л
      Necessary for traders: tools and indicators Waves automatically calculate indicators, channel trend trading Perfect trend-wave automatic calculation channel calculation , MT4 Perfect trend-wave automatic calculation channel calculation , MT5 Local Trading copying Easy And Fast Copy , MT4 Easy And Fast Copy , MT5 Local Trading copying For DEMO Easy And Fast Copy , MT4 DEMO Easy And Fast Copy , MT5 DEMO Расширенные полосы Боллинджера: 1. Рельс Боллинджера изменит цвет в зависимости от направлен
      FREE
      Discover the power of precision and efficiency in your trading with the " Super Auto Fibonacci " MT4 indicator. This cutting-edge tool is meticulously designed to enhance your technical analysis, providing you with invaluable insights to make informed trading decisions. Key Features: Automated Fibonacci Analysis: Say goodbye to the hassle of manual Fibonacci retracement and extension drawing. "Super Auto Fibonacci" instantly identifies and plots Fibonacci levels on your MT4 chart, saving you tim
      FREE
      Ratio market
      Aleksandr Krokhalev
      4.33 (15)
      Волатильность под контролем. Индикатор показывает оптимальную глубину для установки целей внутри дня и на среднем тренде. Также он строит опорные зоны для предполагаемой глубины коррекции. В качестве сопровождения отображаются ключевые уровни структуры по нескольким таймфреймам. Для расчёта используются классические индикаторы волатильности ATR & ADX на фиксированных таймфреймах. В расчётах учитывается спред, и если рынок слабо волатилен вы увидите предупреждение о риске. Можно менять цвет всех
      FREE
      RSI with Bands
      Amirhossein Ghasemi Moroodi
      После 7 лет работы я решил бесплатно предоставить некоторые из своих собственных индикаторов и экспертных советников (EA). Если вы находите их полезными, пожалуйста, поддержите меня 5-звездочным рейтингом! Ваш отзыв мотивирует меня продолжать предоставлять бесплатные инструменты. Исследуйте и мои другие бесплатные инструменты здесь . _________________________________ Индикатор "RSI с Полосами" – для более верных торговых решений Индикатор "RSI с Полосами" сочетает классический RS
      FREE
      The Penta-O is a 6-point retracement harmonacci pattern which usually precedes big market movements. Penta-O patterns can expand and repaint quite a bit. To make things easier this indicator implements a twist: it waits for a donchian breakout in the right direction before signaling the trade. The end result is an otherwise repainting indicator with a very reliable trading signal. The donchian breakout period is entered as an input. [ Installation Guide | Update Guide | Troubleshooting | FAQ | A
      This indicator helps you to comfirm SMAs' crossovers by draw a signal line that determines SMA movement direction. when Short SMA cross above Long SMA and Close price is above the signal several bars later, then uptrend is expected. when Short SMA cross below Long SMA and Close price is below the signal several bars later, then downtrend is expected. Input Description :  MA_Period_short: Short-term SMA's period. Used for short-term PriceX. Must be higher than 1.  MA_Period_long: Long-term SMA'
      FREE
      Коэффициент Фибоначчи полезен для измерения цели движения волны в структуре Волны Эллиотта. Различные волны в структуре волн Эллиотта связаны друг с другом соотношением Фибоначчи. Например, в импульсной волне: • волна 2 обычно составляет 50%, 61,8%, 76,4% или 85,4% от волны 1. Волны Фибоначчи могут быть использованы трейдерами для определения областей, где они захотят зафиксировать прибыль на следующем отрезке восходящего или нисходящего тренда.
      Indikator zur klaren Anzeige im Metatrader Dieser Indikator wurde von mir Entwickelt damit die Anzeige der relevanten Parameter klar und deutlich im Chart auf einen Blick zu sehen ist.  Er dient zur Information und ist ohne Gewähr.  Folgende Parameter werden angezeigt: -   Der  Aktuelle Kurs - Das Aktuelle Handelspaar - Die Restzeit zur nächsten Kerzenbildung / Zum Abschluss der Aktuellen Kerze - Die Kontonummer des Handelskontos - Die Frei Verfügbare Margin - Die Margin auf 1 Lot - Der Akt
      FREE
      UPD1 X00 Levels
      Vitaliy Kuznetsov
      5 (8)
      Индикатор показывает на графике   круглые уровни . Их еще называют   психологическими , банковскими или уровнями основных игроков. На этих уровнях происходит настоящая борьба быков и медведей, накопление множества ордеров, что приводит к повышенной волатильности. Индикатор   автоматически   подстраивается под любой инструмент и таймфрейм. При пробитии и последующем тесте уровня   80 - покупаем . При пробитии и последующем тесте уровня   20 - продаём . Цель - 00. Внимание. Из-за сильных уровней
      FREE
      Follow The Line
      Oliver Gideon Amofa Appiah
      4.07 (14)
      FOLLOW THE LINE GET THE FULL VERSION HERE: https://www.mql5.com/en/market/product/36024 This indicator obeys the popular maxim that: "THE TREND IS YOUR FRIEND" It paints a GREEN line for BUY and also paints a RED line for SELL.  It gives alarms and alerts of all kinds. IT DOES NOT REPAINT and can be used for all currency pairs and timeframes. Yes, as easy and simple as that. Even a newbie can use it to make great and reliable trades. NB: For best results, get my other premium indicators for more
      FREE
      A forex   pivot point   strategy could very well be a trader’s best friend as far as identifying levels to develop a bias, place stops and identify potential profit targets for a trade. Pivot points have been a go-to for traders for decades. The basis of pivot points is such that price will often move relative to a previous limit, and unless an outside force causes the price to do so, price should stop near a prior extreme. Pivot point trading strategies vary which makes it a versatile tool for
      FREE
      Ловец трендов: Стратегия Ловец трендов с индикатором оповещения - это универсальный инструмент технического анализа, который помогает трейдерам определять рыночные тренды и потенциальные точки входа и выхода. Он представляет собой динамичную стратегию Ловец трендов, адаптирующуюся к рыночным условиям для четкого визуального представления направления тренда. Трейдеры могут настраивать параметры в соответствии со своими предпочтениями и уровнем риска. Индикатор помогает в идентификации тренда,
      FREE
      Triple RSI
      Pablo Leonardo Spata
      1 (1)
      LOOK AT THE FOLLOWING STRATEGY   WITH THIS INDICATOR.   Triple RSI   is a tool that uses the classic Relative Strength Indicator, but in several timeframes to find market reversals.    1.  ️ Idea behind the indicator and its strategy: In Trading, be it Forex or any other asset, the ideal is   to keep it simple, the simpler the better . The   triple RSI   strategy is one of the simple strategies that seek market returns. In our experience, where there is more money to always be won, i
      FREE
      First of all, it is worth highlighting here that this Trading Indicator is Non Repainting, Non Redrawing and Non Lagging, which makes it ideal for manual trading. Never repaint and recalculate Once an arrow appears it never disappears, the signal comes at the opening of the new candle You will now be more profitable with this indicator You can do swing trading or scalping trading The indicator helps you identify the trend Can be optimized across all pairs and time frames Blue arrow is for buyin
      FREE
      Ищет точки входа по локальному тренду без перерисовки! Стрелками отображаются точки входа. Основан на классических индикаторах. Индикатор легкий в использовании. Подпишись на мой telegram канал,   ссылка в контактах   моего профиля . Настройки Наименование Описание Frequency factor Частота сигнала. Чем меньше, тем чаще. Соответственно, это влияет на качество. Рекомендации: Рекомендуется использовать на мажорных валютных парах. Таймфрем от м5, м15, м30
      FREE
      Basic Harmonic Pattern
      Mehran Sepah Mansoor
      4.57 (51)
      Этот индикатор определяет наиболее популярные гармонические паттерны, которые предсказывают точки разворота рынка. Эти гармонические паттерны представляют собой ценовые формации, которые постоянно повторяются на рынке Форекс и указывают на возможные будущие движения цены / Бесплатная версия MT5 Кроме того, данный индикатор имеет встроенный сигнал входа в рынок, а также различные тейк-профиты и стоп-лоссы. Следует отметить, что хотя индикатор гармонических паттернов может сам по себе давать си
      FREE
      С этим продуктом покупают
      Gann Made Easy - это профессиональная, но при этом очень простая в применении Форекс система, основанная на лучших принципах торговли по методам господина У.Д. Ганна. Индикатор дает точные BUY/SELL сигналы, включающие в себя уровни Stop Loss и Take Profit. Пожалуйста, напишите мне после покупки! Я поделюсь своими рекомендациями по использованию индикатора. Также вас ждет отличный бонусный индикатор в подарок! Вероятно вы уже не раз слышали о торговли по методам Ганна. Как правило теория Ганна от
      Official Release price of $65 for the first 54 /60   copies ( 6  copies left). Next price is $120 !  Send us a message after your purchase to receive more information on how to get your  BONUS  for FREE  that works in great combination with Bull vs Bear ! Bull versus Bear is an easy-to-use Forex indicator that gives traders clear and accurate signals based on clear trend retests . Forget about lagging indicators or staring at charts for hours because  Bull vs Bear provides real-time entries
      - Real price is 80$ - 40% Discount ( It is 49$ now ) Contact me for instruction, add group and any questions! Related Products:  Bitcoin Expert , Gold Expert Introduction The breakout and retest strategy is traded support and resistance levels. it involves price breaking through a previous level.  The break and retest strategy is designed to help traders do two main things, the first is to avoid false breakouts. Many false breakouts start with a candlestick that breaks out of a level but ends w
      FX Volume
      Daniel Stein
      4.58 (33)
      Получайте ежедневную информацию о рынке с подробностями и скриншотами в нашем утреннем брифинге здесь, на mql5 , и в Telegram ! FX Volume - это ПЕРВЫЙ и ЕДИНСТВЕННЫЙ индикатор объема, который дает РЕАЛЬНОЕ представление о настроении рынка с точки зрения брокера. Он дает потрясающее представление о том, как институциональные участники рынка, такие как брокеры, позиционируют себя на рынке Forex, гораздо быстрее, чем отчеты COT. Видеть эту информацию прямо на своем графике - это настоящий геймчей
      Gold Stuff
      Vasiliy Strukov
      4.89 (242)
      Gold Stuff - трендовый индикатор, разработанный специально для золота, также может использоваться на любых финансовых инструментах. Индикатор не перерисовывается и не запаздывает. Рекомендуемый тайм-фрейм H1.  По данному индикатору написан советник EA Gold Stuff, Вы можете найти его в моем профиле. Свяжитесь со мной сразу после покупки для получения   персонального бонуса!  Вы можете получить бесплатную копию нашего индикатора Strong Support and Trend Scanner, пожалуйста, в личку. мне! Настройки
      Получайте ежедневную информацию о рынке с подробностями и скриншотами через наш утренний брифинг здесь, на mql5 , и в Telegram ! FX Power MT4 NG - это новое поколение нашего популярного измерителя силы валют FX Power. Что же предлагает этот измеритель силы нового поколения? Все, что вы любили в оригинальном FX Power ПЛЮС Анализ силы GOLD/XAU Еще более точные результаты расчетов Индивидуально настраиваемые периоды анализа Настраиваемый предел расчета для еще более высокой производительности Спец
      Trend Screener
      STE S.S.COMPANY
      4.81 (88)
      Индикатор тренда, революционное уникальное решение для торговли и фильтрации тренда со всеми важными функциями тренда, встроенными в один инструмент! Это 100% неперерисовывающийся мультитаймфреймный и мультивалютный индикатор, который можно использовать на всех инструментах/инструментах: форекс, товары, криптовалюты, индексы, акции. ПРЕДЛОЖЕНИЕ ОГРАНИЧЕННОГО ВРЕМЕНИ: Индикатор скринера поддержки и сопротивления доступен всего за 50$ и бессрочно. (Изначальная цена 250$) (предложение продлено) Tre
      Прежде всего стоит подчеркнуть, что этот торговый индикатор не перерисовывается, не перерисовывает и не отставает, что делает его идеальным как для ручной, так и для роботизированной торговли. Руководство пользователя: настройки, вводы и стратегия. Атомный аналитик - это индикатор ценового действия PA, который использует силу и импульс цены, чтобы найти лучший край на рынке. Оборудованный расширенными фильтрами, которые помогают убирать шумы и ложные сигналы, и повышают торговый потенциал. Испо
      Инновационный индикатор, использующий эксклюзивный алгоритм для быстрого и точного определения тренда. Индикатор автоматически рассчитывает время открытия и закрытия позиций, а также подробную статистику работы индикатора на заданном отрезке истории, что позволяет выбрать наилучший торговый инструмент для торговли. Вы также можете подключить свои пользовательские стрелочные индикаторы к Scalper Inside Pro для проверки и расчета их статистики и прибыльности. Scalper Inside PRO (версии 6.5 и выше)
      TPSproTREND PrO
      Roman Podpora
      4.79 (19)
      TPSpro TREND PRO   —  трендовый индикатор, который автоматически анализирует рынок и предоставляет информацию о тренде и каждой его смене а также дающий сигналы для входа в сделки без перерисовки! Индикатор использует каждую свечу, анализируя их отдельно. относя к разным импульсам – импульс вверх или вниз. Точные точки входа в сделки  для  валют, крипты, металлов, акций, индексов! Version MT5           ПОЛНОЕ ОПИСАНИЕ ИНДИКАТОРА           Рекомендуем использовать с  индикатором -  RFI LEVELS
      FX Levels - это исключительно точный индикатор поддержки и сопротивления, объединяющий традиционный метод Lighthouse с инновационным динамическим подходом и безупречно работающий на всех торговых инструментах. Это касается и валютных пар, и индексов, и акций, и сырьевых товаров. FX Levels определяет точки разворота и отображает их на графике, которые могут быть идеально использованы в качестве целей прибыли в вашей торговой деятельности. При разработке FX Levels мы использовали наш богатый опыт
      The Stochastic Basket Currency Strenght  brings the Stochastic indicator to a new level.  Expanding the boundaries of TimeFrames and mono-currency analysis, the SBCS take the movements of each currency that composes the cross and confront them in the whole basket of 7 crosses.  The indicator works with any combination of AUD, CAD, CHF, EUR, GBP, JPY, NZD, USD pairs and with full automation takes in account every stochastic value (main line) for the selected Time Frame.  After that, the indicator
      Stratos Pali Indicator   is a revolutionary tool designed to enhance your trading strategy by accurately identifying market trends. This sophisticated indicator uses a unique algorithm to generate a complete histogram, which records when the trend is Long or Short. When a trend reversal occurs, an arrow appears, indicating the new direction of the trend. Important Information Revealed Leave a review and contact me via mql5 message to receive My Top 5 set files for Stratos Pali at no cost! D
      Reversal-Arrow: Определите точки разворота с точностью и надежностью Reversal-Arrow — это продвинутый индикатор, созданный для помощи трейдерам всех уровней в определении потенциальных точек разворота тренда. Индикатор предоставляет четкие и визуальные сигналы, чтобы помочь вам лучше понимать рыночный контекст, снижая неопределенность и облегчая процесс принятия решений. Reversal-Arrow оптимизирован специально для пар XAUUSD и XAUEUR на таймфреймах 1 минута, 5 минут и 15 минут, где он показывает
      Важным ключевым элементом в трейдинге являются зоны или уровни, от которых принимаются решения о покупке или продаже торгового инструмента. Несмотря на попытки крупных игроков скрыть свое присутствие на рынке, они неизбежно оставляют следы. Наша задача заключалась в том, чтобы научиться находить эти следы и правильно их интерпретировать. INSTRUCTIONS     RUS   -    ENG                    Рекомендуем использовать с индикатором -   TPSpro  TREND PRO -  Version MT5 Основные функции: Отображения ак
      Dynamic Forex28 Navigator — инструмент для торговли на рынке Форекс нового поколения. В НАСТОЯЩЕЕ ВРЕМЯ СКИДКА 49%. Dynamic Forex28 Navigator — это эволюция наших популярных индикаторов, объединяющая мощь трех в одном: Advanced Currency Strength28 Indicator (695 отзывов) + Advanced Currency IMPULSE with ALERT (520 отзывов) + CS28 Combo Signals (бонус). Подробности об индикаторе https://www.mql5.com/en/blogs/post/758844 Что предлагает индикатор Strength нового поколения?  Все, что вам нрав
      Advanced Supply Demand
      Bernhard Schweigert
      4.91 (295)
      Этот индикатор является уникальным, качественным и доступным инструментом для торговли, включающим в себя наши собственные разработки и новую формулу. В обновленной версии появилась возможность отображать зоны двух таймфреймов. Это означает, что вам будут доступны зоны не только на старшем ТФ, а сразу с двух таймфреймов - таймфрейма графика и старшего: отображение вложенных зон. Обновление обязательно понравится всем трейдерам, торгующим по зонам спроса и предложения. Важная информация Для мак
      Эта панель показывает последние доступные гармонические паттерны для выбранных символов, так что вы сэкономите время и будете более эффективны / MT5 версия . Бесплатный индикатор: Basic Harmonic Pattern Колонки индикатора Symbol: отображаются выбранные символы Trend : бычий или медвежий Pattern : тип паттерна (Гартли, бабочка, летучая мышь, краб, акула, шифр или ABCD) Entry : цена входа SL: цена стоп-лосса TP1: цена первого тейк-профита TP2: цена второго тейк-профита TP3: цена 3-го тейк-про
      В НАСТОЯЩЕЕ ВРЕМЯ СКИДКА 20%! Лучшее решение для новичка или трейдера-эксперта! Этот индикатор специализирован для отображения силы валюты для любых символов, таких как экзотические пары, товары, индексы или фьючерсы. Впервые в своем роде, любой символ может быть добавлен в 9-ю строку, чтобы показать истинную силу валюты золота, серебра, нефти, DAX, US30, MXN, TRY, CNH и т.д. Это уникальный, высококачественный и доступный торговый инструмент, потому что мы включили в него ряд собственных функци
      Представляем       Индикатор Quantum Trend Sniper   , инновационный индикатор MQL5, который меняет способ определения разворотов тренда и торговли ими! Разработан командой опытных трейдеров со стажем торговли более 13 лет,       Снайперский индикатор Quantum Trend       разработан, чтобы вывести ваше торговое путешествие на новые высоты благодаря инновационному способу определения разворотов тренда с чрезвычайно высокой точностью. ***Купите индикатор Quantum Trend Sniper и получите индикатор
      В настоящее время скидка 20%! Лучшее решение для новичка или трейдера-эксперта! Эта приборная панель работает на 28 валютных парах. Он основан на 2 наших основных индикаторах (Advanced Currency Strength 28 и Advanced Currency Impulse). Он дает отличный обзор всего рынка Forex. Он показывает значения Advanced Currency Strength, скорость движения валюты и сигналы для 28 пар Forex на всех (9) таймфреймах. Представьте, как улучшится ваша торговля, когда вы сможете наблюдать за всем рынком с пом
      Прежде всего стоит подчеркнуть, что этот Торговый Инструмент является Неперерисовывающимся Нерепейнтинговым Индикатором, что делает его идеальным для профессиональной торговли. Онлайн-курс, руководство пользователя и демонстрация. Индикатор Концепций Умного Действия Цены - очень мощный инструмент как для новичков, так и для опытных трейдеров. Он объединяет более 20 полезных индикаторов в одном, комбинируя передовые торговые идеи, такие как анализ Inner Circle Trader и стратегии торговли конц
      Оставьте комментарий после покупки, чтобы получить 4 высококачественных индикатора в качестве бонуса. Индикатор Chart Patterns All-in-One помогает трейдерам визуализировать различные графические модели, которые широко используются в техническом анализе. Он помогает определить возможное поведение рынка, но не гарантирует прибыльность. Рекомендуется протестировать индикатор в демо-режиме перед покупкой. Текущая акция : Скидка 50% на индикатор "Chart Patterns All in One". Включенные модели : Модель
      СЕЙЧАС СКИДКА 31% !!! Лучшее решение для новичка или трейдера-эксперта! Этот индикатор является уникальным, высококачественным и доступным торговым инструментом, поскольку мы включили в него ряд собственных функций и секретную формулу. Всего на ОДНОМ графике он выдает алерты по всем 28 валютным парам. Представьте, как улучшится ваша торговля, ведь вы сможете точно определить точку запуска нового тренда или возможность скальпирования! Построенный на новых базовых алгоритмах, он позволяет е
      Enigmera
      Ivan Stefanov
      5 (3)
      ЭНИГМЕРА: ядро рынка https://www.enigmera.com Введение Этот индикатор и торговая система представляют собой удивительный подход к финансовым рынкам. ENIGMERA использует фрактальные циклы для точного расчета уровней поддержки и сопротивления. Он показывает подлинную фазу накопления и дает направление и цели.  Система, которая работает независимо от того, находимся ли мы в тренде или в коррекции.  Как она работает? ENIGMERA состоит из трех линий: линии поддержки/сопротивления, линии цели и ли
      ПОЖАЛУЙСТА, ПРОЧТИТЕ ИНФОРМАЦИЮ НИЖЕ ПЕРЕД ПОКУПКОЙ! Apollo Pips PLUS SP – уникальный продукт! ЭТО ДЛЯ ТЕХ, КТО ХОЧЕТ ПОЛУЧИТЬ МОЙ НОВЫЙ ИНДИКАТОР «APOLLO PIPS» + БОНУС «SUPER PACK» С ДОСТУПОМ КО ВСЕМ МОИМ ТОРГОВЫМ ИНДИКАТОРАМ! Покупая продукт Apollo Pips PLUS SP, вы фактически приобретаете абсолютно новую версию моего индикатора Apollo Pips. Эта версия индикатора имеет улучшенный алгоритм и простой в использовании параметр, который дает вам возможность использовать индикатор на любом рынке и в
      Scalper Vault — это профессиональная торговая система, которая дает вам все необходимое для успешного скальпинга. Этот индикатор представляет собой полную торговую систему, которую могут использовать трейдеры форекс и бинарных опционов. Рекомендуемый тайм фрейм М5. Система дает точные стрелочные сигналы в направлении тренда. Она также предоставляет вам сигналы выхода и рассчитывает рыночные уровни Ганна. Индикатор дает все типы оповещений, включая PUSH-уведомления. Пожалуйста, напишите мне после
      - 50% OFF - Telegram group : https://t.me/+5RIceImV_OJmNDA0 MT5 version : https://www.mql5.com/en/market/product/85917?source=Site+Market+Product+Page Master Pullback is a complete system that gives unique trading opportunities and a clear indication of the market: trend, signals as well as stop loss and take profit levels. This system has been designed to be as simple as possible and detects extreme overbought and oversold zones, support and resistance levels, as well as the major trend. You
      IX Power MT4
      Daniel Stein
      4.67 (6)
      IX Power , наконец, предлагает непревзойденную точность FX Power для нефорексных символов. Он точно определяет интенсивность краткосрочных, среднесрочных и долгосрочных трендов в ваших любимых индексах, акциях, товарах, ETF и даже криптовалютах. Вы можете анализировать все, что может предложить ваш терминал. Попробуйте и почувствуйте, как значительно улучшается ваш тайминг при торговле. Ключевые особенности IX Power 100% точные результаты расчетов без перерисовки - для всех торговых сим
      TakePropips Donchian Trend Pro
      Eric John Pajarillaga Aldana
      4.44 (16)
      TakePropips Donchian Trend Pro   (MT4) — это мощный и эффективный инструмент, который автоматически определяет направление тренда с помощью канала Дончиана и предоставляет вам торговые сигналы для входа и выхода! Этот многофункциональный индикатор включает в себя сканер тренда, торговые сигналы, статистическую панель, скринер, торговые сессии и панель истории предупреждений. Он разработан, чтобы предоставить вам торговые сигналы и сэкономить время на анализе графиков! Вы можете скачать руководст
      Другие продукты этого автора
      AI Swing MT4
      Reza Aghajanpour
      5 (1)
      Introduction : AI Swing EA is a fully automated trader with Fixed SL and high win rate. The price is $1000, But now it is just $249, Limited time offer is active. Real Live Signal 1:  https://www.mql5.com/en/signals/2264899 Real Live Signal 2: https://www.mql5.com/en/signals/2256860 No Martingale, No Grid Contact me  to send you instruction and add you in group. Passed Prop Firm challenges The next generation G P T AI model quickly gained significant attention with its broad range of capabili
      ** All Symbols x All Timeframes scan just by pressing scanner button ** *** Contact me  to send you instruction and add you in "123 scanner group" for sharing or seeing experiences with other users. After 17 years of experience in the markets and programming, Winner indicator is ready. I would like to share with you! Introduction The 123 Pattern Scanner indicator with a special enhanced algorithm is a very repetitive common pattern finder with a high success rate . Interestingly, this Winner in
      Market Structure
      Reza Aghajanpour
      4.85 (26)
      ** All Symbols x All Timeframes scan just by pressing scanner button ** *** Contact me  to send you instruction and add you in "Market Structure group" for sharing or seeing experiences with other users. Introduction: Market structure is important for both new and professional traders since it can influence the liquidity and price action of a market (Breakout and Retest). It’s also one of the most commonly used techniques to understand trends, identify potential reversal points, and get a feel f
      **   All Symbols   x   All Timeframes   scan just by pressing scanner button ** *** Contact me  to send you instruction and add you in "Trend Reversal group" for sharing or seeing experiences with other users. Introduction: Trendlines are the most famous technical analysis in trading . Trendlines continually form on the charts of markets across all the different timeframes providing huge opportunities for traders to jump in and profit on the action. In the other hand,  The trendline reversal str
      **   All Symbols   x   All Timeframes   scan just by pressing scanner button ** *** Contact me  to send you instruction and add you in "Trend Reversal group" for sharing or seeing experiences with other users. Introduction: Trendlines are the most famous technical analysis in trading . Trend lines continually form on the charts of markets across all the different timeframes providing huge opportunities for traders to jump in and profit on the action. In the other hand,  The trend line reversal s
      ** All Symbols x All Timeframes scan just by pressing scanner button ** *** Contact me  to send you instruction and add you in "All Divergences scanner group" for sharing or seeing experiences with other users. Introduction Divergence is a main technique used to determine trend reversing when it’s time to sell or buy because prices are likely to drop or pick in the charts. All Divergence indicator can help you locate the top and bottom of the market. This indicator finds Regular divergences for
      Contact me  to send you instruction and add you in group. QM (Quasimodo) Pattern is based on Read The Market(RTM) concepts. The purpose of this model is to face the big players of the market (financial institutions and banks), As you know in financial markets, big traders try to fool small traders, but RTM prevent traders from getting trapped. This style is formed in terms of price candles and presented according to market supply and demand areas and no price oscillator is used in it. RTM con
      Swing Scanner
      Reza Aghajanpour
      4.6 (20)
      ** All Symbols x All Time frames scan just by pressing scanner button ** *** Contact me  to send you instruction and add you in "Swing scanner group" for sharing or seeing experiences with other users. Swing EA:  https://www.mql5.com/en/market/product/124747 Introduction: Swing Scanner is the indicator designed to detect swings in the direction of the trend and possible reversal swings. The indicator studies several price and time vectors to track the aggregate trend direction and detects situa
      **   All Symbols   x   All Timeframes   scan just by pressing scanner button ** *** Contact me  to send you instruction and add you in "M W Scanner group" for sharing or seeing experiences with other users. Introduction: Double Top(M) and Double Bottom(W) is a very repetitive common type of price reversal patterns. Double Top resembles M pattern and indicates bearish reversal whereas Double Bottom resembles W pattern and indicates a bullish reversal that they have  high win  rate. The M W Scanne
      **  All Symbols  x  All Timeframes  scan just by pressing scanner button ** *** Contact me  to send you instruction and add you in "Wolfe Wave Scanner group" for sharing or seeing experiences with other users. Introduction: A Wolfe Wave is created with five-wave patterns in price. It shows supply and demand and a fight towards a balance price. T hese waves of price actions can help traders identify the boundaries of   the trend . Also  It helps forecast how the price will move in the near futu
      Contact me  to send you instruction and add you in group. QM (Quasimodo) Pattern is based on Read The Market(RTM) concepts. The purpose of this model is to face the big players of the market (financial institutions and banks), As you know in financial markets, big traders try to fool small traders, but RTM prevent traders from getting trapped. This style is formed in terms of price candles and presented according to market supply and demand areas and no price oscillator is used in it. RTM con
      AI Next Level
      Reza Aghajanpour
      5 (1)
      The next generation G P T AI model quickly gained significant attention with its broad range of capabilities and versatility, We used its expertise in assisting prediction prices in formulating and applying improved trading strategies. Our AI core is capable of extracting data insights from financial news, Sentiment Analysis , specific formula, Oscillators and indicators status and other unstructured data sources. This information can then be used in conjunction with other datasets to make our
      ** All Symbols x All Timeframes scan just by pressing scanner button ** *** Contact me  to send you instruction and add you in "ABCD scanner group" for sharing or seeing experiences with other users. Introduction This indicator scans AB=CD retracement patterns in all charts. The ABCD is the basic foundation for all harmonic patterns and highly repetitive with a high success rate . The ABCD Scanner indicator is a scanner reversal ABCD pattern that helps you identify when the price is about to ch
      Market Heartbeat is in your hand! Introduction The Market Heartbeat indicator with a   special enhanced algorithm   (volume, money flow, cycle of market and a secret value) is a very repetitive trend finder with a high success rate .   Interestingly, this   Winner indicator   indicates that the trend has changed its direction or the end of a trend retracement or even appears at the range market. The Market Heartbeat can use in scalping trading or trend trading. It finds immediately with alarm, n
      ** All Symbols x All Time frames scan just by pressing scanner button ** *** Contact me  to send you instruction and add you in "Harmonic Scanner group" for sharing or seeing experiences with other users. Introduction Harmonic Patterns are best used to predict turning point. Harmonic Patterns give you high win rate and high opportunities for trade in during one day. This indicator detects the best and successful patterns base on Harmonic Trading books . The Harmonic Patterns Scanner Scans All ch
      ** All Symbols x All Timeframes scan just by pressing scanner button ** *** Contact me  to send you instruction and add you in "ABCD scanner group" for sharing or seeing experiences with other users. Introduction This indicator scans AB=CD retracement patterns in all charts. The ABCD is the basic foundation for all harmonic patterns and highly repetitive with a high success rate . The ABCD Scanner indicator is a scanner reversal ABCD pattern that helps you identify when the price is about to cha
      ** All Symbols x All Time frames scan just by pressing scanner button ** *** Contact me  to send you instruction and add you in "Divergence group" for sharing or seeing experiences with other users. Introduction MACD divergence is a main technique used to determine trend reversing when it’s time to sell or buy because prices are likely to drop or pick in the charts. The MACD Divergence indicator can help you locate the top and bottom of the market. This indicator finds Regular divergence for pul
      **   All Symbols   x   All Timeframes   scan just by pressing scanner button ** *** Contact me  to send you instruction and add you in "Market Structure group" for sharing or seeing experiences with other users. Introduction: Market structure is important for both new and professional traders since it can influence the liquidity and price action of a market. It’s also one of the most commonly used techniques to understand trends, identify potential reversal points, and get a feel for current mar
      M W Scanner
      Reza Aghajanpour
      5 (8)
      **   All Symbols   x   All Timeframes   scan just by pressing scanner button ** *** Contact me  to send you instruction and add you in "M W Scanner group" for sharing or seeing experiences with other users. Introduction: Double Top(M) and Double Bottom(W) is a very repetitive common type of price reversal patterns. Double Top resembles M pattern and indicates bearish reversal whereas Double Bottom resembles W pattern and indicates a bullish reversal that they have  high win  rate. The M W Scanne
      **  All Symbols  x  All Timeframes  scan just by pressing scanner button ** *** Contact me  to send you instruction and add you in "Wolfe Wave Scanner group" for sharing or seeing experiences with other users. Introduction: A Wolfe Wave is created with five-wave patterns in price. It shows supply and demand and a fight towards a balance price. T hese waves of price actions can help traders identify the boundaries of   the trend . Also  It helps forecast how the price will move in the near future
      **   All Symbols   x   All Time frames   scan just by pressing scanner button ** *** Contact me  to send you instruction and add you in "Swing scanner group" for sharing or seeing experiences with other users. Swing EA:  https://www.mql5.com/en/market/product/124747 Introduction: Swing Scanner   is the indicator designed to detect swings in the direction of the trend and possible reversal swings. The indicator studies several price and time vectors to track the aggregate trend direction and dete
      **   All Symbols   x   All Timeframes   scan just by pressing scanner button ** *** Contact me  to send you instruction and add you in "Head & Shoulders Scanner group" for sharing or seeing experiences with other users. Introduction: Head and Shoulders   Pattern  is a very repetitive common type of price reversal patterns. The pattern appears on all time frames and can be used by all types of traders and investors.   The  Head and Shoulders  Scanner indicator  Scans All charts just by pressing o
      ** All Symbols x All Timeframes scan just by pressing scanner button ** *** Contact me  to send you instruction and add you in "RSI scanner group" for sharing or seeing experiences with other users. Introduction RSI divergence is a main technique used to determine trend reversing when it’s time to sell or buy because prices are likely to drop or pick in the charts. The RSI Divergence indicator can help you locate the top and bottom of the market. This indicator finds Regular divergence for pu
      ** All Symbols x All Timeframes scan just by pressing scanner button ** ***Contact me to send you instruction and add you in "RSI scanner group" for sharing or seeing experiences with other users. Introduction RSI divergence is a main technique used to determine trend reversing when it’s time to sell or buy because prices are likely to drop or pick in the charts. The RSI Divergence indicator can help you locate the top and bottom of the market. This indicator finds Regular divergence for pullba
      Introduction RSI divergence is a main technique used to determine trend reversing when it’s time to sell or buy because prices are likely to drop or pick in the charts. The RSI Divergence indicator can help you locate the top and bottom of the market. This indicator finds Regular divergence for pullback the market and also finds hidden RSI Divergence to show continuing trend. This indicator shows divergence on the RSI that is a strong hint for an excellent entry point and finds immediately with
      FREE
      **   All Symbols   x   All Timeframes   scan just by pressing scanner button ** *** Contact me  to send you instruction and add you in "Channel Scanner group" for sharing or seeing experiences with other users. Introduction: The Channel pattern is described as the area located between two trend lines. This area is used for a measure of a trading range. In this case, the upper trend line connects price highs while the lower trend line connects price lows. Also when it comes to breakout points, it
      ** All Symbols x All Time frames scan just by pressing scanner button ** *** Contact me  to send you instruction and add you in "Harmonic Scanner group" for sharing or seeing experiences with other users. Introduction Harmonic Patterns are best used to predict turning point. Harmonic Patterns give you high win rate and high opportunities for trade in during one day. This indicator detects the best and successful patterns based on Harmonic Trading concepts . The   Harmonic Patterns   Scanner   Sc
      ** All Symbols x All Time frames scan just by pressing scanner button ** *** Contact me  to send you instruction and add you in "Divergence group" for sharing or seeing experiences with other users. Introduction MACD divergence is a main technique used to determine trend reversing when it’s time to sell or buy because prices are likely to drop or pick in the charts. The MACD Divergence indicator can help you locate the top and bottom of the market. This indicator finds Regular divergence for pul
      **   All Symbols   x   All Timeframes   scan just by pressing scanner button ** *** Contact me  to send you instruction and add you in "Head & Shoulders Scanner group" for sharing or seeing experiences with other users. Introduction: Head and Shoulders   Pattern  is a very repetitive common type of price reversal patterns.   The pattern appears on all time frames and can be used by all types of traders and investors.   The  Head and Shoulders  Scanner indicator  Scans All charts just by pressing
      ** All Symbols x All Time frames scan just by pressing scanner button ** *** Contact me  to send you instruction and add you in "Order Block group" for sharing or seeing experiences with other users. Introduction: The central banks and financial institutions mainly drive the market, Order block is considered a market behavior that indicates accumulation of orders from banks and institutions, then the market tends to make a sharp move(Imbalance) on either side once the order block is completed. O
      Фильтр:
      NaraChid
      71
      NaraChid 2024.09.25 17:07 
       

      Excellent tool and prompt support

      Khalid Karim
      390
      Khalid Karim 2024.09.12 07:36 
       

      great product. less but accurate signals. simple and smooth.

      aph.andy
      308
      aph.andy 2024.07.17 07:43 
       

      Very good indicator. If you follow the manual Reza give you, the indicator will be work like charm. Thank you for the support Reza. Really recommended.

      Sjackson
      97
      Sjackson 2024.06.13 00:52 
       

      If you have a strategy that works well with indicator, then this is the only indicator you will need. Exceptional customer service! If the indicator is not operating as expected, he will fix bug and push update without question.

      zjd_77
      32
      zjd_77 2024.05.13 18:02 
       

      Пользователь не оставил комментарий к оценке

      sami57
      119
      sami57 2024.05.13 14:11 
       

      all indicators work very well

      Giulio Franceschini
      542
      Giulio Franceschini 2024.03.09 09:53 
       

      Hi Reza I'm using 123 Pattern scanners for 1 day in real, out of 14 trades done only 2 at stop loss and two still in progress, it's a fantastic indicator you did an extraordinary job, thank you. It would be even nicer if you could set the scanner for WIN RATIO, thus having the possibility that the scanner sends signals only for example for crosses with a win ratio greater than 70 or 75 - 80 or a selectable percentage of your choice. I don't know if this is feasible but it would become a SUPER indicator!!

      asahi0808
      175
      asahi0808 2024.01.07 22:11 
       

      Пользователь не оставил комментарий к оценке

      guiguibrl
      42
      guiguibrl 2023.12.16 07:26 
       

      91% win rate in M30 eur/usd and 88% jp225 M5 very accurate win rate (25win for 4 loss)

      Reza Aghajanpour
      86832
      Ответ разработчика Reza Aghajanpour 2023.12.16 08:07
      Thank you for your awesome feedback.🌹⛱️🏖️🥇
      Enjoy your trading.⭐⭐⭐⭐⭐
      Oleg Pozdnyakov
      736
      Oleg Pozdnyakov 2023.10.28 11:16 
       

      Отличная работа и поддержка автора!!!

      Reza Aghajanpour
      86832
      Ответ разработчика Reza Aghajanpour 2023.10.28 14:57
      Thank you for your awesome feedback.🌹⛱️🏖️🥇
      Enjoy your trading.⭐⭐⭐⭐⭐
      Tony Gregg
      761
      Tony Gregg 2023.10.14 17:13 
       

      Probably the best 123 Indicator on MT4 right now.

      Reza Aghajanpour
      86832
      Ответ разработчика Reza Aghajanpour 2023.10.14 17:25
      Thank you for your awesome feedback. It is my pride.😍🌹🌹🙏
      Enjoy your trading. ⭐⭐⭐⭐⭐
      MissyD1202
      283
      MissyD1202 2023.09.22 11:54 
       

      Very good indicator and scanner, makes seeing the price structure much easier. Highly recommended.

      Reza Aghajanpour
      86832
      Ответ разработчика Reza Aghajanpour 2023.09.22 16:19
      Thank you for your warm feedback. It is my pride.😍🌹🌹🙏
      Enjoy your trading. ⭐⭐⭐⭐⭐
      Ck.
      1041
      Ck. 2023.09.01 16:14 
       

      Great work and support by author.

      Reza Aghajanpour
      86832
      Ответ разработчика Reza Aghajanpour 2023.09.01 16:16
      Thank you for your awesome feedback. It is my pride.😍🌹🌹🙏
      Enjoy your trading. ⭐⭐⭐⭐⭐
      quitdayjob247
      144
      quitdayjob247 2023.07.01 20:55 
       

      not worth $39 more like $1, i tested default settings on two charts to verify it's consistency. Some how i set it up wrong message from author. One chart shows all patterns with 15 minutes intervals working fine , 2nd chart on same demo server different account / MT4 with same settings doesn't show all patterns. If i'm wrong by dragging and dropping in chart and using default settings i accept my $39 loss.

      *1.33* Version going to test it this coming Week 08/06 on my live account.

      *1.38* IS a Winner, combined with MA + Fib levels for confirmation.

      Ich Khiem Nguyen
      232
      Ich Khiem Nguyen 2023.05.28 18:43 
       

      Works very well. Method Pattern mode should be used for trend trading with a high R:R ratio. However, to increase the win rate, I think the Breakout method is reasonable. The indicator saves a lot of time

      Reza Aghajanpour
      86832
      Ответ разработчика Reza Aghajanpour 2023.05.28 20:57
      Thank you for your awesome feedback. It is my pride.😍🌹🌹🙏
      Enjoy your trading. ⭐⭐⭐⭐⭐
      Alireza Saeedi
      234
      Alireza Saeedi 2023.05.18 18:34 
       

      Пользователь не оставил комментарий к оценке

      Reza Aghajanpour
      86832
      Ответ разработчика Reza Aghajanpour 2023.05.18 21:40
      Thank you for your awesome feedback. It is my pride.😍🌹🌹🙏
      Enjoy your trading. ⭐⭐⭐⭐⭐
      Devonish
      3043
      Devonish 2023.04.08 16:36 
       

      I like it. I also agree with JACK_LE_CHAT's comments.

      Reza Aghajanpour
      86832
      Ответ разработчика Reza Aghajanpour 2023.04.08 17:29
      Thank you for your positive feedback. It is my pride.😍🌹🌹🙏
      Enjoy your trading. ⭐⭐⭐⭐⭐
      Chiedozie
      140
      Chiedozie 2023.04.02 18:29 
       

      Пользователь не оставил комментарий к оценке

      Reza Aghajanpour
      86832
      Ответ разработчика Reza Aghajanpour 2023.04.02 19:07
      Thank you for your awesome feedback. It is my pride.😍🌹🌹🙏
      Enjoy your trading. ⭐⭐⭐⭐⭐
      Dmitrii Castravet
      464
      Dmitrii Castravet 2023.03.20 17:39 
       

      It says no repaint. But clear it does repaint.

      JACK_LE_CHAT
      360
      JACK_LE_CHAT 2023.03.17 01:20 
       

      I added this indicator to my trading tool kit a couple of weeks ago. Further to extensive testing with various instruments under various market conditions, I can assess that it provides very accurate signals based on the exact calculation of 123-patterns on any time frame. I shall however add a warning to the present review. Even though this indicator may make trading look pretty much easy at first glance, beginners must be very careful since its apparent simplicity is not a free ticket to ride: one should always have the signals confirmed by means of sound peripheral analysis of the market context, and only jump into trades when the 123-patterns displayed are thoroughly examined within the framework of a sturdy strategy taking confluences into account. If such a methodology is carefully implemented, this indicator is a highway to profits! On top of this, its author, M. Reza, is very supportive and always ready to help and advise. Bravo, and keep up with the great work ! MF

      Reza Aghajanpour
      86832
      Ответ разработчика Reza Aghajanpour 2023.03.17 06:22
      Thank you for your awesome feedback. It is my pride.😍🌹🌹🙏
      Enjoy your trading. ⭐⭐⭐⭐⭐
      Ответ на отзыв
      Версия 1.39 2024.08.20
      - Fixed Object name issue
      Версия 1.38 2024.06.05
      - Fixed sending email notification
      Версия 1.37 2024.06.03
      - Alert Display in input setting
      Версия 1.36 2024.04.22
      - Added symbol for scan in input setting

      - Solved issue in Strategy Tester & buffer

      - Improved print messages
      Версия 1.35 2024.03.06
      - Added Font size for dashboard
      Версия 1.34 2023.08.18
      - Added "Ichimoku Filtering" in input setting. (it is disabled by default )
      Версия 1.33 2023.08.05
      - Improved Strategy Tester
      Версия 1.32 2023.02.05
      - Added new option : Select Time Frames for scan in input setting
      Версия 1.31 2023.02.01
      - Added email notification
      Версия 1.30 2023.01.06
      - Fixed M1 timeframe button bug
      Версия 1.29 2022.09.15
      - Edit Push signals to file
      Версия 1.28 2022.09.15
      - Edit push signals to file
      Версия 1.27 2022.09.15
      - Push signals to file
      Версия 1.26 2022.09.13
      - Improved Printing
      Версия 1.25 2022.09.02
      - Improved Printing - Part2
      Версия 1.24 2022.09.02
      - Improved Printing
      Версия 1.23 2022.09.01
      - Fixed dashboard bug
      Версия 1.22 2022.09.01
      - Added Statistics Dashboard
      Версия 1.21 2022.07.18
      - Solved a bug
      Версия 1.20 2022.06.26
      - Remove just 123 indicator objects in changing TF and Keep other objects from other indicators.
      Версия 1.19 2022.05.31
      - Fixed a bug
      Версия 1.18 2022.05.29
      - Fixed a bug
      Версия 1.17 2022.05.14
      - Fixed a buffer bug
      Версия 1.16 2022.04.24
      - Add "H" button for hiding all buttons
      Версия 1.15 2022.04.20
      - Add SL & TP & Entry point levels in alert message
      Версия 1.14 2022.04.14
      - Improved buffers and Added signal buffer(Buy=1 / Sell=0) for creating EA
      - Fixed a bug
      Версия 1.13 2022.04.04
      - Fixed a bug,
      Please download new version
      Версия 1.12 2022.04.04
      - Imroved scan
      Версия 1.11 2022.03.29
      - Fixed a small bug
      Версия 1.10 2022.03.28
      - Updated chart view option(white,Black,Don't change)
      Версия 1.9 2022.03.28
      - changed "chart view" option in input part
      Версия 1.8 2022.03.24
      - Add "H" button : Hidden all buttons on chart
      Версия 1.7 2022.03.21
      - Add "Chart View black" in input section: change color chart to black(Default MT4)
      - changed "scan the number of candles in open chart" to 500
      Версия 1.6 2022.03.09
      - Add pattern name in alarm and notification based on users ask
      Версия 1.5 2022.03.08
      - Add method to choose when appearing and alarm : breakout(after breakout in point 2) or pattern(in point 3)
      Версия 1.4 2022.02.28
      - Scan just open chart when disable "scan all charts" button
      - Add buffer for someone who wants to use this indicator as an iCustom()
      Версия 1.3 2022.02.22
      - Scan only your Market watch,
      Please download new version.
      Версия 1.2 2022.02.08
      Improved Print
      Версия 1.1 2022.02.08
      - Add "Market watch" or "just currency pairs" button for scan