Rectangle position changer
- Утилиты
- Igor Zizek
- Версия: 2.1
- Обновлено: 30 сентября 2024
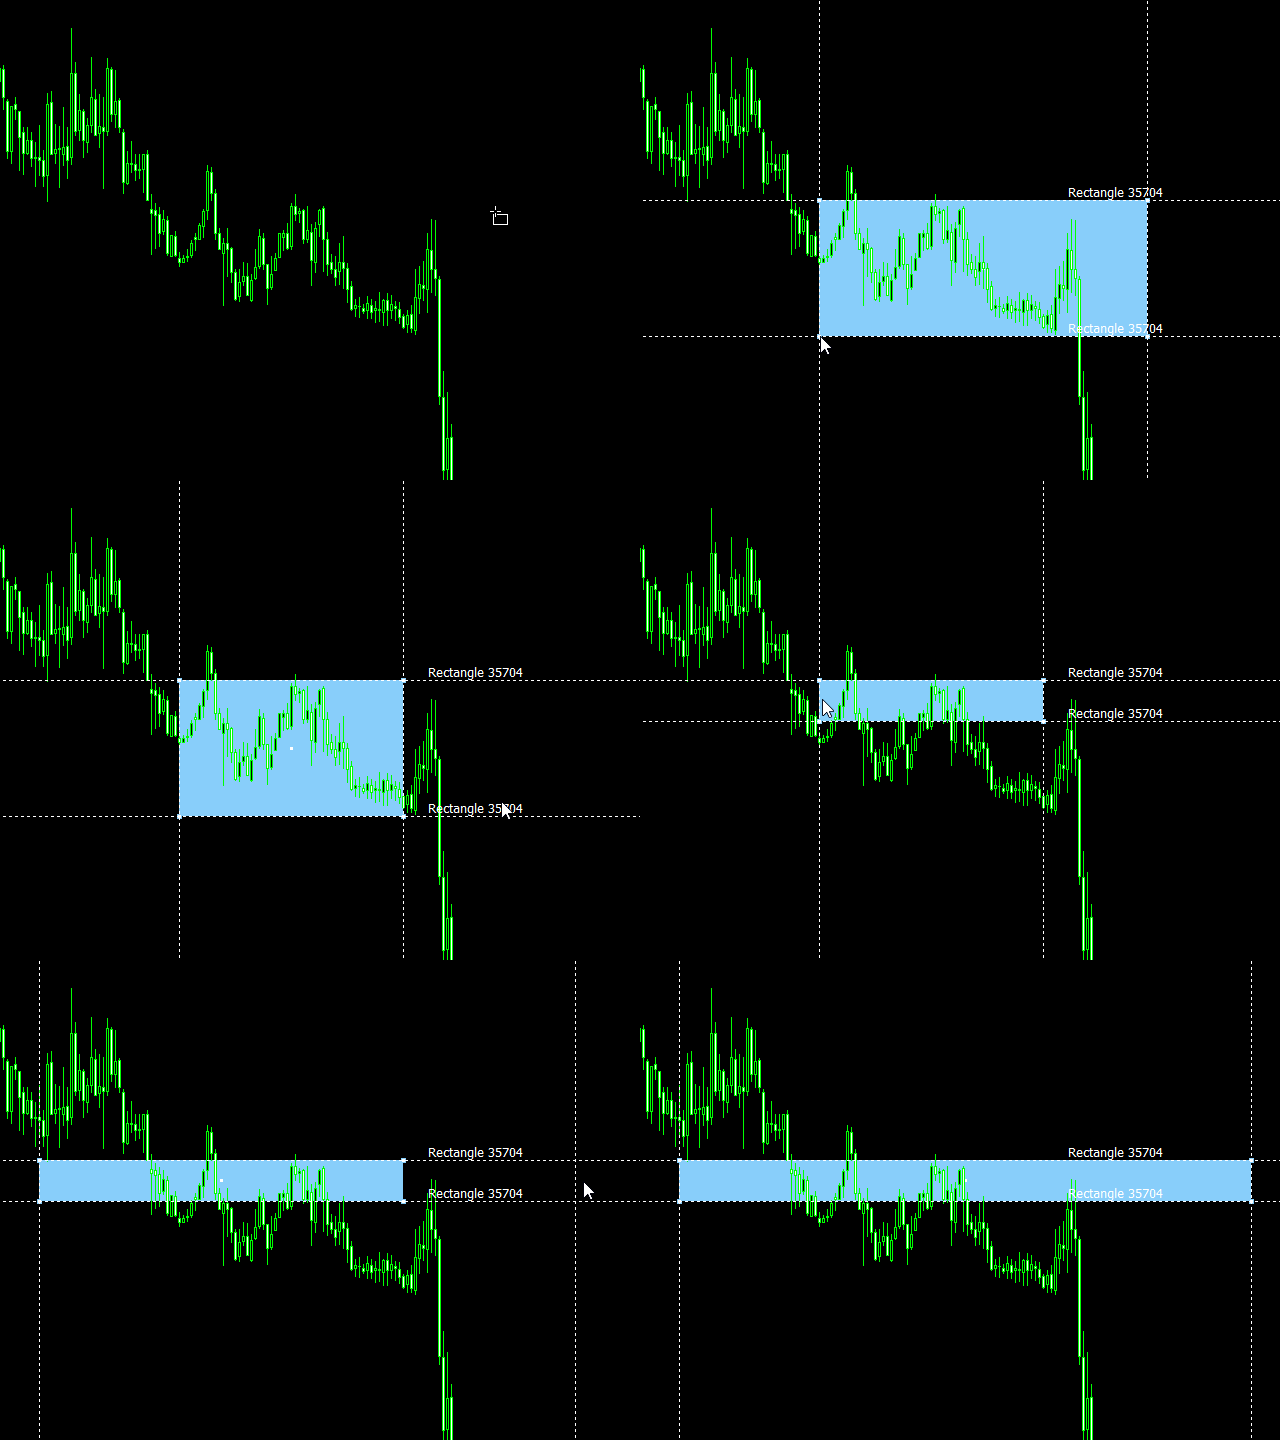
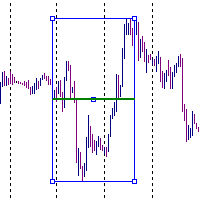
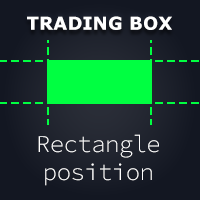
Rectangle position changer tool (rectangle indicator) is used for precise/accurate rectangle positioning by time or price only. You can move each side of rectangle separately with lines created around selected rectangle. This tool will replace classical grid because it is like dynamical chart grid for rectangle grid.
This tool allows you to adjust your rectangles, from all 4 sides, with ease and makes your technical analysis that much faster.
This tool is handy when corner points for changing rectangle position are not visible (outside of visible chart). The name of rectangle will be displayed on each line.
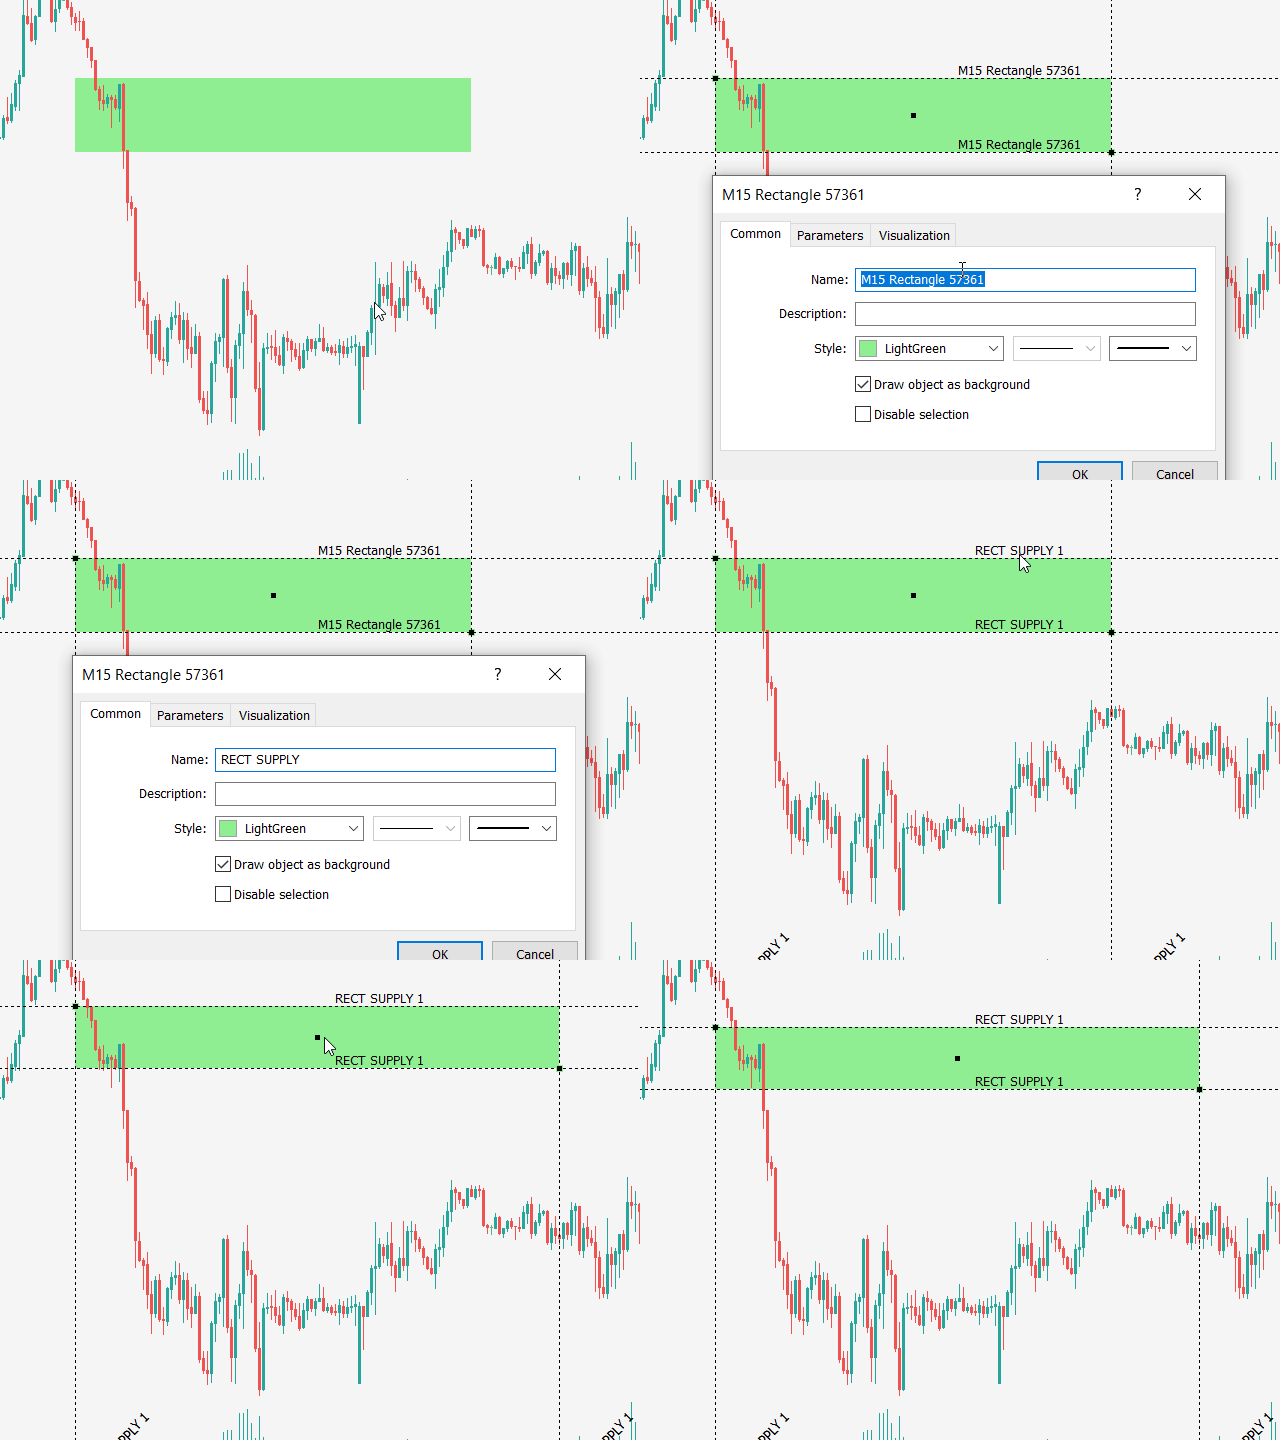
When you select rectangle then four selected lines will be displayed around rectangle. Just drag and drop horizontal line and rectangle size will be changed.
When you deselect rectangle or any of lines, then rectangle will be deselected and rectangle moving lines will be deleted.
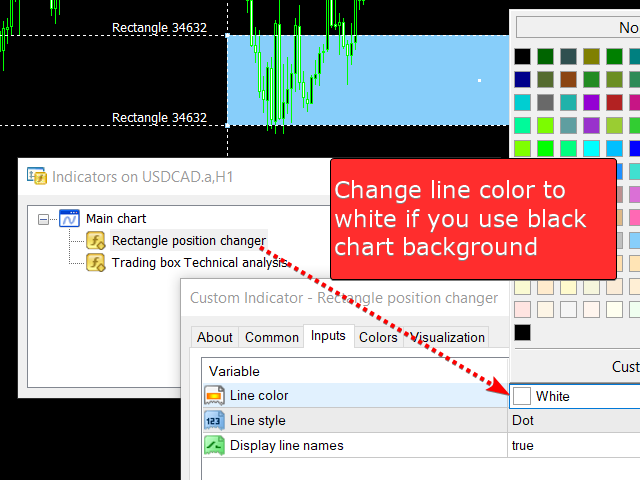
If you have BLACK chart background, then you can change line color to white! (look at indicator input parameters).
If you want to rename a rectangle, then right click into the center point of the rectangle to get the Object properties window.
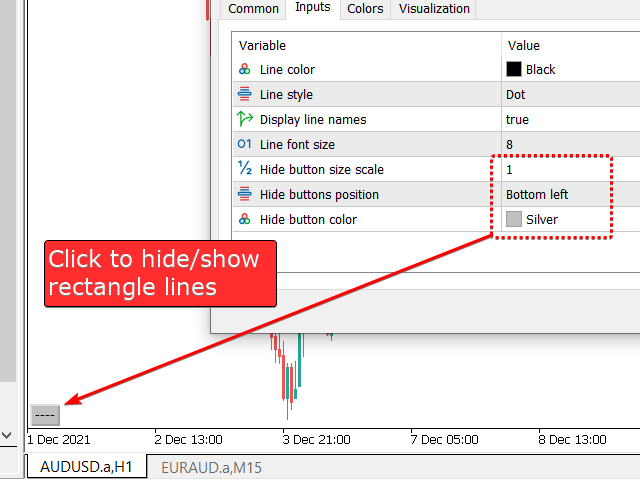
In input parameters you can define lines color, style and show/hide rectangle name on lines. This is like channels indicator.
With bottom show/hide button you can enable or disable rectangle lines. (rectangle indicator, rectangle zone)
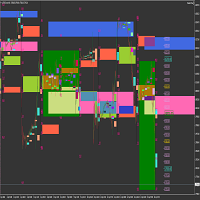
Supply demand zone price action trading supported by this supply and demand tool indicator. Price line levels and round level round price grid horizontal lines rounded lines rounded price

















The indicator is useful and helps the speed of the trader's action Thanks!