• Обзор
  • Отзывы
  • Обсуждение
  • Что нового

Real Trend Zigzag PRO MT4

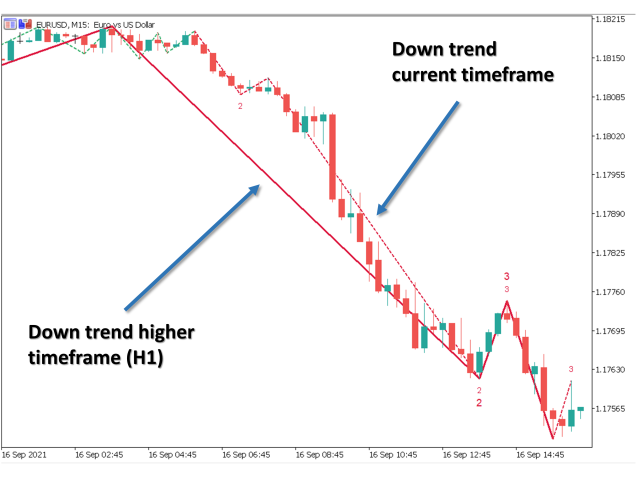
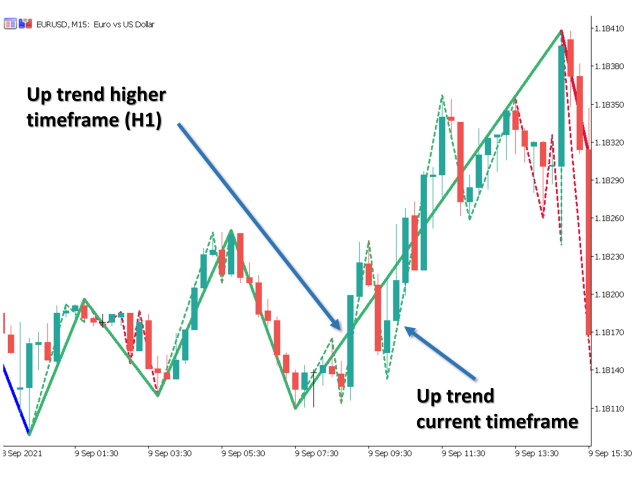
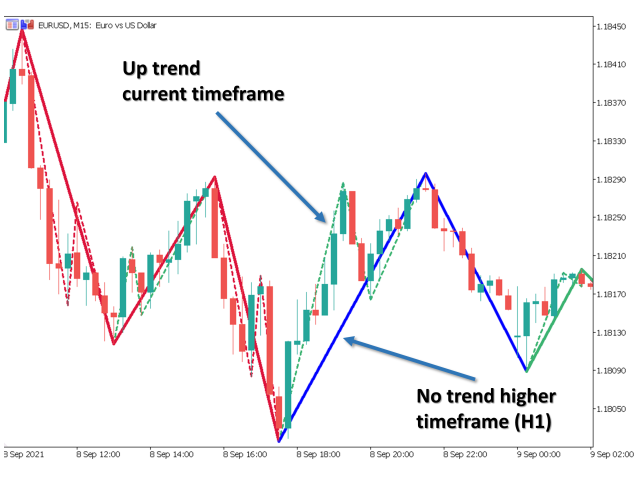
Real Trend Zigzag PRO shows the real trend of a market, unlike the default Zigzag indicator. It calculates the trend in real time and shows green lines for upwards trends, red lines for downward trends and blue lines for no trends. 

Regarding the old slogan "the trend is your friend" it helps you to decide if should open a buy or sell position.

The PRO version is a multi timeframe zigzag (MTF). Means, it shows the trend of the current timeframe as well as the trend of a higher or lower time. You can set the second timeframe in the input options

MT5 version also available in the market.

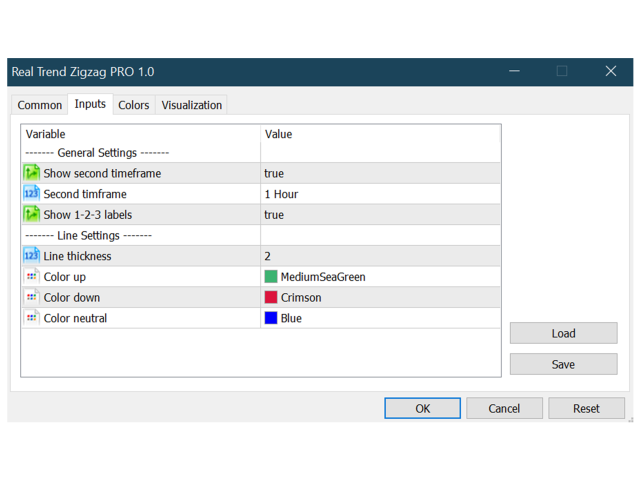
Input Options:

  • Show second timeframe
  • Set second timeframe
  • Show 1-2-3 Labels
  • Line thickness
  • Line colors


Рекомендуем также
Индикатор Crypto_Forex "Auto FIBO Pro" - отличный вспомогательный инструмент в торговле! - Индикатор автоматически рассчитывает и размещает на графике уровни Фибоначчи и локальные линии тренда (красного цвета). - Уровни Фибоначчи указывают ключевые области, где цена может развернуться. - Наиболее важными уровнями являются 23,6%, 38,2%, 50% и 61,8%. - Вы можете использовать его для скальпинга на разворот или для торговли по зональной сетке. - Существует множество возможностей улучшить вашу теку
Owl smart levels
Sergey Ermolov
4.24 (37)
Версия MT5  | Как установить?  | FAQ Индикатор Owl Smart Levels   – это полноценная торговая система внутри одного индикатора, которая включает в себя такие популярные инструменты анализа рынка как усовершенствованные   фракталы Билла Вильямса , Valable ZigZag, который строит   правильную волновую структуру   рынка, а также  уровни Фибоначчи,   которые   отмечают точные уровни входа в рынок и места взятия прибыли. Подробное описание стратегии Инструкция по работе с индикатором Советник-помошник
Alpha Trend sign - это мой давний и очень популярный торговый инструмент, который проверяет нашу торговую систему и четко сигнализирует о транзакциях, которые не дрейфуют.   Основные функции:   • В зависимости от того, показывает ли рынок активную область, показатели могут быть очень интуитивными, чтобы определить, является ли текущая конъюнктура трендовой или шоковой.   И в соответствии с индикатором стрелка врезается на рынок, зеленая стрела подсказывает купить, красная стрела подсказывает
Индикатор LineMagnit для MT4 - высокоточный индикатор, который строит уровни поддержки и сопротивления, притягивающие к себе цену по принципу магнита. Это позволяет трейдеру легко определить наиболее вероятные точки входа и выхода из рынка, а также определить направление сил в рынке так как уровни строятся на основе вливаний капитала в инструмент. Индикатор LineMagnit   оснащен интуитивно понятным графическим интерфейсом, который позволяет быстро находить и анализировать уровни поддержки и сопро
Это трендовый индикатор без перерисовки Разработан вместо стратегии бля бинарках опционов (по цвету свечи мартингейл) Так же хорошо работает в торговле на рынке форекс Когда открывать сделки ( бинарные опционы ) Сигнал появится в месте с свечой сигналит на текущую свечу  Открывать сделку стоит на одну свечу текущего таймфрейма рекомендуется м1 и М5 При появлении синей точки открываем сделку вверх При появлении красной точки открываем сделку в низ. Как открывать сделки на Форекс. При получени
Taurus All4 Taurus All4 is a high-performance indicator, it will tell you the strength of the trend, and you will be able to observe the strength of the candle. Our indicator has more than 4 trend confirmations. It is very simple and easy to use. Confirmation Modes Candle Trend Confirmations: When the candle switches to light green the trend is high. When the candle switches to light red the trend is reverting down. When the candle changes to dark red the trend is low. Trendline Trend Confirm
Trend Oscillator — это продвинутый пользовательский индикатор Crypto_Forex, эффективный торговый инструмент! - Используется новый продвинутый метод расчета — 20 вариантов параметра «Цена для расчета». - Самый плавный осциллятор из когда-либо созданных. - Зеленый цвет для восходящих трендов, красный цвет для нисходящих трендов. - Значения перепроданности: ниже 5, значения перекупленности: выше 95. - С этим индикатором есть множество возможностей для модернизации даже стандартных стратегий. - С
The Stepping Trend Indicator     The Steppi ng Trend indicator uses the  average true range  (ATR indicator) in its calculation. This gives you control to set your own average true range period, I set the Default as 10.   Indicator Details. Green Arrow Up: This means you are at the starting point of a new bullish trend, it’s time to buy.   Red  Arrow  Down : This means you are at the starting point of a new  bearish  trend, it’ s time to sell .   What if you miss the Arrow Signal?   No prob
The Th3Eng PipFinite indicator is based on a very excellent analysis of the right trend direction with perfect custom algorithms. It show the true direction and the best point to start trading. With StopLoss point and Three Take Profit points. Also it show the right pivot of the price and small points to order to replace the dynamic support and resistance channel, Which surrounds the price. And Finally it draws a very helpful Box on the left side on the chart includes (take profits and Stop loss
Heiken Ashi candle chart is an improved version of The Japanese candle chart, which can effectively filter the market "noise" of the Japanese candle chart. It is favored by many traders for its simplicity and intuition. For trend traders, the HA candle chart is a magic tool. Unlike the traditional Japanese candle chart, Heikenashi does not reflect the opening price, high price, low price and closing price of the market. Instead, Heikenashi calculates the value of a single K line in the dominant
Crypto_Forex Индикатор "WPR и 2 скользящие средние" для MT4, без перерисовки. - Сам WPR является одним из лучших осцилляторов для скальпинга. - Индикатор "WPR и 2 скользящие средние" позволяет видеть быстрые и медленные скользящие средние осциллятора WPR. - Индикатор дает возможность увидеть ценовые коррекции очень рано. - Этот индикатор очень легко настроить с помощью параметров, его можно использовать на любом таймфрейме. - Условия входа на покупку и продажу вы можете увидеть на картинках. -
Easy Trade indicator
Felipe Carvalho De Queiroz
Easy Trade Indicator – Your Path to Profitable Trades! Work any Time Frame! Maximize your profits with precise and assertive trades! ️ Trade with comfort – the indicator does the analysis and you only open the order in the direction in which the indicator shows you!  Exclusive panel with past trade counter and accuracy tracking! Simplify your analysis, boost your performance, and trade with confidence! Get it now and take your trading to the next level
Super Reversal Pattern Indicator Unlock the power of advanced pattern recognition with our Super Reversal Pattern Indicator. Designed for traders seeking precision and reliability, this indicator identifies one of the most effective reversal patterns in technical analysis, offering a significant edge in your trading strategy. Key Features: Non-Repainting Accuracy: Enjoy the confidence of non-repainting technology. Once a Super Reversal Pattern is detected, it remains static, providing consiste
Alpha Trend
Evgeny Belyaev
3.33 (3)
Alpha Trend - это трендовый индикатор для платформы MT4, разработанный группой профессиональных трейдеров. Индикатор Alpha Trend находит наиболее вероятные точки разворота тенденции, что позволяет совершать сделки в самом начале тренда. Данный индикатор оснащён уведомлениями при появлении нового сигнала (алерт, почта, телефон), что поможет вам своевременно открыть позицию. Alpha Trend не перерисовывается, что дает возможность оценить его эффектность на истории. Версия  Alpha Trend для терминала
Индикаторы [ZhiBiCCI] подходят для всех циклов использования, а также подходят для всех разновидностей рынка. [ZhiBiCCI] Зеленая сплошная линия - разворот бычьей дивергенции. Зеленая пунктирная линия - классическая бычья дивергенция. [ZhiBiCCI] Сплошная линия к красному - обратная медвежья дивергенция. Красная пунктирная линия - классическая медвежья дивергенция. [ZhiBiCCI] можно установить в параметрах (Предупреждение, Отправить почту, Отправить уведомление), установить на (true) для отправк
Trend Monitor
Pavel Zamoshnikov
4 (4)
Индикатор дает ранние сигналы при смене тренда, основываясь на показаниях ADX в комбинации с элементами ценовых паттернов. Работает на любых инструментах и таймфреймах. Индикатор не перерисовывает свои сигналы. Вы видите на истории ту же картину, которая была в реал-тайм. Сигналы отображаются стрелками для удобства восприятия (чтобы не загромождать график). Особенности Простота использования. Все настройки фильтров сводятся к выбору чувствительности параметром " Sensitivity of the indicator ".
Индикатор тренда Riko Trend - революционное решение для торговли по трендам и фильтрации со всеми важными функциями инструмента тренда, встроенными в один инструмент! Индикатор Riko Trend хорош для любого трейдера, подойдет любому трейдеру как для форекс так и для бинарных опционов. Ничего настраивать не нужно все отточено времинем и опытом, отлично работает на во время флета та и в тренде. Индикатор тренда Riko Trend это инструмент технического анализа финансовых рынков, отражающий текущие от
Trend Line Chart Pattern Signals  Is a traders Tool for Signals based on Strong  Patterns Formed By a pair of robust trend lines. They FOR WITH DIFFERENT POPULAR PATTERNS ON CHARTS LIKE – TRIANGLES, FLAGS,RANGE , ASCENDING TRIANGLES, DESCENDING PATTERNS, PENNANTS ETC. The TREND LINES  form  dynamically  on running bars. The  sensitivity  of the trend lines can be changed by custom settings. The  Buy and Sell Signals Generate upon Break Of the Trend Line + "Close" of the same bar above the previo
Индикатор показывает потенциальный направление тренда по циклично-волновой зависимости. Таким образом, все лучи пересечения будут оптимальными лучами, в направлении которых ожидается движение цены с учетом периода индикатора. Лучи можно использовать как направление потенциального движения рынка. Но не надо забывать, что подход должен быть комплексным, сигналы индикатора требуют дополнительной информации для входа в рынок.
MACD Display is a MACD disaplay and cross monitoring indicator,which can works on 6 timeframe at same time. Indicator advantage: 1. Deviation from the point can be drawn on the main picture and indicator drawing. It is convenient to observe and can be hidden or displayed by parameter setting. 2. Deviation from the entry point is clearly indicated by the arrow in the drawing. 3. Cross-cycle monitoring can simultaneously monitor the MACD deviation and the golden dead fork of the six-cycle framewor
PABT Pattern Indicator - это классическая реализация одного из сигнальных паттернов.  Логика индикатора заключается в том, что он определяет ситуации в которых максимум и минимум сигнального бара находится в пределах максимума и минимума предыдущего бара, тем самым показывает разворот тренда. Для сигнала на покупку сигнальный бар закрывается выше цены открытия, для сигнала на продажу сигнальный бар закрывается ниже цены открытия, предыдущий бар соответственно противоположного сигнальному типа. В
Price reach indicator. It also serves as the perfect term for supports and resistance. I use it in two experts. The basic tool for professional trading. The indicator analyzes the last 500 bar and uses this to determine the levels ( but it doesn't predict the future ) . Personally, I use it on TF H1.  It is very simple. Four lines on chart and that's all. Only two input parameters.  Thousands of indicators. Why this? Is good ? No! Is very good. Please test the indicator prior to purchasing.
VR Cub
Vladimir Pastushak
VR Cub это индикатор что бы получать качественные точки входа. Индикатор разрабатывался с целью облегчить математические расчеты и упростить поиск точек входа в позицию. Торговая стратегия, для которой писался индикатор, уже много лет доказывает свою эффективность. Простота торговой стратегии является ее большим преимуществом, что позволяет успешно торговать по ней даже начинающим трейдерам. VR Cub рассчитывает точки открытия позиций и целевые уровни Take Profit и Stop Loss, что значительно повы
PinBar Hunter — ваш надёжный помощник для торговли по паттерну «Пин-бар»! Высокая точность сигналов Индикатор автоматически распознаёт бычьи и медвежьи пин-бары и моментально отображает стрелки на графике для удобного входа в сделки. Гибкие фильтры сигналов Используйте встроенные фильтры по времени и скользящей средней (MA), чтобы получать только самые качественные и надёжные торговые сигналы. Удобная информационная панель Все настройки и текущий статус индикатора всегда на виду, бл
Сигнальный трендовый индикатор. Определяет направление тренда и  окрашивается в соответствующий цвет. Имеет встроенные звуковые и визуальные оповещение о смене тренда. Может отправлять уведомления на ваш телефон или на емеил. Позволяет вести трендовую и контр трендовую торговлю. Работает на всех таймфреймах, на всех валютных парах, металлах, индексах и криптовалюте. Можно использовать при работе с бинарными опционами. Отличительные особенности Не перерисовывается; Простые и понятные настройки;
FREE FOR A LIMITED TIME ONLY!!! The Ultimate Indicator For Trading Trend This indicator clearly shows you the strength of the market in one direction or the other, which means that you can trade knowing you are either with or against the market. When used in conjunction with the +3R principles you are sure to have some serious results. The +3R Principles Routine - This is when you trade and how often  Rules - This is the rule you follow  Risk:Reward - This is the percentage amount of your accoun
Power Renko is an indicator which plots Renko bricks underneath the chart using a histogram. You can select the brick size and the timeframe of the Renko bricks as well as whether or not to use the close price or the high/low price of the candles. Renko bricks are based on price alone, not time, therefor the Renko bricks will not be aligned with the chart's time. They are extremely useful for trend trading and many different strategies can be formed from them. Buffers are provided allowing you t
Основан на Волнах индикатора MACD со стандартными параметрами Наносит Уровни Фибоначчи по двум последним Волнам MACD, по положительной и отрицательной соответственно, если в текущий момент по индикатору MACD закончилась отрицательная Волна - то цвет зеленый, если в текущий момент по индикатору MACD закончилась положительная Волна - то цвет красный. Критерий окончания Волны- два тика с другим знаком по MACD. Наносит Трендовые линии по четырем последним Волнам MACD. Хорошо работает с экспертом  Fi
Индикатор отображает на графике данные стохастик-осцилятора более старшего временного интервала. Основная и сигнальная линии отображаются в дополнительном окне. Ступенчатая характеристика не сглажена. Индикатор удобен для отработки "ручных" стратегий форекс-торговли, использующих данные от нескольких экранов с различными временными интервалами одного инструмента. В индикаторе используются настройки, аналогичные стандартному и выпадающий список для выбора тайм-фрейма. Параметры индикатора TimeFr
TrendPlus
Sivakumar Subbaiya
4.07 (14)
Trend Plus   Trendplus  Indicator   Time Frame: Suitable for any time frame.  Purpose: Trend Prediction. Blue and red candle indicate the buy and sell call respectively. Buy: When the blue candle is formed buy call is initiated. close the buy trades when the next red candle will formed.   Sell: When the Red candle is formed Sell call is initiated. close the Sell trades when the next blue candle will formed.   Happy trade!!
FREE
С этим продуктом покупают
Dynamic Forex28 Navigator — инструмент для торговли на рынке Форекс нового поколения. В НАСТОЯЩЕЕ ВРЕМЯ СКИДКА 49%. Dynamic Forex28 Navigator — это эволюция наших популярных индикаторов, объединяющая мощь трех в одном: Advanced Currency Strength28 Indicator (695 отзывов) + Advanced Currency IMPULSE with ALERT (520 отзывов) + CS28 Combo Signals (бонус). Подробности об индикаторе https://www.mql5.com/en/blogs/post/758844 Что предлагает индикатор Strength нового поколения?  Все, что вам нравило
В настоящее время скидка 20%! Лучшее решение для новичка или трейдера-эксперта! Эта приборная панель работает на 28 валютных парах. Он основан на 2 наших основных индикаторах (Advanced Currency Strength 28 и Advanced Currency Impulse). Он дает отличный обзор всего рынка Forex. Он показывает значения Advanced Currency Strength, скорость движения валюты и сигналы для 28 пар Forex на всех (9) таймфреймах. Представьте, как улучшится ваша торговля, когда вы сможете наблюдать за всем рынком с помощ
Enigmera
Ivan Stefanov
5 (7)
ENIGMERA: Основы рынка Важно: демо-версия на MQL5.com работает в Strategy Tester и может не полностью отображать функциональность Enigmera. Ознакомьтесь с описанием, скриншотами и видео для подробной информации. Не стесняйтесь обращаться с вопросами! Код индикатора был полностью переписан. Версия 3.0 добавляет новые функции и устраняет ошибки, накопившиеся с момента появления индикатора. Введение Этот индикатор и торговая система представляет собой уникальный подход к финансовым рынкам. ENIGMER
Индикатор, который переосмыслил трейдинг, стал эталоном анализа графиков и задал новые стандарты в трейдинге. Разворотные зоны /  Зоны пикового объема  /   Активные зоны крупного игрока    ИНСТРУКЦИЯ RUS          INSTRUCTIONS  ENG    /  Рекомендуем использовать с индикатором -  TPSpro TREND PRO Каждый покупатель этого индикатора получает дополнительно БЕСПЛАТНО:  6 месяцев доступа к торговым сигналам от сервиса RFI SIGNALS — готовые точки входа по алгоритму TPSproSYSTEM. Обучающие матери
Introduction to X3 Chart Pattern Scanner X3 Cherart Pattern Scanner is the non-repainting and non-lagging indicator detecting X3 chart patterns including Harmonic pattern, Elliott Wave pattern, X3 patterns, and Japanese Candlestick patterns. Historical patterns match with signal patterns. Hence, you can readily develop the solid trading strategy in your chart. More importantly, this superb pattern scanner can detect the optimal pattern of its kind. In addition, you can switch on and off individu
[ MT5 Version ]  [ Kill Zones ]  [ SMT Divergences ] How to trade using Order Blocks:  Click here User Interface Performance:  During testing in the strategy tester, the UI may experience lag. Rest assured, this issue is specific to the testing environment and does not affect the indicator's performance in live trading. Elevate your trading strategy with the  Order Blocks ICT Multi TF  indicator, a cutting-edge tool designed to enhance your trading decisions through advanced order block analys
Персональная реализация Order Blocks, простой, но эффективной стратегии позиционной торговли. Трейдер должен войти в рынок или искать сделки в направлении последнего блока ордеров, если ценовой диапазон не был нарушен в направлении, противоположном прорыву. Открытые блоки для наглядности не прорисовываются. [ Руководство по установке | Руководство по обновлению | Устранение неполадок | FAQ | Все продукты ] Бычий открытый блок - это первый бычий бар после нового рыночного минимума. Медвежий откр
Linear Trend Predictor - Трендовый индикатор сочетающий в себе точки для входа и линии поддержки направления. Работает по принципу пробития ценового канала High/Low. Алгоритм индикатора фильтрует рыночный шум, учитывает волатильность и рыночную динамику. Возможности индикатора Методами сглаживания показывает рыночную тенденцию и точки входа для открытия ордеров BUY или SELL. Подходит для определения краткосрочных и долгосрочных движений рынка, анализируя графики на любых таймфреймах. Адаптивн
Best Currency Strength Indicator
Tumelo Patrick Rakotsoane
4.5 (46)
Advanced Currency Strength Indicator The Advanced Divergence Currency Strength Indicator. Not only it breaks down all 28 forex currency pairs and calculates the strength of individual currencies across all timeframes , but, You'll be analyzing the WHOLE forex market in 1 window (In just 1 minute) . This indicator is very powerful because it reveals the true movements of the market.  It is highly recommended to  analyze charts knowing the performance of individual currencies or the countries eco
Trading Levels Indicator - система для торговли, разработанная для определения точек входа, удержания позиций и трендового направления. Включает несколько механизмов работающих в одном комплексе, волновой анализ трендового направления, уровневый анализ при построении сигналов, показывает возможные цели TP и SL. Возможности индикатора Сигнальные стрелки появляются на текущей свече, не перекрашиваются. Использует специальные алгоритмы поиска уровней от которых отскакивает цена. Работает по тренд
Индикатор Supply Demand использует предыдущее ценовое действие для выявления потенциального дисбаланса между покупателями и продавцами. Ключевым является определение зон с лучшими возможностями, а не просто вероятностей. Индикатор Blahtech Supply Demand обеспечивает функционал, не доступный ни в одной платформе. Этот индикатор 4 в 1 не только выделяет зоны с более высокой вероятностью на основе механизма оценки силы по множественным критериям, но также комбинирует его с мульти-таймфреймовым анал
GOLD Impulse with Alert
Bernhard Schweigert
4.6 (10)
Этот индикатор является супер комбинацией двух наших продуктов Advanced Currency IMPULSE with ALERT  +   Currency Strength Exotics . Он работает на всех временных рамках и графически показывает импульс силы или слабости для 8 основных валют плюс один символ! Этот индикатор специализирован для отображения ускорения силы валюты для любых символов, таких как золото, экзотические пары, товары, индексы или фьючерсы. Первый в своем роде, любой символ может быть добавлен в 9-ю строку, чтобы показат
Bonus: при покупке  индикатора вы получаете любой индикатор бесплатно(на выбор) .(Пишите в личное сообщение или в телеграмм в профиле для получения бонуса) Quantum Entry — это мощная система торговли по ценовому действию, построенная на одной из самых популярных и широко известных стратегий среди трейдеров: стратегия прорыва! Этот индикатор выдает кристально чистые сигналы покупки и продажи, основанные на прорывах ключевых зон поддержки и сопротивления. В отличие от типичных индикаторов прорыв
NAM Order Blocks
NAM TECH GROUP, CORP.
5 (1)
Индикатор обнаружения блоков ордеров мультитаймфреймов MT4. Функции - Полностью настраиваемая панель управления графиком, обеспечивает полное взаимодействие. - Скрыть и показать панель управления где угодно. - Обнаружение OB на нескольких таймфреймах. - Выберите количество OB для отображения. - Различные пользовательские интерфейсы OB. - Различные фильтры по OB. - Оповещение о близости OB. - Линии ADR High и Low. - Служба уведомлений (Экранные оповещения | Push-уведомления). Резюме
MTF Supply Demand Zones
Georgios Kalomoiropoulos
4.82 (22)
Следующее поколение автоматизированных зон спроса и предложения. Новый инновационный алгоритм, работающий на любом графике. Все зоны создаются динамически в соответствии с ценовым действием рынка. ДВА ТИПА СИГНАЛОВ --> 1) ПРИ ПОПАДАНИИ ЦЕНЫ В ЗОНУ 2) ПРИ ФОРМИРОВАНИИ НОВОЙ ЗОНЫ Вы не получите еще один бесполезный индикатор. Вы получаете полную торговую стратегию с проверенными результатами.     Новые особенности:     Оповещения, когда цена достигает зоны спроса/предложения     Оповещения
ECM Elite Channel is a volatility-based indicator, developed with a specific time algorithm, which consists of finding possible corrections in the market. This indicator shows two outer lines, an inner line (retracement line) and an arrow sign, where the channel theory is to help identify overbought and oversold conditions in the market. The market price will generally fall between the boundaries of the channel. If prices touch or move outside the channel, it's a trading opportunity. The ind
Представляем       Индикатор Quantum Trend Sniper   , инновационный индикатор MQL5, который меняет способ определения разворотов тренда и торговли ими! Разработан командой опытных трейдеров со стажем торговли более 13 лет,       Снайперский индикатор Quantum Trend       разработан, чтобы вывести ваше торговое путешествие на новые высоты благодаря инновационному способу определения разворотов тренда с чрезвычайно высокой точностью. ***Купите индикатор Quantum Trend Sniper и получите индикатор Qu
Volume Profile, Footprint and Market Profile TPO (Time Price Opportunity). Volume and TPO histogram bar and line charts. Volume Footprint charts. TPO letter and block marker collapsed and split structure charts. Static, dynamic and flexible range segmentation and compositing methods with relative and absolute visualizations. Session hours filtering and segment concatenation with Market Watch and custom user specifications. Graphical layering, positioning and styling options to suit the user's a
Trend Oscillator: Плавное и Надежное Определение Рынка Trend Oscillator — это продвинутый индикатор для MT4, созданный, чтобы помочь трейдерам точно определять направление тренда и возможные точки разворота. С интуитивной визуальной презентацией этот индикатор четко показывает, когда рынок находится в восходящем или нисходящем тренде, упрощая анализ и улучшая читаемость графика. Он подходит для широкого спектра рынков и таймфреймов, предоставляя отличную гибкость для различных торговых потребнос
StalkeR Arrow
Abdulkarim Karazon
5 (3)
StalkeR Arrow — это стрелочный индикатор, который подает сигналы на покупку и продажу при открытии бара/внутри бара. Этот индикатор основан на паттернах ценового действия и фракталах. Этот индикатор дает tp и sl для каждого сигнала на покупку и продажу, tp и sl представлены в виде линий выше и ниже каждого сигнала, они продолжаются до тех пор, пока не будет сформирован новый сигнал. Этот индикатор имеет панель/панель бэктестинга, которая дает статистику выигрышей/проигрышей исторических сигна
TrendMaestro
Stefano Frisetti
5 (3)
note: this indicator is for METATRADER4, if you want the version for METATRADER5 this is the link:  https://www.mql5.com/it/market/product/108106 TRENDMAESTRO ver 2.4 TRENDMAESTRO recognizes a new TREND in the bud, he never makes mistakes. The certainty of identifying a new TREND is priceless. DESCRIPTION TRENDMAESTRO identifies a new TREND in the bud, this indicator examines the volatility, volumes and momentum to identify the moment in which there is an explosion of one or more of these data a
Gold Channel is a volatility-based indicator, developed with a specific timing algorithm for the XAUUSD pair, which consists of finding possible corrections in the market. This indicator shows two outer lines, an inner line (retracement line) and an arrow sign, where the theory of the channel is to help identify overbought and oversold conditions in the market. The market price will generally fall between the boundaries of the channel. If prices touch or move outside the channel it is a tradi
KT Renko Patterns MT4
KEENBASE SOFTWARE SOLUTIONS
2.33 (3)
KT Renko Patterns анализирует график Ренко кирпич за кирпичиком, чтобы найти известные графические паттерны, которые часто используют трейдеры на различных финансовых рынках. По сравнению с графиками на основе времени, торговля по паттернам на графиках Ренко легче и нагляднее благодаря их чистому виду. KT Renko Patterns включает несколько паттернов Ренко, многие из которых подробно описаны в книге «Профитная торговля с графиками Ренко» авторства Прашанта Шаха. Полностью автоматизированный сове
Scalping Indicator Pro is a powerful indicator that works in trend as well as non trending market conditions. This indicator is perfect for scalp trades as well as swing trades. Scalping Indicator Pro is not just an indicator, but a trading strategy itself. It doesn't requires any additional indicators for the trading setup. Check out the indicator in action. [Video demonstration below] Why use Scalping Indicator Pro? Great for novice traders as well as experienced traders. Low risk entries.
Algo Trading Indicaor  With this indicator , you’ll have zones and trends that hight probability the price will reverse from it. so will gives you all the help that you need  Why should you join us !?  1-This indicator is logical since it’s working in previous days movement , to predict the future movements. 2-Algo trading indicator will help you to draw trends which is special and are too strong than the basics trend , trends will change with the frame time that you work on . 3-We can use
Supreme Commander
Ramon Sobrevals Arce
4.13 (8)
The indicator of the indicators. The Most Powerful Technique to Determine Forex Trend Strength in 2023. We have perfected Supreme Commander that it calculates an average of the selected indicators (up to 16) and the selected timeframe (all) with the result of a single trend that indicates the potential of buying and selling.  It includes the following indicators: Accelerator/Decelerator oscillator Average Directional Movement Index Awesome oscillator; Bulls and Bears  Commodity Channel Index; De
PipTick VSA основывается на оригинальном методе анализа по спредам объема (VSA). Он был спроектирован для быстрого и простого распознавания паттернов VSA. Несмотря на кажущуюся простоту, это наиболее сложный из всех наших инструментов. Индикатор PipTick VSA - это мощнейший аналитический инструмент, генерирующий надежные торговые сигналы. Благодаря своему удобству и простоте, он подходит всем трейдерам независимо от их опыта. Что такое VSA? VSA - это анализ по спредам объема, представляющий собо
Профиль Рынка (Market Profile) определяет ряд типов дней, которые помогают трейдеру распознать поведение рынка. Ключевая особенность - это область значений (Value Area), представляющая диапазон ценового действия, в котором произошло 70% торговли. Понимание области значений может помочь трейдерам вникнуть в направление рынка и установить торговлю с более высокими шансами на успех. Это отличное дополнение к любой системе, которую вы возможно используете. Blahtech Limited представляет сообществу Me
СЕЙЧАС СКИДКА 26% !!! Этот индикатор является супер комбинацией обоих наших основных индикаторов ( Advanced Currency Strength 28   &  Advanced Currency IMPULSE with ALERT ) . Он показывает значения силы валюты для TICK-единиц и предупреждающие сигналы для 28 пар Форекс. Можно использовать 11 различных тик-единиц. Это 1, 2, 3, 4, 5, 6, 10, 12, 15, 20 и 30 секунд. Полоса Tick-Unit во вложенном окне будет показана и сдвинута влево, когда в таймере секунды будет хотя бы 1 тик.  С помощью всего ли
Excessive Momentum Indicator – один из немногих индикаторов, измеряющий чрезмерный импульс на финансовом рынке с использованием ценового поведения. Индикатор полностью разработан Янгом Хо Сео (Young Ho Seo). Этот показатель демонстрирует концепцию и практическое применение Равновесной фрактальной волны (Equilibrium Fractal Wave). Чрезмерный импульс на рынке может рассказать о психологии толпы и помочь спрогнозировать направление цены. Таким образом, вы можете основывать свои торговые решения на
Другие продукты этого автора
The VIX Fix is a volatility indicator developed by renowned trader Larry Williams. It's designed to measure volatility in assets that don't have options or futures, such as individual stocks and forex markets. Essentially,   it acts as a synthetic VIX (Volatility Index) for any asset , providing a gauge of market uncertainty. This modified version of William's indicator helps you to find market bottoms and market tops. It comes with 2 styles: Stochastic and histogram style. Please see screenshot
Real Trend Zigzag PRO   shows the real trend of a market, u nlike the default Zigzag indicator. It calculates the trend in real time and shows green lines for upwards trends, red lines for downward trends and blue lines for no trends.  Regarding the old slogan "the trend is your friend" it helps you to decide if should open a buy or sell position. The PRO version is a multi timeframe zigzag (MTF). Means, it shows the trend of the current timeframe as well as the trend of a higher or lower time.
The VIX Fix is a volatility indicator developed by renowned trader Larry Williams. It's designed to measure volatility in assets that don't have options or futures, such as individual stocks and forex markets. Essentially, it acts as a synthetic VIX (Volatility Index) for any asset , providing a gauge of market uncertainty. This modified version of William's indicator helps you to find market bottoms and market tops. It comes with 2 styles: Stochastic and histogram style. Please see screenshots
MT Moving Average MT Moving Average is an easy to use multi time frame moving average indicator. It shows moving averages (SMA or EMA) of current symbol from all time frames (higher and lower). No need to switch between time frames anymore. With help of the indicator panel you can select which timeframe should be shown on the chart. I.e. your current timeframe is M5 and you can turn on M15 to see the the moving average of period M15. Indicator settings Dark interface --> Set to true to use dark
ToolBox 360 is the swiss knife of all indicators. It is full packed with useful tools to help you with your trading. It can be used to find best entry and exit points and help you to decide if you should open a trade or not. It shows market trends, candlestick formations outside / inside bars and you can sett time based allerts. Main features: Time based Fibonacci lines Choose a start and end time and the indicator shows you Fibonacci lines within the selected time range including range high a
Trailing Stops Pro is a highly advanced trailing stop program. It comes with 12 different trailing stops and helps you to manage your trade and stops easily. You can specify a trail start, that means the trailing stop will be started after your positions has reached the selected profit points. Additionally you can set a trail distance as well as activate and deactivate the trailing stop for each position separately. For your convenience the program has a very easy to use app panel. For a detaile
Real Trend Zigzag   shows the real trend of a market, u nlike the default Zigzag indicator. It calculates the trend in real time and shows green lines for upwards trends, red lines for downward trends and blue lines for no trends.  Regarding the old slogan "the trend is your friend" it helps you to decide if should open a buy or sell position. MT5 Version can be found here:  https://www.mql5.com/en/market/product/72065 If you are looking for a multi timeframe zigzag, take a look at the PRO vers
This is the MetaTrader version of the very popular   Squeeze Momentum   indicator. It is based of of John Carter's   TTM Squeeze   volatility indicator, as discussed in his book   Mastering the Trade. With this version you can enable notifications when a squeeze is released (push notification, email, or pop-up message). Strategie Grey dots indicates a squeeze in the current timeframe.   Blue dots indicates that the squeeze is released. Mr. Carter suggests waiting till the first blue dot after a
Open Risk Profit  shows your current risk or possible profit of all open positions. Total open risk   is your loss if all positions run into the stop loss. Total open profit   is your profit if all positions reach your take profit. Total float   is your current profit or loss of all positions. The program also breaks down the information into the individual symbols. For example, you can monitor how much is your current profit and your potential risk in EURUSD, no matter how many individual posi
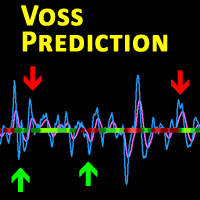
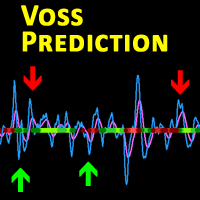
Description This is a modified version of the popular  Voss Predictive Filter - A peek into the future   by Dr. John Ehlers. It contains 2 lines - V-Line (blue) and F-Line (red), a trend indication and BUY/SELL signals. Usage Buy Green dots indicate an up trend.  Open a BUY position if the V-Line crosses the F-Line from below and an up trend is signaled (green dots) Close BUY position if V-Lines falls beneath F-Line again  Sell Red dots indicate a down trend Open a sell position if V-Line falls
MT Moving Average MT Moving Average is an easy to use multi time frame moving average indicator. It shows moving averages (SMA or EMA) of current symbol from all time frames (higher and lower). No need to switch between time frames anymore. With help of the indicator panel you can select which timeframe should be shown on the chart. I.e. your current timeframe is M5 and you can turn on M15 to see the the moving average of period M15. Indicator settings Dark interface --> Set to true to use dar
ToolBox 360 is the swiss knife of all indicators. It is full packed with useful tools to help you with your trading. It can be used to find best entry and exit points and help you to decide if you should open a trade or not. It shows market trends, candlestick formations outside / inside bars and you can sett time based allerts. Main features: Time based Fibonacci lines Choose a start and end time and the indicator shows you Fibonacci lines within the selected time range including range high a
Trailing Stops Pro is a highly advanced trailing stop program. It comes with 12 different trailing stops and helps you to manage your trade and stops easily. You can specify a trail start, that means the trailing stop will be started after your positions has reached the selected profit points. Additionally you can set a trail distance as well as activate and deactivate the trailing stop for each position separately. For your convenience the program has a very easy to use app panel. For a detaile
Real Trend Zigzag shows the real trend of a market, u nlike the default Zigzag indicator. It calculates the trend in real time and shows green lines for upwards trends, red lines for downward trends and blue lines for no trends.  Regarding the old slogan "the trend is your friend" it helps you to decide if should open a buy or sell position. If you are looking for a multi timeframe zigzag, take a look at the PRO version:  https://www.mql5.com/en/market/product/72071 MT4 version can be found her
This is the MetaTrader version of the very popular Squeeze Momentum indicator. It is based of of John Carter's TTM Squeeze volatility indicator, as discussed in his book Mastering the Trade. With this version you can enable notifications when a squeeze is released (push notification, email, or pop-up message). Strategie Grey dots indicates a squeeze in the current timeframe. Blue dots indicates that the squeeze is released. Mr. Carter suggests waiting till the first blue dot after a grey dot an
Open Risk Profit  shows your current risk or possible profit of all open positions. Total open risk is your loss if all positions run into the stop loss. Total open profit is your profit if all positions reach your take profit. Total float is your current profit or loss of all positions. The program also breaks down the information into the individual symbols. For example, you can monitor how much is your current profit and your potential risk in EURUSD, no matter how many individual positions
Description This is a modified version of the popular  Voss Predictive Filter - A peek into the future by Dr. John Ehlers. It contains 2 lines - V-Line (blue) and F-Line (red), a trend indication and BUY/SELL signals. Usage Buy Green dots indicate an up trend.  Open a BUY position if the V-Line crosses the F-Line from below and an up trend is signaled (green dots) Close BUY position if V-Lines falls beneath F-Line again  Sell Red dots indicate a down trend Open a sell position if V-Line falls b
Фильтр:
Нет отзывов
Ответ на отзыв
Версия 1.12 2025.01.21
Option for show/hide first timeframe added
Версия 1.1 2021.09.17
Better results when using Tester (keep in mind you have to use visual mode)