• Обзор
  • Отзывы
  • Обсуждение
  • Что нового

ToolBox 360 MT4

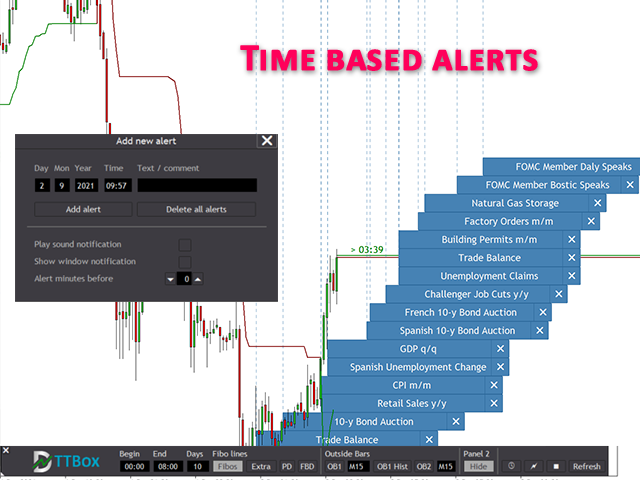
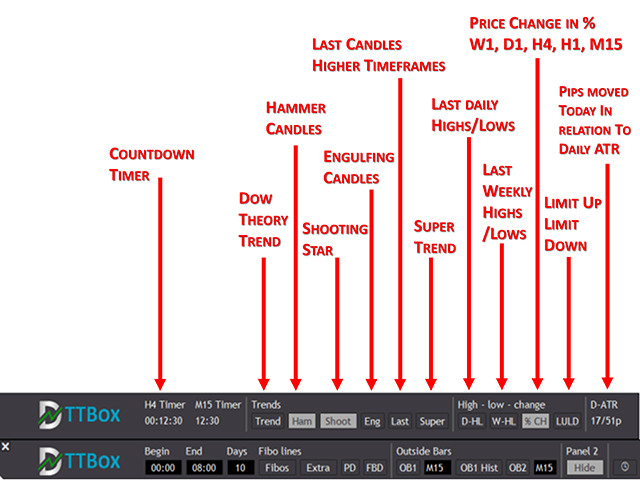
ToolBox 360 is the swiss knife of all indicators. It is full packed with useful tools to help you with your trading. It can be used to find best entry and exit points and help you to decide if you should open a trade or not. It shows market trends, candlestick formations outside / inside bars and you can sett time based allerts.


Main features:

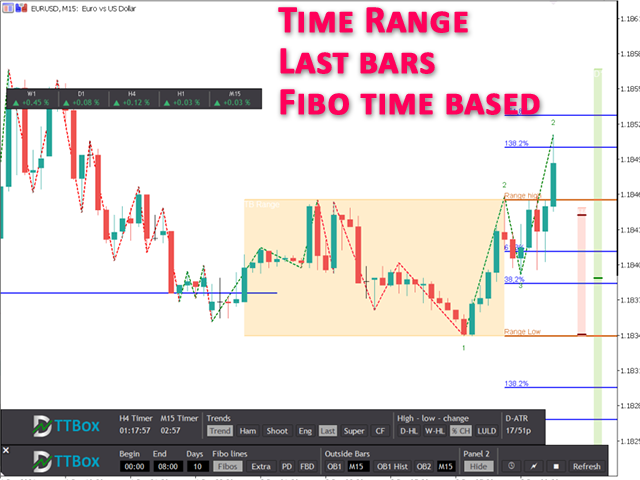
Time based Fibonacci lines

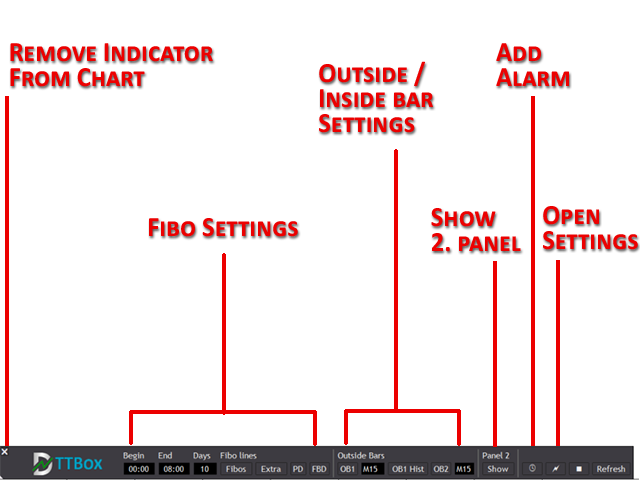
Choose a start and end time and the indicator shows you Fibonacci lines within the selected time range including range high and range low – best for range trading.

Previous day Fibonacci lines
See important Fibonacci levels based on the previous day with just one click. Within Intraday trading those Fibonacci levels are often used to identify possible price reversal points.

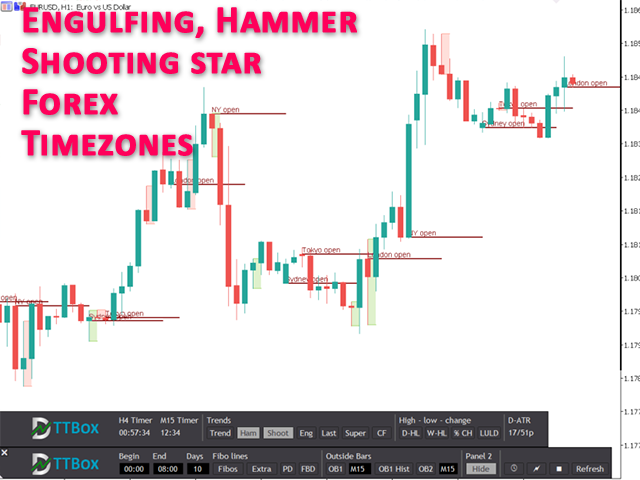
Forex times

See when markets are opened or closed. This is very useful in Forex markets because you can see very easily how which session was traded.

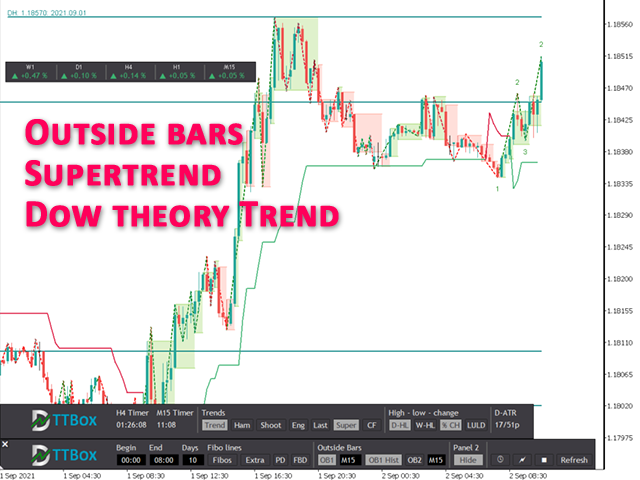
Outside bars

Outside bars are very important in professional price action trading. Highs and lows of outside bars can be used as entry and exit points as well as support and resistance points. With ToolBox 360 it is very easy to spot and react to those outside bars. It draws lines and rectangles of outside bars from current and higher time frames right onto the chart. No switching between time frames needed, so you will never miss an opportunity to open a good trade.

Engulfing, hammer, shooting star candlesticks

Engulfing, hammer or shooting star candles are very important because often they are forerunner of trend change or reversal. With ToolBox 360 it is very easy to spot and react to those engulfing bars because it instantly draws a rectangle around the engulfing candle.

Last bars higher time frames
No need to switch between time frames anymore. ToolBox 360 shows the last candles from higher time frames on the right hand side of the chart. See very easily the values of open, close, high and low for the last 4-hour, day or week candle. Timeframes are adjustable.

Price action trend lines
Price action trendlines based on Dow theory. So if you are in an upward or down trend. It shows the real market trend and not just a simple ZickZag.

Supertrend
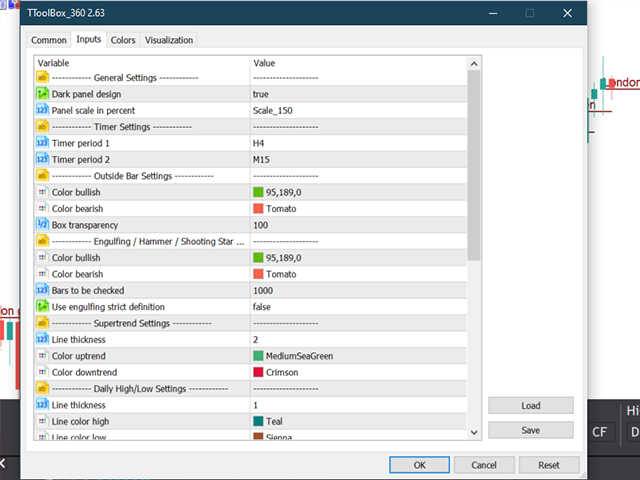
Supertrend is a very powerful and useful trend indicator to spot trend phases. It is very popular because of its clean and easy to understand principle. Prices above the trendline indicate an uptrend and prices below the trendline indicate a downtrend.

Daily highs / daily lows
With help of ToolBox 360 it is very easy to show previous daily highs und daily lows. Daily highs / lows are very important if you use price action trading because very often stops (buy stops, sell stops) are placed on this price points. This means those points are tested and price reversals ca be expected.

Weekly high / weekly low
Like daily highs / lows weekly high, weekly lows are also important for price action trading. Those points act as support or resistance levels very often. In combination with other indications this could be a very good point to open a trade and place a stop loss or a take profit.

Multi timeframe time
ToolBox 360 gives you 2 flexible count down timer. For example it can show when the next hour or 4-hour candle closes. Just select the timeframe in the settings and you are good to got. And the best, it does not matter which time frame you are actually in. It shows the count down time from your chart time frame independently.

Alerts / news notifications
Create own time based alerts and place it right into the chart. When an alert is placed you get visual and acoustic notifications before an event is happening. Never miss important market events again

Symbol performance in %
See at a glance how the market has performed during the last periods. It helps you to decide or see if the asset is bullish or bearish or you can trade two correlated assets and find the weaker and stronger ones.

Indicator panel and dialogs
ToolBox 360 is easy to use because is has user friendly panels and dialogs. Just click on the buttons to enable or disable the features and options you want.

MT5 version also available in the market.


Рекомендуем также
This is  a dashboard indicator that displays the auto-calculated risk lot, with the given risk percentage & risk points (Stop Loss) and others. The main function of this indicator is to help you calculate your exact scalping risk lots and swing risk lots. Also it displays the active trades of each pair you've executed with the following: type of trade, lot size, symbol, & equity(+/-). Also displays the bar counter set in every 5-minute bar timer. (whichever time frame you're active, the bar time
Представляем Binary Smart System: Ваш идеальный торговый компаньон Binary Smart System — это не просто индикатор, это сложный торговый инструмент, тщательно разработанный для обеспечения трейдеров точными и своевременными сигналами на различных рынках. Основываясь на передовых алгоритмах и обширной коллекции технических индикаторов, эта система является ключом к успеху в торговле. Компоненты индикатора: Процентное значение скользящей средней (MAP) : Этот компонент вычисляет взвешенное среднее зн
WPR по Профилю, или WPR для Профессионалов Индикатор Geo_WprPro - один из серии знаменитых индикаторов по профилю валюты - осуществляет одновременное отображение в матричном виде состояния двух индикаторов WPR с разными параметрами на всех таймфреймах на нескольких валютных парах, образующих профиль валюты. Как следует из описания, " Индикатор WPR является опережающим индикатором, чаще всего, он опережает график цены. Замечено, что осциллятор очень часто образует экстремумы перед разворотом цены
XFlow показывает расширяющийся ценовой канал помогающий определять тренд и моменты его разворота. Используется также при сопровождении сделок для установки тейк-профит/стоп-лосс и усреднений. Практически не имеет параметров и очень прост в использовании - просто укажите важный для вас момент истории и индикатор рассчитает ценовой канал. ОТОБРАЖАЕМЫЕ ЛИНИИ ROTATE - толстая сплошная линия. Центр общего вращения цены. Цена делает широкие циклические движения вокруг линии ROTATE. Положение цены око
IMPORTANT; Price is subject to rise at any time from now! Do not miss this offer! Dear trader I am glad to introduce my new tool called Trend Analyser Dashboard to you. The design, style, and settings of this indicator  have been made simple to make its users not take too much time in understanding the indicator itself.   The purpose is to help traders in analysing the direction of the major trend and the status of the trend whether in weak trend or its strong trend. The indicator will also prov
Индикатор отображает силу тренда на всех таймфреймах. Может быть использован на всех символах. Отображается в виде таблицы (слева направо): buy / sell / strong buy / strong sell, сила тренда (в процентах), последняя свеча (в пипсах), тело текущей свечи, оставшееся время, таймфрейм от M1 до MN. Информация в нижней части таблицы (слева направо): суммарное процентное значение тренда, продажа (в процентах), покупка (в процентах).
ROC acceleration-deceleration is the manual system for medium-term scalping. Indicator based on custom ROC system which defines bullish/bearish market and especially  acceleration-deceleration of tendention in the market's main direction. Buy arrow is plotted during bearish market when current trend decelerates and sell  arrow is plotted during bullish market when current trend decelerates. Main Indicator's Features Signals are not repaint,non-late or disappear(exept cases when system recalculat
Market Ticker
John Louis Fernando Diamante
The only Market Ticker on the market! Add a professional novelty to your workspace, with built in mini-charts A scrolling Market Ticker that displays price changes from all symbols in the Market Watch list. Provides an easy snapshot of symbol prices, and keeps scrolling automatically while you trade and analyse the chart. The ticker color (+/- price changes) are based on either the current or completed candle, and the previous candle. Options include: - MTF, eg choose to show price changes
С помощью этого торгового инструмента вы можете одновременно сканировать 15 рынков. Представляем новый торговый индикатор 2024: ️ Мультивалютный стохастик на нескольких таймфреймах. Есть как минимум две причины, по которым я создал этот торговый инструмент: Во-первых, мне надоело наблюдать только за одним рынком. Во-вторых, я не хочу упустить момент входа на другой рынок. Вот почему я хочу одновременно знать и другие рыночные условия. По этой причине мне нужен сканер, который сможе
Индикатор для бинарных опцыонов стрелочный прост в использовании и не требует настройки работает на всех валютных парах акцыях крипто валюте сигнал на покупку синяя стрелка вверх  сигнал на продажу красная стрелка в низ  советы не стоит торговать во время новостей и за 15-30 минут перед их выходом так как рынок слишком волотилен и очень много шума  входить в сделки стоит на одну или две свечи от текущего периода ( рекомендуется на 1 свечу ) таймфрейм до м 15 рекомендуемый мани менеджмент фиксир
Black series MT4 - Индикатор предназначен для торговли на бинарных опционах с Tаймфреймом М1-M5-M15 Мультивалютный (Работает на криптовалюте и на валютных парах) Сигнал появляется при открытии свечи До 90% верных сигналов Полностью отсутствует перерисовка сигналов  Можно использовать с другими индикаторами. Хороший для скальпинга! В Настройках есть: -Методы работы индикатора -И Аллерт Цвет стрелок Красный сигнал вниз Синий сигнал вверх Так же смотрите видео как работает индикатор и появляются си
Индикатор Trend Champion работает на всех таймфреймах и валютных парах. Индикатор надо использовать как вспомогательный инструмент для технического анализа, он помогает определить направление тренда: или восходящее, или нисходящее движение цены на конкретной валютной паре. Можно использовать наряду с осцилляторами в качестве фильтров. Trend Champion - это индикатор тренда. Стрелками показывает благоприятные моменты и направления для входа в рынок. Индикатор можно использовать как для пипсовки
Индикатор YFX Symbol Selector позволяет с легкостью изменять символ и период графика нажатием на одну кнопку. Для этого используется панель для выбора, которую можно расположить в любом углу графика. Панель выбора содержит следующую информацию: Описательный заголовок панели Информация о символе и элементы управления для смены символа графика Информация о периоде и элементы управления для смены периода графика Нижнее поле, содержащее текущую цену bid/ask для выбранного в данный момент символа Вся
Does your trading consist of Multiple EA's, Multiple time frames an no clear indication of how each individual strategy or time frame is performing, then this indicator will help. Assign the EA Magic number to this indicator and track it's performance on the chart by selecting on chart the period, today, week, month year or all history to view. Easy visual colour changing header to display the performance of the EA for the respective periods.    Minimize the panel to reduce chart clutter. Add yo
FFXMV Dashboard Plus
Opengates Success International
FFXMV Dashboard Plus This is a custom indicator created to give Traders a full view of what is going on in the market. It uses a real time data to access the market and display every bit of information needed to make successful trading. The PLUS there to produce the kind of RESULTS as you see in the SCREENSHOTS, I added a MultipleOrder Utility EA with it with instructions on how to use it with FFXMV Dashboard. INSTALLATION : Read the MANUALS that comes with the rest of the PACKAGE after yo
Индикатор Cancer отлично подойдет для трендовой торговли! Интеллектуальный алгоритм индикатора с высокой вероятностью показывает точки потенциального разворота рынка. Если вы торгуете по тренду то стратегия торговли построенная на основе данного индикатора отлично ам подойдет. Индикатор фильтрует рыночной шум, приктически все и все необходимые функции для работы по треду встроены в один инструмент. Работает на всех валютных парах и на всех таймфреймах, настройка индикатора - по вашему желанию. Г
CSS " currency strength slope "  is a a multi currency strength indicator that use Forex major currencies, EUR, USD, CAD, AUD, NZD, JPY, CHF, GBP. it use 28 major pairs to calculate the power of every currency using a based moving averages algorithm : you will see volatility clearly between currencies. input: MA Fast & Slow. - MA Mode : simple, exponential, smoothed, linear weighted - Applied Price : close, open, high, low, median price, typical price, weighted price.
Индикатор является торговой системой для валютных пар AUDUSD или NZDUSD. Индикатор разрабатывался для временных периодов: M15, M30. При этом, возможно использовать его на других инструментах и временных периодах, после проведения тестирования. "Kangaroo Forex" помогает определить направление сделки, показывает точки входа и имеет систему оповещений.  При движении цены в направлении сделки, отображается максимальная длина движения в пунктах. Индикатор не перерисовывается, все действия прои
Cloud Eyes is an advanced moving average alert that   will easily monitor the price action based on set moving averages to multiple open charts.  Objective: To monitor multiple open charts and notify traders conveniently in a single display panel when using the moving averages to enter/exit a trades. Features: Monitor price action in two timeframes at the same time Supports simple, exponential, smoothed, linear weighted moving averages Trigger an alert based on candle size (full/body length) Ca
Power Average
Khurram Mustafa
4.33 (3)
This Indicator is a  affordable trading tool  because with the help of  Popular Developers & Support of M Q L Platform  I have programmed this strategy. I tried to combine logic of  Moving Averages, Parabolic Stop And Reverse, Trend Strength, Oversold, Overbought . Furthermore, I have also care about  Support Resistance  that Trader can easily get in touch with market by selecting one indicator only. What is in for Trader? Trading Modes:  This selection is for  activate whole strategy  "Power
FREE
Rira Renko
Vitor Palmeira Abbehusen
RENKO on Time Chart This indicator is an enhanced Renko, so you can watch the Renko bricks on the chart to understand price movement more clearly the other improvement is automated box size according to ATR (Average True Range) period you can set the ATR number as you want and the box size of Renko changes automatically based on price movement Inputs Mode: Box size is the input to specify the size of the Renko box you want to print on the chart. This input lets you choose the fixed b
Market Structure Zig Zag
Lesedi Oliver Seilane
4.64 (28)
Free Market structure zig zag to assist in price action trading the screenshots describe how to use and how to spot patterns new version comes with alerts, email alert and  push notification alert can be used on all pairs  can be used on all timeframes  you can add additional confirmation indicators the indicator shows you your higher high and low highs as well as your lower lows and lower highs  the indication makes price action analysis easier to spot.
FREE
Strong Retracement Points Pro demo edition! SRP (Strong Retracement/Reversal Points) is a powerful and unique support and resistance indicator. It displays the closest important levels which we expect the price retracement/reversal! If all level are broken from one side, it recalculates and draws new support and resistance levels, so the levels might be valid for several days depending on the market! If you are still hesitating to start using this wonderful tool, you can check this link to see h
Самое главное в моей системе – изменения в соотношении сил продавцов и покупателей. Это ключевая идея всей системы, и в этом этом отношении мой второй индикатор FORCES-VARIATION особенно важен. Индикатор отображается в отдельном окне в виде зеленой гистограммы и красной кривой . Параметр NPIuPeriod - количество баров, используемых для расчета изменения сил покупателей. Параметр NPIdPeriod - количество баров, используемых для расчета изменения сил продавцов. Эти два параметра настраиваются по ваш
This indicator is created by considering volume divergence with price that is outcome of Bollinger band and Envolpes indicators crossing. It won’t repaint.  It is providing 1 market and three pending orders.  If it is followed with patient, it is providing remarkable profit at the end.  This indicator will be on sale soon on expert advisor. Target is calculated for buy orders as follow 1. 50 pips standard 2. Top Bollinger band 3. Sell Signal Target is calculated for buy orders as follow 1. 50
Strong Retracement Points Pro edition! SRP (Strong Retracement/Reversal Points) is a powerful and unique support and resistance indicator. It displays the closest important levels which we expect the price retracement/reversal! If all level are broken from one side, it recalculates and draws new support and resistance levels, so the levels might be valid for several days depending on the market! If you are still hesitating to start using this wonderful tool, you can check this link to see how ef
Hello Alright. This indicator works on MT4 and is very easy to use. When you receive a signal from it, you wait for that candle with the signal to close and you enter your trade at the beginning of the next new candle. A red arrow means sell and a green arrow means buy. All arrows comes with a long dotted like for easy identification of trade signal. Are you okay with that?   100% non repaint Work All Major currency  Pair,  1 minute time frame 1 minute expire, 5 minute timeframe 5 minute expire
As the title says, this is an indicator that shows the current open market (session). It has 4 sessions with customizable schedule : 1. London session, 2. New York session, 3. Sydney session, 4. Tokyo session. Indicator inputs: - The color of each session. - The open time and close time of the sessions. - The line width. The objective of the indicator, is to follow each sessions, observe at what times are multiple sessions open, and thus take the chance of the high market movements.
FREE
Индикатор рассчитывает силу восьми основных валют, а также может рассчитать силу любой другой валюты, металла или CFD. Вам не нужно просматривать множество графиков, чтобы определить сильные и слабые валюты, а также их текущую динамику. Картину всего валютного рынка за любой период времени можно увидеть в одном окне индикатора. Встроенные средства мониторинга и контроля за ситуацией помогут не упустить прибыль. Основные особенности Умеет отображать только необходимые на данный момент валюты, т
С этим продуктом покупают
The Stochastic Basket Currency Strenght  brings the Stochastic indicator to a new level.  Expanding the boundaries of TimeFrames and mono-currency analysis, the SBCS take the movements of each currency that composes the cross and confront them in the whole basket of 7 crosses.  The indicator works with any combination of AUD, CAD, CHF, EUR, GBP, JPY, NZD, USD pairs and with full automation takes in account every stochastic value (main line) for the selected Time Frame.  After that, the indicator
Данный индикатор основан на математике великого трейдера W.D.Ganna.  С помощью его мы с легкостью найдете сильные уровни анализируя свинг для поиска оптимальной точки входа. Индикатор работает на всех инструментах и всех тайм фреймах. Индикатор полностью ручной и оснащен кнопками управления. Все что вам нужно это нажать на кнопку NEW, появится отрезок, данный отрезок вы размещаете на любое движение, свинг или даже 1 свечу, которую хотите проанализировать. Разместив отрезок нажимаете кнопку ОК. П
Enigmera
Ivan Stefanov
5 (3)
ЭНИГМЕРА: ядро рынка https://www.enigmera.com Введение Этот индикатор и торговая система представляют собой удивительный подход к финансовым рынкам. ENIGMERA использует фрактальные циклы для точного расчета уровней поддержки и сопротивления. Он показывает подлинную фазу накопления и дает направление и цели.  Система, которая работает независимо от того, находимся ли мы в тренде или в коррекции.  Как она работает? ENIGMERA состоит из трех линий: линии поддержки/сопротивления, линии цели и ли
ПОЖАЛУЙСТА, ПРОЧТИТЕ ИНФОРМАЦИЮ НИЖЕ ПЕРЕД ПОКУПКОЙ! Apollo Pips PLUS SP – уникальный продукт! ЭТО ДЛЯ ТЕХ, КТО ХОЧЕТ ПОЛУЧИТЬ МОЙ НОВЫЙ ИНДИКАТОР «APOLLO PIPS» + БОНУС «SUPER PACK» С ДОСТУПОМ КО ВСЕМ МОИМ ТОРГОВЫМ ИНДИКАТОРАМ! Покупая продукт Apollo Pips PLUS SP, вы фактически приобретаете абсолютно новую версию моего индикатора Apollo Pips. Эта версия индикатора имеет улучшенный алгоритм и простой в использовании параметр, который дает вам возможность использовать индикатор на любом рынке и в
Bomb Bank Signal
Igor Pereira Calil
5 (1)
Сигнал банка-бомбы: индикатор вашей уверенности в MetaTrader 4 Bomb Bank Signal — мощный индикатор для MetaTrader 4, предназначенный для выявления наиболее актуальных тенденций финансового рынка. Если вы ищете инструмент, который точно предугадывает движения, Bomb Bank — ваш союзник. Как это работает: Этот индикатор сочетает в себе три различных метода — анализ объема, закрытие свечей и симметричный тренд — для обнаружения и сигнализации о возможностях покупки и продажи. Банк-бомба похож
Dear Onis, This Indicator is used for   GBPUSD, US30 and GOLD on 1-Min Chart . For US30 , Depending on your broker, Minimum Lot Size will differ from 0.01 to 1.0 lots. My Current Account is trading at 1.0 lots at $1 per point . Please check with your Broker what's the Margin Required for your Minimum lot sizes before you trade on your Real account. I have Forward Tested the indicator for around 6 months before releasing it to the public. ( No Demo is available for the Indicator, Strategy
Septermber OFFER 85% OFF next price for unlimited version will be 2500$. This is the only time you can get this institutional and professional indicator at this price for unlimited version. Don't dare to miss this. The tool I am about to introduce to you you can't compare it with other tools due to its strategy and accuracy level in predicting the next price directional movement. This tool is designed for serious traders who have decided to make a difference through trading. Be the next person t
Dear Traders this is my another tool called " Swing Master Indicator ". As the name above the indicator is designed to help you in swing trading by capturing the low and highs of the price. You may us this tool with any trading strategy and style from scalping to position trading. It is made for level of traders including newbies and advanced traders even prop-firms, hedge funds and banks to help them make sold market analysis. I create tools for serious traders who want to make a difference in
Данный индикатор основан на индикаторе Gann Signal  и выполняет роль сканера рынка. Все что вам нужно это заполнить в настройках выбранные валютные пары и все. Далее индикатор сам будет просматривать все эти валютные пары и тайм фреймы от М5 до D1  одновременно. При появлении нового сигнала индикатор выдаст вам Алерт а так же нарисует букву N там где будет этот новый сигнал. 
Данный индикатор предназначен для работы на любом ТФ. Программа на основе авторских алгоритмов и математике W.D.Ganna позволяет рассчитать целевые уровни движения цены по трем точкам с высочайшей степенью достоверности. Является прекрасным инструментом для биржевой торговли. Индикатор оснащен тремя кнопками NEW - вызвать треугольник для расчета. DEL - удалить выбранный треугольник. DELS - полностью удалить все построения. Вероятность достижения целей более 80%. Так же индикатор оснащен сигналом
Connect Indicator
Sukunthakan Ngernbamrung
Connect Indicator is a tool used for connecting indicators between the MQL market and MT4. The connected indicators are made by our group and can be used for other applications, such as sending messages to the Line application or Telegram application. If you have any questions, please don't hesitate to ask us to receive support. Function and indicator buffer Buffer one is the high price of the previous candle. Buffer two is the high price of the previous candle. Usage To connect indicators to fu
"CYBERBOT PROJECT"  The first unique product on the MQL5 market > One file Indicator contains Dozens of Indicators + Reversal Code Corridors including advanced mastermind capabilities simultaneously for 8 Pairs + 8 Timeframes + 8 Shadows  as well as the presence of horizontal lines for Pivot, Support and Resistance which will be adjusted automatically every day [All in one chart]. Currently, the product's selling price is over $480; however, we are offering a monthly rental system for only $30.
Precautions for subscribing to indicator This indicator only supports the computer version of MT4 Does not support MT5, mobile phones, tablets The indicator only shows the day's entry arrow The previous history arrow will not be displayed (Live broadcast is for demonstration) The indicator is a trading aid Is not a EA automatic trading No copy trading function The indicator only indicates the entry position No exit (target profit)  The entry stop loss point is set at 30-50 PIPS Or the front
Индикатор Full STO (включает в себя все версии трех индикаторов STO: Premium, Gold, Silver) - STABLE TRADE OPTION предназначен для автоматической торговли бинарными опционами.  ЧИТАЕМ ВНИМАТЕЛЬНО!!!!! ВАЖНО В одном терминале создаем два шаблона с разными экспирациями, шаблон на 18:01, 18:02 с экспирацией от 1 до 15 минут и шаблон 22:00 c экспирацией от 10 до 20 минут. Winrate: 71% over the past 5 years Money management: 0.3% from the deposit Данная версия индикатора настроена только на
MT My Way
Issara Seeboonrueang
Best strategy,  Easy trade ,  Support of version update in the future MT My Way:  "Why are successful traders outnumbered by those who fail? The goal of this project is to find strategic entry points where you can trade against the crowd effectively. For beginners, the approach is simple: enter trades on signals and exit when there’s an opposite signal or a designated exit indicator. Stop Loss can be set at the arrow, with the distance defined by the Arrow Gap. For experienced tra
Moving pivot Average Fibonacci The  indicator compares the selected period with its counterpart from the previous period. The indicator determines the moving Fibonacci levels for the day or any time interval to assess the price movement range from the time average. The indicator helps predict the expected high or low for the day based on historical time data. The pivot line can be considered an average trend line and use it in a variety of trading strategies. If you have any question about t
Это индикатор за самые большие деньги. Он обладает исключительными характеристиками. Какой бы интерес ни был на рынке, вы увидите его.  Почти во всех случаях он дает вам только долгосрочный взгляд на рынок, но не обманывайтесь, думая, что он привязан к событиям. Ничего подобного. Он находит, где на рынке находится наибольший интерес, и показывает его вам. Не забывайте, что самые большие деньги (проценты) не отображаются на рынке каждый день. Это то, с чем вы еще не сталкивались. Цена разумная
NOTE: PRICE WILL RISE VERY SOON. DON'T SKIP THIS OFFER! Dear traders I am glad to introduce the " Market Swing Scanner Board" indicator to you. This indicator was made mainly to be used in combination with the Market Swing Index Indicator. You use the  "Market Swing Scanner Board"  indicator to scan for trading opportunities on the  Market Swing Index Indicator . This tool is designed for serious traders who have decided to make a difference through trading. Be the next person to witness this st
Al in one level
Kundan Kumar Srivastava
5 (1)
This indicator is collection of important dynamic support and resistance giving a trader crystal clear idea , where to sell and where to buy. it completely complements trend lines, support, resistance, and sideways market and allow a trader to make sustainable profits. The thickness of lines suggests its strengths, the thicker the dynamic line, the stronger is rejection or pullback allowing a trader to make multi-fold profit, as they can clearly see them. Introducing Your Ultimate Trading Edge
Robot Choppiness
Diego Mauricio Padilla Mendez
3 (2)
Робот Choppines загружается как индикатор в папку индикаторов MT4. Рекомендуется использовать тайминг свечи 5 минут, рекомендуемое время экспирации робота – 5 минут. Робот можно настроить на отправку сигналов на платформы MT2, MX2, PRICEPRO. Для отправки сигналов необходимо использовать программу-коннектор той платформы, с которой мы хотим работать. Для установки на коннектор выполните следующую процедуру (прилагается изображение с описанием конфигурации с коннектором платформы МТ2):  1
This indicator ( dashboard) provides trend for multi currency on multi timeframe Charts. It gives entries and Stoploss on the chart itself  if the currency pair is uptrend then the cell color is displayed as Green and if its downtrend the cell displays the color as Red Alerts are generated whenever the trend changes on that particular timeframe. can customize the time frames as desired
Автоматические линии тренда, с push, email и звуковыми оповещениями. Вид линий (цвет, толщина, тип) отражает историю их взаимодействия с ценой: отскок, пробой, отскок после пробоя, количество отскоков, двойной пробой. Оповещения информируют пользователя об этих событиях. Пользователь может редактировать линии (корректировать, перетаскивать, удалять) и настраивать систему линий, не выгружая индикатор. Для полноценного использования индикатора рекомендуется ознакомиться с руководством в 5-минутном
Скачайте индикатор уровней поддержки и сопротивления( Support and resistance ). Индикатор рисует горизонтальные и трендовые уровни поддержки и сопротивления. Настройки индикатора: Trends - Установка режима отображения трендовых или горизонтальных уровней поддержки сопротивления Yes - отображает только трендовые уровни No - отображает только горизонтальные уровни UseResource - Установка режима использования встроенных в индикатор ресурсов. Yes - использовать индикатор ZigZag из ресурсов продукта.
The indicator of a Professional Trader - это стрелочный индикатор для прогнозирования направления движения цены. Над этим индикатором я работаю с 2014 года.  Вы можете использовать этот индикатор в качестве основного, использовать его сигналы для входа и использовать его в качестве единственного индикатора для поиска точек входа. О продукте: Рекомендуемый TF [H4-D1-W1] . Индикатор предсказывает направление движения следующей свечи.  Подходят множество инструментов; Гибкость в настройках под
Торговая система для ручной торговли The [GRAFF] III основана на многочисленных индикаторах MetaTrader (MT4). Собранные вместе, эти индикаторы представляют собой эффективный торговый инструмент. Система включает в себя более 20 различных пользовательских индикаторов, которые были тщательно отобраны и протестированы на длительном историческом периоде. Каждый конкретный индикатор основан на той или иной формуле расчета. Таким образом вся система настроена таким образом, чтобы отсеивать ложные сигн
Данный индикатор используется для определения тренда. В нем применяется классический индикатор OSMA. Оснащен системой оповещений: звуковые сигналы, оповещения на электронную почту и три типа алертов, включая отправку сообщений на мобильный телефон. Лучшие результаты были получены на 5-минутном графике. Система оповещений активируется при достижении трендом установленного значения. Работает на Форекс с CFD и другими инструментами. СИГНАЛЫ НА ПОКУПКУ НА ПАРЕ EURUSD M5 https://www.mql5.com/ru/chart
Данный индикатор используется для определения тренда. Используются три скользящие средние и ADX. Оснащен системой оповещений: звуковые сигналы, оповещения на электронную почту и три типа алертов, включая отправку сообщений на мобильный телефон. Наилучший результат зафиксирован на M5. Система оповещений активируется при достижении трендом установленного значения. Индикатор работает только с CFD. Входные параметры SoundAlarm = true - звуковое оповещение Sendmail=true - отправка уведомления о сиг
Данный индикатор используется для определения тренда. Используются три скользящие средние и ADX. Оснащен системой оповещений: звуковые сигналы, оповещения на электронную почту и три типа алертов, включая отправку сообщений на мобильный телефон. Наилучший результат зафиксирован на M5. Система оповещений активируется при достижении трендом установленного значения. Индикатор работает только с Forex-символами. Входные параметры SoundAlarm = true - звуковое оповещение Sendmail=true - отправка уведо
Данный индикатор используется для определения тренда. Используется стандартный индикатор MACD. Оснащен системой оповещений: звуковые сигналы, оповещения на электронную почту и три типа алертов, включая отправку сообщений на мобильный телефон. Лучшие результаты были получены на 5-минутном графике. Система оповещений активируется при достижении трендом установленного значения. Работает на Форекс с CFD и другими инструментами. Первое значение - быстрое EMA. Значение по умолчанию 26. Входные парам
Другие продукты этого автора
Open Risk Profit  shows your current risk or possible profit of all open positions. Total open risk is your loss if all positions run into the stop loss. Total open profit is your profit if all positions reach your take profit. Total float is your current profit or loss of all positions. The program also breaks down the information into the individual symbols. For example, you can monitor how much is your current profit and your potential risk in EURUSD, no matter how many individual positio
MT Moving Average MT Moving Average is an easy to use multi time frame moving average indicator. It shows moving averages (SMA or EMA) of current symbol from all time frames (higher and lower). No need to switch between time frames anymore. With help of the indicator panel you can select which timeframe should be shown on the chart. I.e. your current timeframe is M5 and you can turn on M15 to see the the moving average of period M15. Indicator settings Dark interface --> Set to true to use dar
Trailing Stops Pro is a highly advanced trailing stop program. It comes with 12 different trailing stops and helps you to manage your trade and stops easily. You can specify a trail start, that means the trailing stop will be started after your positions has reached the selected profit points. Additionally you can set a trail distance as well as activate and deactivate the trailing stop for each position separately. For your convenience the program has a very easy to use app panel. For a detaile
Real Trend Zigzag   shows the real trend of a market, u nlike the default Zigzag indicator. It calculates the trend in real time and shows green lines for upwards trends, red lines for downward trends and blue lines for no trends.  Regarding the old slogan "the trend is your friend" it helps you to decide if should open a buy or sell position. MT5 Version can be found here:  https://www.mql5.com/en/market/product/72065 If you are looking for a multi timeframe zigzag, take a look at the PRO vers
Real Trend Zigzag PRO   shows the real trend of a market, u nlike the default Zigzag indicator. It calculates the trend in real time and shows green lines for upwards trends, red lines for downward trends and blue lines for no trends.  Regarding the old slogan "the trend is your friend" it helps you to decide if should open a buy or sell position. The PRO version is a multi timeframe zigzag (MTF). Means, it shows the trend of the current timeframe as well as the trend of a higher or lower time.
This is the MetaTrader version of the very popular   Squeeze Momentum   indicator. It is based of of John Carter's   TTM Squeeze   volatility indicator, as discussed in his book   Mastering the Trade. With this version you can enable notifications when a squeeze is released (push notification, email, or pop-up message). Strategie Grey dots indicates a squeeze in the current timeframe.   Blue dots indicates that the squeeze is released. Mr. Carter suggests waiting till the first blue dot after
Open Risk Profit  shows your current risk or possible profit of all open positions. Total open risk   is your loss if all positions run into the stop loss. Total open profit   is your profit if all positions reach your take profit. Total float   is your current profit or loss of all positions. The program also breaks down the information into the individual symbols. For example, you can monitor how much is your current profit and your potential risk in EURUSD, no matter how many individual po
Description This is a modified version of the popular  Voss Predictive Filter - A peek into the future   by Dr. John Ehlers. It contains 2 lines - V-Line (blue) and F-Line (red), a trend indication and BUY/SELL signals. Usage Buy Green dots indicate an up trend.  Open a BUY position if the V-Line crosses the F-Line from below and an up trend is signaled (green dots) Close BUY position if V-Lines falls beneath F-Line again  Sell Red dots indicate a down trend Open a sell position if V-Line fall
The VIX Fix is a volatility indicator developed by renowned trader Larry Williams. It's designed to measure volatility in assets that don't have options or futures, such as individual stocks and forex markets. Essentially,   it acts as a synthetic VIX (Volatility Index) for any asset , providing a gauge of market uncertainty. This modified version of William's indicator helps you to find market bottoms and market tops. It comes with 2 styles: Stochastic and histogram style. Please see screenshot
MT Moving Average MT Moving Average is an easy to use multi time frame moving average indicator. It shows moving averages (SMA or EMA) of current symbol from all time frames (higher and lower). No need to switch between time frames anymore. With help of the indicator panel you can select which timeframe should be shown on the chart. I.e. your current timeframe is M5 and you can turn on M15 to see the the moving average of period M15. Indicator settings Dark interface --> Set to true to use d
ToolBox 360 is the swiss knife of all indicators. It is full packed with useful tools to help you with your trading. It can be used to find best entry and exit points and help you to decide if you should open a trade or not. It shows market trends, candlestick formations outside / inside bars and you can sett time based allerts. Main features: Time based Fibonacci lines Choose a start and end time and the indicator shows you Fibonacci lines within the selected time range including range high
Trailing Stops Pro is a highly advanced trailing stop program. It comes with 12 different trailing stops and helps you to manage your trade and stops easily. You can specify a trail start, that means the trailing stop will be started after your positions has reached the selected profit points. Additionally you can set a trail distance as well as activate and deactivate the trailing stop for each position separately. For your convenience the program has a very easy to use app panel. For a detaile
Real Trend Zigzag shows the real trend of a market, u nlike the default Zigzag indicator. It calculates the trend in real time and shows green lines for upwards trends, red lines for downward trends and blue lines for no trends.  Regarding the old slogan "the trend is your friend" it helps you to decide if should open a buy or sell position. If you are looking for a multi timeframe zigzag, take a look at the PRO version:  https://www.mql5.com/en/market/product/72071 MT4 version can be found her
Real Trend Zigzag PRO   shows the real trend of a market, u nlike the default Zigzag indicator. It calculates the trend in real time and shows green lines for upwards trends, red lines for downward trends and blue lines for no trends.  Regarding the old slogan "the trend is your friend" it helps you to decide if should open a buy or sell position. The PRO version is a multi timeframe zigzag (MTF). Means, it shows the trend of the current timeframe as well as the trend of a higher or lower time.
This is the MetaTrader version of the very popular Squeeze Momentum indicator. It is based of of John Carter's TTM Squeeze volatility indicator, as discussed in his book Mastering the Trade. With this version you can enable notifications when a squeeze is released (push notification, email, or pop-up message). Strategie Grey dots indicates a squeeze in the current timeframe. Blue dots indicates that the squeeze is released. Mr. Carter suggests waiting till the first blue dot after a grey dot a
Description This is a modified version of the popular  Voss Predictive Filter - A peek into the future by Dr. John Ehlers. It contains 2 lines - V-Line (blue) and F-Line (red), a trend indication and BUY/SELL signals. Usage Buy Green dots indicate an up trend.  Open a BUY position if the V-Line crosses the F-Line from below and an up trend is signaled (green dots) Close BUY position if V-Lines falls beneath F-Line again  Sell Red dots indicate a down trend Open a sell position if V-Line falls
The VIX Fix is a volatility indicator developed by renowned trader Larry Williams. It's designed to measure volatility in assets that don't have options or futures, such as individual stocks and forex markets. Essentially, it acts as a synthetic VIX (Volatility Index) for any asset , providing a gauge of market uncertainty. This modified version of William's indicator helps you to find market bottoms and market tops. It comes with 2 styles: Stochastic and histogram style. Please see screenshots
Фильтр:
Нет отзывов
Ответ на отзыв
Версия 2.65 2021.09.14
Minor bug fix on Supertrend
Версия 2.64 2021.09.12
- Minor bug in market trend detection fixed
- Minor bug in supertrend calculation fixed