• Обзор
  • Отзывы
  • Обсуждение

Bandas Moveis Trianguladas

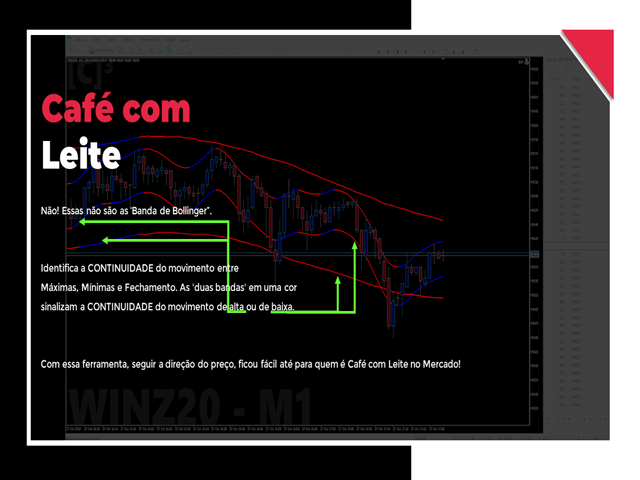
Нет! Это не «лента Боллинджера».

Определяет НЕПРЕРЫВНОСТЬ движения между максимумом, минимумом и закрытием. «Две полосы» одного цвета сигнализируют о НЕПРЕРЫВНОСТИ бычьего или медвежьего движения. С этим инструментом, отслеживая направление цен, это было легко даже для тех, кто является Café com Leite на рынке!

Помните, если:
Все наши инструменты работают вместе, эксклюзивные индикаторы и робот для управления рисками.

Они автоматически определяют различные закономерности в динамике мини-индекса, а также управляют нашими операциями. И на их основе мы рассчитываем будущие движения мини-индекса и применяем наше управление капиталом.
Рекомендуем также
place a vwap line starting from the line placed on the chart parameters: tick_mode: enable to use ticks instead of bars. this uses a lot more cpu processing power prefix: prefix to add for line created by indicator line_color: set the color of the line created line_style: set the line style of the line created applied_price: set the price of bar to use of the bar std_dev_ratio: set the multiplier for the std dev channel
Индикатор определяет состояние рынка: тренд или флэт. Состояние рынка определяется  с учётом волатильности.   Жёлтым цветом отображается флэт(торговый коридор). Зелёным цветом отображается тренд вверх.     Красным цветом отображается тренд вниз. Высота метки соответствует волатильности на рынке. Индикатор не перерисовывается . Настройки History_Size  - размер рассчитываемой истории. Period_Candles  - количество свечей для расчёта индикатора. Send_Sound  - звуковое оповещение. Send_Mail
HV Models - Индикатор содержащий в себе 4 метода расчета исторической волатильности выбранного актива. Волатильность - одна из основополагающих величин описывающих изменения базового актива. В статистике ее принято измерять как стандартно - квадратическое отклонение, однако это не единственный вариант. График цены насчитывает 4 величины (Open High Low Close) рассчитывая волатильность по стандартном    у индикатору используется лишь одна из данных величин, либо их усреднение, что дает либо искаже
Delta B3 ATR Renko Scalper é um robô especialista para negociação na Bolsa Brasileira B3 , em contratos de mini índice WIN e mini dólar WDO. O robô é programado para utilizar os cálculos Renko como análise de tendência e também como sinal de entrada, podendo operar como scalper , emitindo diversas ordens ( CUIDADO com os lotes e número de ordens!). O tamanho do Renko pode ser fixo ou variável de acordo com o indicador ATR (Average True Range) , possibilitando maior dinamismo ao robô. Os stops (
"Pattern 123" это индикатор-торговая система, построенная на популярной закономерности, паттерне 123. Это момент, когда мы ожидаем разворот на старшем тренде и входим в продолжение малого тренда, в его 3-й импульс. Индикатор отображает сигналы и разметку на открытом графике. В настройках можно включать/отключать графические построения. Индикатор имеет встроенную систему оповещений   (электронная почта, мобильный терминал, стандартный алерт терминала). У "Pattern 123" есть таблица,  котор
This is Gekko's Bollinger Bands indicator. It extends the use of the famous Bollinger Bands and calculates strong entry and exit signals using price action on the edge and on the middle bands. You can set it up in many different ways, eg: pullback, pullback against trend, middle band crossing and middle band crossing against trend. Inputs Number of Bars to Plot Indicator:  number of historical bars to plot the indicator, keep it low for better performance; Produces Signal Only When a Bar Closes:
The patterns of 3 (three) Candles: Three White Soldiers; Three Black Crows; These are reversal patterns widely used by traders, as they have a high probability of showing the inversion of the current market movement. For example, if in a bullish trend there are three black crows, there is a high probability of reversing the current bullish movement. The Three White Soldiers have the following characteristics: There are 3 consecutive candles with a good body, that is, the difference between
This Indicator adding power to traditional zigzag indicator. With High-Low numbers in vision it will be easier to estimate change of trend by knowing the depth of each wave. Information including points, pips, percentage%, and #bars can be displayed based on configuration. All information is real-time update. This indicator is especially useful in sideway market to buy low sell high.
This product is designed for the MT5 platform and offers two key features: VWAP (Volume Weighted Average Price) calculation and Volume Profile analysis. Advantages: VWAP Calculation: The product calculates the VWAP, which is a popular indicator used by traders to determine the average price of a security based on its trading volume. It helps identify potential buying or selling opportunities by comparing the current price to the average price weighted by volume. Volume Profile Analysis: The prod
RAD CRITICAL LEVES RAD indicator tracks “Relevant Volume” in real time, identifying accumulation and distribution processes, projecting them in the chart as SUPPORT or RESISTANCE zones. Natural   support   and resistance levels are generated by Volume Accumulation and Distribution processes. As these processes evolve, levels at which the relevant volume in the market place is positioned, become difficult areas to cross upwards or downwards. By using this information, traders can identify very s
The new update makes this indicator a complete tool for studying, analyzing and operating probabilistic patterns. It includes: On-chart Multi-asset percentage monitor. Configurable martingales. Twenty-one pre-configured patterns, including Mhi patterns and C3. An advanced pattern editor to store up to 5 custom patterns. Backtest mode to test results with loss reports. Trend filter. Hit operational filter. Martingale Cycles option. Various types of strategies and alerts. Confluence between patter
MT4 версия - https://www.mql5.com/ru/market/product/69932 В отличие от других индикаторов подобного типа, данная версия обладает: Возможностью отображения данных из более мелких таймфреймов на текущем графике. Например, отображение данных из M1 периода на графике H1. Возможностью   расчета значений по формуле Гаусса (формула нормального распределения). Гибкой системой настроек. Настройки: basePeriod   - базовый период. indicatorMode  - режим отображения. Задает величину каждого интервала:   by4h
Keltner Channels (ou   Canais de Keltner ) é mais um indicador de   volatilidade   utilizado pela   análise técnica. Também chamado de   envelope , esse canal foi criado por Chester Keltner para monitorar os seus investimentos no mercado futuro de café na década de 1960. Porém, com o passar do tempo, passou também a ser utilizado para outros ativos e, atualmente, é uma das ferramentas mais utilizadas pelos traders. Nesta versão customizada foram adicionados novas opções de método de média movel
WAPV Box Effort x Result
Eduardo Da Costa Custodio Santos
WA_PV_BOX_EFFORT X РЕЗУЛЬТАТ для MT5 Индикатор WAPV Box Effort x Result входит в группу индикаторов пакета (Wyckoff Academy Wave Market). Индикатор WAPV Box Effort x Result для MT5 поможет вам определить цену и объем. Его прочтение состоит в том, чтобы помочь идентифицировать усилие x результат. в волнах, созданных графиком. Индикатор WAPV Box Effort x Result для MT5, когда поле зеленого цвета, означает, что объем соответствует спросу, а когда поле красного цвета. объем в пользу предложения. Чем
[跟单系统] T he most friendly Copier interactive interface, the most abundant easy-to-use functions, and the best Copy solution.    EASY   : Easy to use, load and select the Master or SLAVE to use easily FAST:   Quickly copy orders, algorithmic optimal follow-up mechanism, priority calculation of new signals, priority queue processing received special signals Multiple:   1. Support multiple signals to be sent at the same time, multiple accounts can select multiple accounts to copy at the same time 2
Marcon s Deviation
Luiz Antonio De Sousa Marcon
DESVIO DE MARCON  (Desvio Dinâmico de VWAP) O Desvio de Marcon é um indicador desenvolvido com o intuito de fornecer ao TRADER uma ferramenta capaz de antecipar pontos relevantes de suporte e resistência através de canais de desvios de VWAP traçados no gráfico.  Mas qual a diferença entre o Desvio de Marcon e os canais de desvio padrão da VWAP já existentes? O Desvio de Marcon utiliza um algoritmo estatístico desenvolvido por Luiz Antonio de Sousa Marcon, que lhe dá a capacidade de se auto calib
Sam TrendBlaster for MT5
AKILA THILINDA JAYARATHNA RANASINGHEGE
3.5 (2)
***** This is an indicator for MT5 providing accurate arrow signals without repainting. ***** Trade With Sam Simple Strategy Guide :  https://www.mql5.com/en/blogs/post/740855 MT4 version of the indicator Try Out and see the Difference The Sam's Trend Blaster indicator tracks the market trend with an unmatched reliability, by ignoring sudden fluctuations and market noise. It has been designed to trend-trade intraday charts and small timeframes. Its winning ratio is around 85%. This is a
Trend change detector is an indicator for Metatrader 5.It can help you determine the change in a local trend to open a correct position. It has 2 parameters. Period and mistake offset percent. You can change the period parameter to capture little changes in trend.  There are two lines: the red one and the green one. You can use them as a local support and resistance level. Arrows show the change in a trend. Up arrow the price will go down and Down arrow the price will go up. Also, by changing m
This product contains following indicators: (Lines + LineSAR + Channels + BTL + Ladder) Phi Lines  - special EMAs, similar to MIMAs from Phicube; Phi LineSAR  - erase and highlight Phi Lines in support or resistance. Similart to MIMASAR from Phicube; Phi Channels  - show support and resistance, similar to Phibo from Phicube (Green and Read Lines); Phi BTL  - candles color following Phi Lines alignment; Phi LADDER  - Indicator that allow you to visualize possible targets.  FUTURO Tool Future to
The indicator returning pivot point based trendlines with highlighted breakouts . Trendline caculated by pivot point and other clue are ATR, Stdev. The indicator also includes integrated alerts for  trendlines  breakouts and foward message to Telegram channel or group if you want. Settings ·          Lookback bar: Default 200 is number of bar caculate when init indicator. ·          Length:  Pivot points  period ·          Slope Calculation Method: Determines how this lope is calculated. We supp
XCalper CandleTimer
Aecio de Feo Flora Neto
4.45 (20)
Этот вспомогательный постоянно обновляющийся индикатор отображает время, оставшееся до закрытия на текущем таймфрейме. Также он показывает цену последней сделки и отклонение от уровня закрытия предыдущего дня. Индикатор полезен дневным трейдерам и скальперам, которые пристально следят за открытием и закрытием свечей. Настройки индикатора Show in shifted end - по умолчанию: False. Отображение времени и значения на экране. При значении True отображается только время до закрытия возле последней с
FREE
Tatino Super Signals is Non Repaint Indicator for Binary Option trading and Forex trading. Recommendations: Timeframe: All timeframes. For best results we recommend using it on M1, M5 and M15 timeframes. Currency pairs: All Pairs Account type: All Type Broker time: Any Brokers : Alls Binary Trading : Expired 1 Candle Buffer Buy=1, Sell=0, Entry Next Candle Recommended Forex trading stop loss : 15 pips Recommended  Forex tradingTake profit levels : 15 pips Specifications: Does not repaint  
Индикатор отображает историю и будущие экономические новости по валютным инструментам с сайта fxstreet.com и позволяет вам торговать на новостях, закрывать или хеджировать позиции до выхода новостей. Посмотрите видео ниже о том как протестировать демо версию.  Для загрузки данных экономического календаря используйте скрипт Economic news calendar loader . Основные возможности: История экономических новостей с 2001 года с сайта Уведомления в терминале, push на телефон или письмо на email за настр
KT Fractal Channel Breakout draws a continuous channel by connecting the successive Up and Down fractals. It provides alerts and also plots the Up and Down arrows representing the bullish and bearish breakout of the fractal channel. Features If you use Bill Williams fractals in your technical analysis, you must also include it in your trading arsenal. It can be very effective and useful for stop-loss trailing. A new market trend often emerges after a fractal channel breakout in a new directi
The Martinware Market Sides' Strength indicator shows the candlestick chart in a different manner allowing for a clearer view of which side, bullish or bearish is dominating the asset in the current period. As a bonus, it can also show an internal area that can be used to visualize two levels of Fibonacci retracements inside the bars. The default configuration shows the MSS bars with 4 main colors, two representing the bullish force, and two representing the bearish one. The primary colors a
Strong Candle Indicates the size of each candlestick with the text value above it and indicates which candlestick has a body larger than the one specified in the parameters in percentage, that is, a strong candlestick (between Size_Min and Size_Max) with at least x% of body. The candlestick size is placed in the buffer and that is the buy or sell indication, where: value > 0 = bullish candle or value < 0 bearish candle, value = 0 means no indication (the candle did not match the desired pattern
Daily VWAP, continues for a period of hours (eg, 10 hours of history), with color to indicate change of direction and bands to map good entry and exit points. The indicator was created to map the center of the market, and find good buying moments, trend analysis or market correction points are easily detected, allowing you to understand moments of exhaustion and buying and selling points Copyright (c) <year> <copyright holders> Permission is hereby granted, free of charge, to any person obtain
Boom and Crash Pro Indicator The Savia Forex Solutions Boom and Crash Pro Indicator gives you highly accurate entries on all Boom and Crash Indices. The Boom and Crash Pro Indicator is dynamic and powerful and is optimized for all timeframes. Trade with improved confidence and maximize your success rate. Benefits Dynamic and Powerful. Boom and Crash Pro Indicator is fully optimized for all chart timeframes. Whether price action is an uptrend, downtrend or trading sideways, Boom and Crash Pro Ind
Your Pointer - это не обычный форекс канал. Этот коридор выстраивается на основании анализа нескольких свечей, начиная от последней, в результате чего определяются экстремумы исследуемого промежутка. Именно они и создают линии канала. Он как и все каналы имеет среднюю линию а также линию максимума и минимума. Этот канал стоит внимания из-за своего необычного поведения. Применение индикатора Your Pointer позволяет трейдеру вовремя отреагировать на выход цены за границы установленного для нее кан
Introducing the Order Block Indicator , the pinnacle of trading technology. Order blocks, the large cluster of buy or sell orders placed by institutional traders, significantly influence market direction. They form at critical price levels and can act as robust support and resistance zones. Our cutting-edge indicator allows you to harness the full potential of these influential market dynamics, providing a never-before-seen level of precision and customization. Here's why this tool stands apart:
С этим продуктом покупают
Прежде всего стоит подчеркнуть, что этот торговый индикатор не перерисовывается, не перерисовывает и не отставает, что делает его идеальным как для ручной, так и для роботизированной торговли. Руководство пользователя: настройки, вводы и стратегия. Атомный аналитик - это индикатор ценового действия PA, который использует силу и импульс цены, чтобы найти лучший край на рынке. Оборудованный расширенными фильтрами, которые помогают убирать шумы и ложные сигналы, и повышают торговый потенциал. Испо
Представляем       Индикатор Quantum Trend Sniper   , инновационный индикатор MQL5, который меняет способ определения разворотов тренда и торговли ими! Разработан командой опытных трейдеров со стажем торговли более 13 лет,       Снайперский индикатор Quantum Trend       разработан, чтобы вывести ваше торговое путешествие на новые высоты благодаря инновационному способу определения разворотов тренда с чрезвычайно высокой точностью. ***Купите индикатор Quantum Trend Sniper и получите индикатор
Прежде всего стоит подчеркнуть, что эта торговая система является индикатором без перерисовки, без повторной отрисовки и без задержки, что делает ее идеальной как для ручной, так и для роботизированной торговли. Онлайн курс, руководство и загрузка пресетов. «Smart Trend Trading System MT5» - это комплексное торговое решение, созданное для новичков и опытных трейдеров. Он объединяет более 10 премиальных индикаторов и предлагает более 7 надежных торговых стратегий, что делает его универсальным
Топовый индикатор МТ5, дающий сигналы для входа в сделки без перерисовки! Идеальные точки входа в сделки для  валют, крипты, металлов, акций, индексов !  Смотрите  видео  (6:22) с примером отработки всего одного сигнала, окупившего индикатор. Версия индикатора для MT4 Преимущества индикатора Сигналы на вход без перерисовки Если сигнал появился, он никуда НЕ исчезает! В отличие от индикаторов с перерисовкой, которые ведут к потере депозита, потому что могут показать сигнал, а потом убрать его.
The AT Forex Indicator MT5 is a sophisticated trading tool designed to provide traders with a comprehensive analysis of multiple currency pairs. This powerful indicator simplifies the complex nature of the forex market, making it accessible for both novice and experienced traders. AT Forex Indicator uses advanced algorithms to detect trends, patterns and is an essential tool for traders aiming to enhance their forex trading performance. With its robust features, ease of use, and reliable signal
TPSpro TRENDPRO   —  трендовый индикатор, который автоматически анализирует рынок и предоставляет информацию о тренде и каждой его смене а также дающий сигналы для входа в сделки без перерисовки! Индикатор использует каждую свечу, анализируя их отдельно. относя к разным импульсам – импульс вверх или вниз. Точные точки входа в сделки  для  валют, крипты, металлов, акций, индексов! -  Version MT4                ПОЛНОЕ ОПИСАНИЕ ИНДИКАТОРА          Рекомендуем использовать с  индикатором -  RFI LE
Reversal First Impulse levels (RFI)          INSTRUCTIONS     RUS      -      ENG          Рекомендуем использовать с индикатором - TPSpro  TREND PRO -  Version MT4             Важным ключевым элементом в трейдинге являются зоны или уровни, от которых принимаются решения о покупке или продаже торгового инструмента. Несмотря на попытки крупных игроков скрыть свое присутствие на рынке, они неизбежно оставляют следы. Наша задача заключалась в том, чтобы научиться находить эти следы и правильно их
FX Volume MT5
Daniel Stein
4.94 (17)
Получайте ежедневную информацию о рынке с подробностями и скриншотами в нашем утреннем брифинге здесь, на mql5 , и в Telegram ! FX Volume - это ПЕРВЫЙ и ЕДИНСТВЕННЫЙ индикатор объема, который дает РЕАЛЬНОЕ представление о настроении рынка с точки зрения брокера. Он дает потрясающее представление о том, как институциональные участники рынка, такие как брокеры, позиционируют себя на рынке Forex, гораздо быстрее, чем отчеты COT. Видеть эту информацию прямо на своем графике - это настоящий геймчей
Step into the realm of Forex trading with confidence and precision using XQ, a cutting-edge Forex indicator designed to elevate your trading game to unprecedented heights. Whether you're a seasoned trader or just stepping into the world of currency exchange, XQ Forex Indicator empowers you with the insights and signals needed to make informed trading decisions. The signal conditions are a combination of three indicators, and XQ Forex Indicator only display  medium and long-term trends . The ind
TPA True Price Action indicator reveals the true price action of the market makers through 100% non-repainting signals strictly at the close of a candle! TPA shows entries and re-entries, every time the bulls are definitely stronger than the bears and vice versa. Not to confuse with red/green candles. The shift of power gets confirmed at the earliest stage and is ONE exit strategy of several. There are available now two free parts of the TPA User Guide for our customers. The first "The Basics"
Представляем       Quantum Breakout PRO   , новаторский индикатор MQL5, который меняет ваш способ торговли в зонах прорыва! Разработан командой опытных трейдеров со стажем торговли более 13 лет,       Квантовый прорыв PRO       разработан, чтобы поднять ваше торговое путешествие к новым высотам с его инновационной и динамичной стратегией зоны прорыва. Quantum Breakout Indicator покажет вам сигнальные стрелки на зонах прорыва с 5 целевыми зонами прибыли и предложением стоп-лосса на основе по
Этот индикатор является уникальным, качественным и доступным инструментом для торговли, включающим в себя наши собственные разработки и новую формулу. В обновленной версии появилась возможность отображать зоны двух таймфреймов. Это означает, что вам будут доступны зоны не только на старшем ТФ, а сразу с двух таймфреймов - таймфрейма графика и старшего: отображение вложенных зон. Обновление обязательно понравится всем трейдерам, торгующим по зонам спроса и предложения. Важная информация Для мак
Сейчас 147 долл. США (увеличиваясь до 499 долл. США после нескольких обновлений) - неограниченные учетные записи (ПК или Mac) Руководство пользователя + Обучающие видео + Доступ к приватному Discord-каналу + VIP-статус и мобильная версия + Лицензия на 5 ПК с неограниченным количеством аккаунтов и терминалов MT4. Сколько раз вы покупали индикатор торговли с замечательными обратными тестами, доказательствами производительности на живых счетах и зашикарными цифрами и статистикой, но после испо
Этот индикатор представляет собой метод анализа рынка, основанный на статье «Математическая формула для прогнозов рынка», написанной У.Д. Ганном, в зависимости от метода квадрата девяти и квадрата 144. Руководство пользователя: Add Your review And contact us to get it Вы можете купить полную версию MT4 у: https://www.mql5.com/en/market/product/15316 Вы можете бесплатно протестировать на МТ4: https://www.mql5.com/en/market/product/15320?source=Site +Profile+Seller#!tab=reviews
Gartley Hunter Multi - Индикатор для поиска гармонических моделей одовременно на десятках торговых инструментов и на всех возможных ценовых диапазонах. Инструкция/Мануал ( Обязательно читайте перед приобретением ) | Версия для МТ4 Преимущества 1. Паттерны: Гартли, Бабочка, Акула, Краб. Летучая мышь, Альтернативная летучая мышь, Глубокий краб, Cypher 2. Одновременный поиск паттернов на десятках торговых инструментов и на всех возможных таймфреймах 3. Поиск паттернов всех возможных размеров. От
Прецизионный индикатор осциллятора (Pi-Osc) от Роджера Медкалфа из Precision Trading Systems Версия 2 была тщательно перекодирована для быстрой загрузки на вашем графике, а также внесены некоторые другие технические улучшения для улучшения опыта. Pi-Osc был создан для предоставления точных сигналов времени для совершения сделок, предназначенных для поиска экстремальных точек истощения - точек, к которым рынок вынужден идти, чтобы сработать стоп-заказы всех остальных. Этот продукт решает вековую
Bill Williams Advanced предназначен для автоматического анализа графика по системе " Profitunity " Билла Уильямса. Индикатор анализирует сразу четыре таймфрейма. Инструкция/Мануал ( Обязательно читайте перед приобретением ) Преимущества 1. Автоматически анализирует график по системе "Profitunity" Билла Уильямса. Найденные сигналы помещает в таблицу в углу экрана. 2. Оснащён трендовым фильтром по индикатору Аллигатор. Большинство сигналов системы рекомендуется использовать только по тренду.
IVISTscalp5
Vadym Zhukovskyi
5 (5)
Что нового в индикаторе прогнозов iVISTscalp5 (Версия 10)? iVISTscalp5 – это авторская система прогнозов для любого финансового инструмента на неделю вперед (для быстрого скальпинга по уровням времени). iVISTscalp5 – инструмент для простого изучения и понимания финансового рынка. 1)     Индикатор прогнозов iVISTscalp5 полностью переписан на другой язык программирования ( C ++), что ускорило загрузку и обработку данных. Разное графическое отображение прогнозов на графике будет еще проще для п
The Volumebyprice.com Indicator for MetaTrader 5 features Volume Profile and Market Profile TPO (Time Price Opportunity). Volume and TPO histogram bar and line charts. Volume Footprint charts. TPO letter and block marker collapsed and split structure charts. Static, dynamic and flexible range segmentation and compositing methods with relative and absolute visualizations. Session hours filtering and segment concatenation with Market Watch and custom user specifications. Graphical layering, posit
Индикатор Trend Forecaster использует уникальный авторский алгоритм для определения точек входа в сделку по пробойной стратегии. Индикатор определяет ценовые скопления и анализирует движение цены возле уровней и показывает сигнал, когда цена пробивает уровень. Индикатор Trend Forecaster подходит для любых финансовых активов: валюты (Форекс), металлы, акции, индексы, криптовалюты. Также индикатор можно настроить для работы на любых тайм-фреймах, однако в качестве рабочего тайм-фрейма все же реком
Следуйте тренду. Да, дождитесь сигнала на вход, будь то покупка или продажа, на 15-минутном фрейме и проверьте сигнал, если он появится на 30-минутном фрейме (иногда для появления сигнала требуется час или больше. Вы можете вернуться на 15-минутный фрейм и вернитесь к 30-минутному фрейму и повторяйте это до тех пор, пока у вас не появится основной сигнал. Если сигнал появляется на 30-минутном фрейме, входите по цене и фиксируйте прибыль при изменении линии рисунка. , фиксируется прибыль или при
Stargogs Spike Catcher
Lorenzo Edward Beukes
4.5 (8)
Stargogs Spike Catcher V3.12 This Indicator is Developed To milk the BOOM and CRASH indices . Send me Message if you need any help with the indicator.  CHECK OUT THE STARGOGS SPIKE CATCHER EA/ROBOT V3: CLICK HERE ALSO CHECK OUT SECOND TO NONEFX SPIKE CATCHER:   CLICK HERE STARGOGS SPIKE CATCHER V3.12 WHATS NEW! Brand New Strategy. This is the Indicator you need for 2023. The Indicator Gives you an Entry at a time when conditions are met enter on every arrow and exit when it gives an X. New Tren
3 Indicators in 1 indicator Strategy based on price action Made specifically for the best forex currency pairs Can be used in the best time frame of the market at a very reasonable price This indicator is basically 3 different indicatos . But we have combined these 3 indicators in 1 indicator so that you can use 3 indicators at the lowest price. All three strategies are based on price action. But based on different trends. Long term, medium term and short term Attributes : No repaintin
Сверхбыстрое распознание параболических каналов ( а также линейных, горизонтальных и волнообразных) на всей глубине истории, создавая иерархию каналов. Необходима настройка: Max bars in chart: Unlimited Данный индикатор предназначен в первую очередь для алгоритмического трейдинга, но можно использовать и для ручной торговли  Данный индикатор будет иметь в ближайшем будущем очень активную эволюцию и подробные описания, как применять для создания роботов
note: this indicator is for METATRADER4, if you want the version for METATRADER5 this is the link:  https://www.mql5.com/it/market/product/108106 TRENDMAESTRO ver 2.4 TRENDMAESTRO recognizes a new TREND in the bud, he never makes mistakes. The certainty of identifying a new TREND is priceless. DESCRIPTION TRENDMAESTRO identifies a new TREND in the bud, this indicator examines the volatility, volumes and momentum to identify the moment in which there is an explosion of one or more of these data a
Golden Spikes Detector This indicator is based on an advanced strategy primarily for trading spikes on Boom and Crash Indices. Complex algorithms were implemented to detect high probability entries only. It alerts on potential Buy and Sell entries. To trade spikes on the Deriv or Binary broker, only take Buy Boom and Sell Cash alerts. It was optimised to be loaded on 5-minute timeframe although multiple timeframe analysis is done in the background. Features ·             Desktop pop up and sound
40% СКИДКА НА РОЖДЕСТВО! ПОВЫШЕНИЕ ЦЕНЫ ДО $250 С 1 ЯНВАРЯ! Представляем GoldenGate Entries: Революционное Торговое Решение! Откройте для себя революционный подход к торговле с GoldenGate Entries (GGE), передовым индикатором, разработанным для повышения вашего опыта торговли. GGE предоставляет обширный набор функций, чтобы предоставить пользователям точность и уверенность в их торговых решениях. Пары: Любые (валюты - товары - акции - акции - криптовалюты) Таймфреймы: 15 минут до H1 Ос
Currently Price  20% OFF  ( for unlimited use ) Indicator   USER MANUAL , trade setups, solving issues, etc :  Direct Download Here     (  for users only  ) Hello World! Introducing.. SMCpro tool and Indicator for  MetaTrader 5 , a cutting-edge feature designed to revolutionize your trading experience. With innovative ICT Smart Money Concept, you gain unparalleled insight into market dynamics, empowering you to make informed trading decisions like never before. SMC Indicator built on th
Доброго времени суток! Представляю вам торговый технический индикатор для синтетических индексов брокера Deriv. Данный индикатор работает ТОЛЬКО с нижеуказанными индексами: Boom 300 Index Boom 500 Index Boom 1000 Index Crash 300 Index Crash 500 Index Crash 1000 Index Индикатор создан для подачи сигналов на открытие среднесрочных сделок в сторону Спайков. Но вы можете открывать сделки и в противоположную Спайкам сторону, на свой риск. Торговля только на М1. Другие ТФ не гарантируют корректную р
WHY IS OUR FXACCCURATE LS MT5 THE PROFITABLE ? PROTECT YOUR CAPITAL WITH RISK MANAGEMENT Gives entry, stop and target levels from time to time. It finds Trading opportunities by analyzing what the price is doing during established trends. POWERFUL INDICATOR FOR A RELIABLE STRATEGIES We have made these indicators with a lot of years of hard work. It is made at a very advanced level. Established trends provide dozens of trading opportunities, but most trend indicators completely ignore them!
Другие продукты этого автора
One of the Best Volume Indicators, with the addition of a Moving Average for weighting volume over time average. If the "Current Candle" Volume is X% greater than the Moving Average value, we will have a sign of increasing volume. It can be a sign of Beginning, Continuity, Reversal or Exhaustion of the Movement. Fully configurable and all options open, you can color and set ALL values as you see fit. The 'Volume Break' shows volume bars in the same color as the candlestick, in addition
Этот инструмент рисует свечи в разные ВРЕМЕННЫЕ РАМКИ от «паттерна», отображаемого на экране ... ... На «Стандартном графике» M1 он рисует свечи в M15. Например: «Стандартный график» в M1, «OHLC» в M15 - это свечи (прямоугольники) M15 за свечами M1. Скачать демо-версию ... ... посмотрите, как это может помочь вам заметить точки поддержки / сопротивления, а также хорошие движения с максимумами и минимумами за 15 месяцев.
Считает время жизни Candle Extra до ее закрытия. Он используется для помощи при вводе операций ... ... Мы работаем при закрытии одноминутных свечей, то есть когда таймер установлен на 00: xx: 01. Мы открываем ордер, и значение этой операции также отображается инструментом. Дополнительно: чтобы «разблокировать» шкалу цен. Дважды щелкните по шкале, и график будет «центрирован по горизонтали». Помимо возможности расширения и сжатия шкалы цен, мы можем перемещаться по графику, перетаскивая
Quando você abrir uma operação, mover o Stop Loss para o ponto de entrada (Break-Even) sempre que a operação andar favoravelmente 75 pontos, é uma obrigação! Isto significa que, quando sua operação atingir 75pts você moverá o Stop Loss para 10pts do ponto de entrada, desta forma, basicamente você vai colocar o Stop Loss em um preço 'melhor' que o preço de entrada (Break Even), ou seja, no lucro. Na pior das hipóteses, você sairá no “zero a zero”. A ideia é não deixar que uma operação parcialment
Автоматически строит «золотое соотношение Фибоначчи» между максимумом и минимумом предыдущего дня ... ... Максимумы и минимумы - отличные зоны поддержки и сопротивления. Прорывы уровней Фибоначчи являются ключевыми точками входа и выхода из сделок. Розовые линии показывают, что свеча предыдущего дня закрылась ниже. Линии синего цвета показывают, что свеча предыдущего дня закрылась выше.
Фильтр:
Нет отзывов
Ответ на отзыв