Extreme Price Action Dashboard
- Утилиты
- Eduardo Kipper
- Версия: 1.2
- Обновлено: 8 июля 2021
- Активации: 10
EXTREME PRICE ACTION DASHBOARD |
|---|
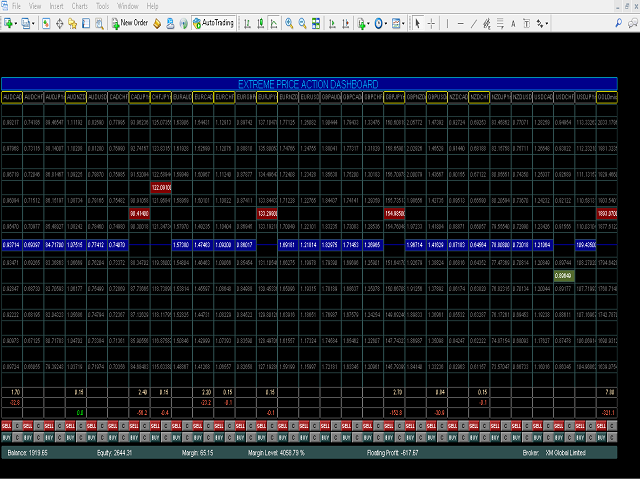
- Make your trades professionally using advanced statistics and price action.
- Manages 29 pairs simultaneously.
- It has Buy and Sell buttons, close buy and close sell separately for each pair.
- Stop Gain and Stop Gain programmable in Pips automatically.
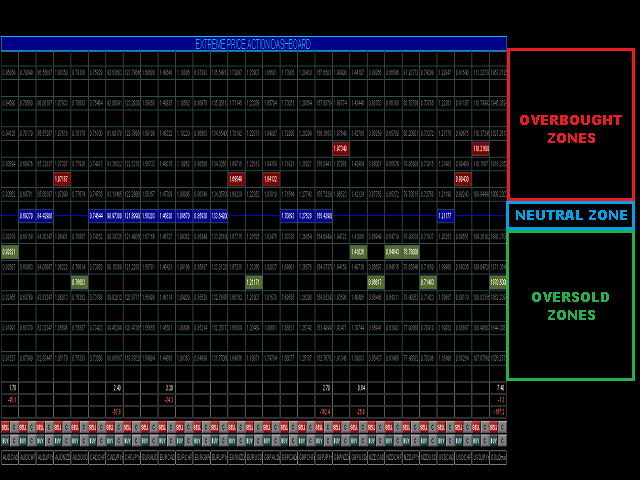
- Dynamically calculates 5 regions where statistically the most assertive sales and 5 more assertive shopping regions are found.
- Indicates the total lots, buy balance and sell balance for each pair.
- Change the graph's time frame to change the calculated regions. The larger the time frame, the greater the assertiveness of the trades.
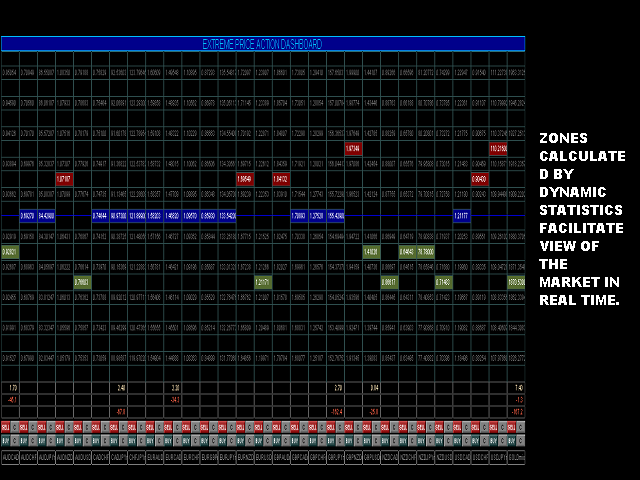
- Extreme Price Action Dashboard automatically calculates regions where the price may weaken or market reversals.
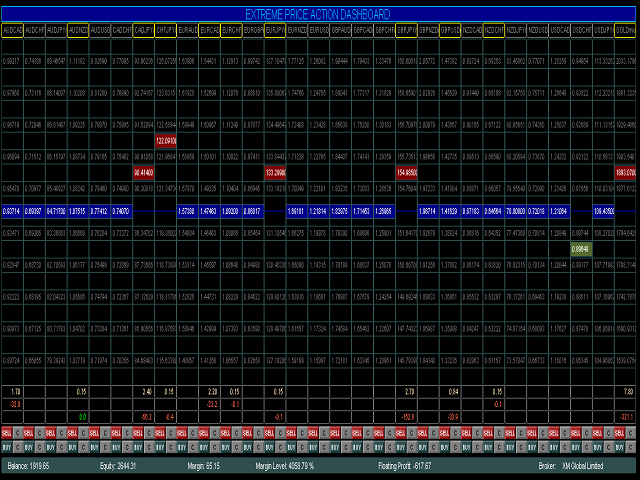
- Basically when the price is at the blue midline, the market has no clear offers and demands for an assertive trade.
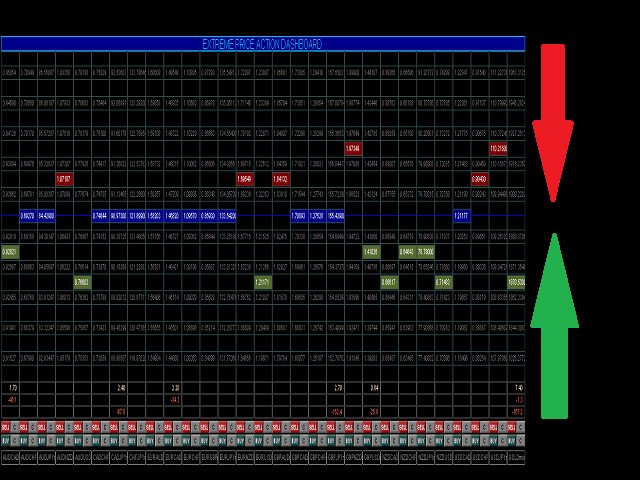
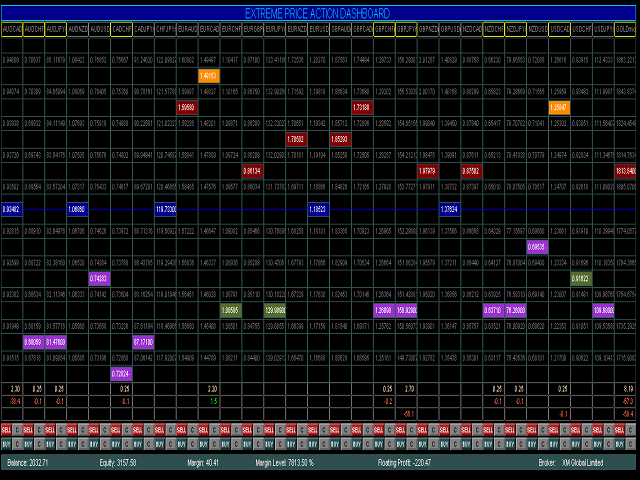
- The higher the asset's price is on the blue line, it is suggested to sell (red color). If the color is purple, the sale is more likely to win.
- The lower the price of the blue line, it is suggested to buy (green). If the sign is in orange color, the purchase will be more likely to win.The calculated levels are dynamic, that is, they are always being recalculated by the market, this will always keep you updated with the new trend.
| DYNAMIC CURRENT PRICE | HOW TO ANALYZE COLORS |
|---|---|
| BLUE RECTANGLE | SIDE MARKET |
| RED RECTANGLE | IN RESISTANCE REGION. THE HIGHER, THE MORE ASSERTIVE THE TRADE WILL BE. |
| GREEN RECTANGLE | IN THE SUPPORT REGION. THE LOWER, THE MORE ASSERTIVE THE TRADE WILL BE. |
| PURPLE RECTANGLE | IN THE SUPPORT REGION. SIGNALS A HIGH PROBABILITY OF HIT. |
| ORANGE RECTANGLE | IN RESISTANCE REGION. SIGNALS A HIGH PROBABILITY OF HIT. |
| BUTTON FUNCTION | WHAT ARE YOU DOING ? |
|---|---|
| SELL BUTTON | OPENS A MARKET SELL ORDER. |
| BUY BUTTON | OPENS A MARKET BUY ORDER. |
| CLOSE BUTTON | CLOSE THE SELL OR BUY ORDER. |
| NOTE: CHANGE TAKE PROFIT, STOP LOSS AND BATCH AMOUNT IN EA PARAMETERS. |
| INSTRUCTIONS ON HOW TO USE THE EXTREME PRICE DASHBOARD |
|---|
|
|
|
|
|
























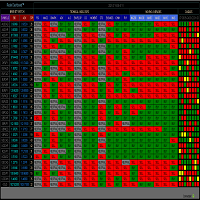
Nice utility dashboard. Dashboard does not show buy/sell signals but shows much more valuable information.