Start Midas Displacement Channel
- Индикаторы
- Ricardo Almeida Branco
- Версия: 1.0
- Активации: 5
Midas is the acronym for Market Interpretation / Data Analysis System is a trade approach started in 1995 by technical analyst Paul Levine and later developed by Andrew Coles, PhD and David Hawkins. Learn more in the book MIDAS Technical Analysis: A VWAP Approach to Trading and Investing in Today's Markets, (I saw that it is possible buy via Amazon).
The positive points in relation to the Midas-based indicators are the prediction of movement reversal points, the negative point is the subjectivity in finding the anchoring points.
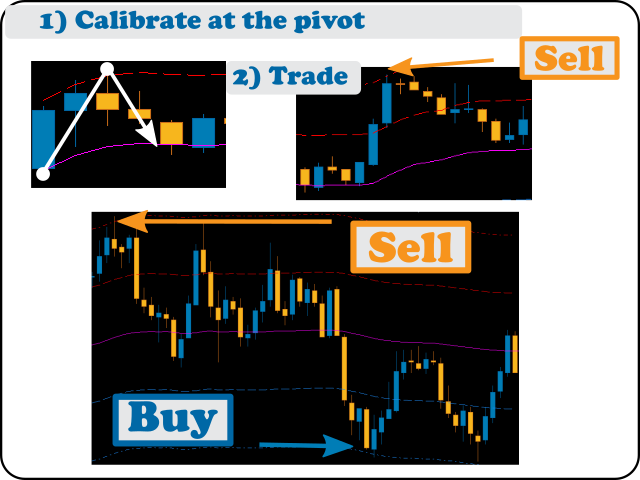
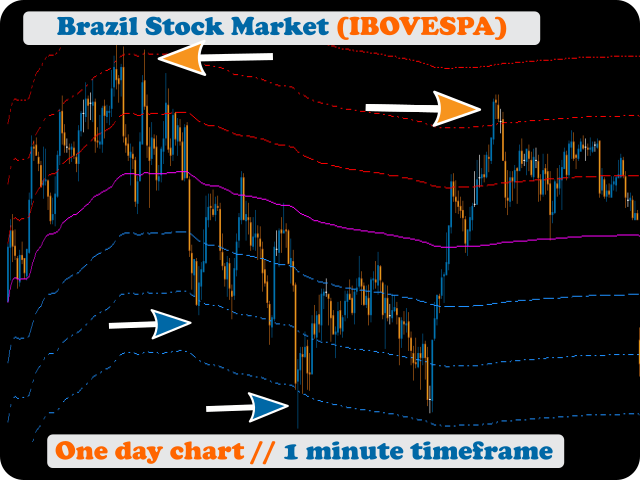
One idea would be (as you can see in the photos) to use the first daily pivot to determine the range of daily movement and thus activate the bands to map support and resistance levels.
A second idea is to "calibrate" the anchor point until you find where it is really being respected. In this regard, the functions present in the indicator greatly facilitate the work of the trader. With the shortcut keys + keyboard and mouse you have a light, practical tool that can be an ally in your operating system.
The input parameters are:
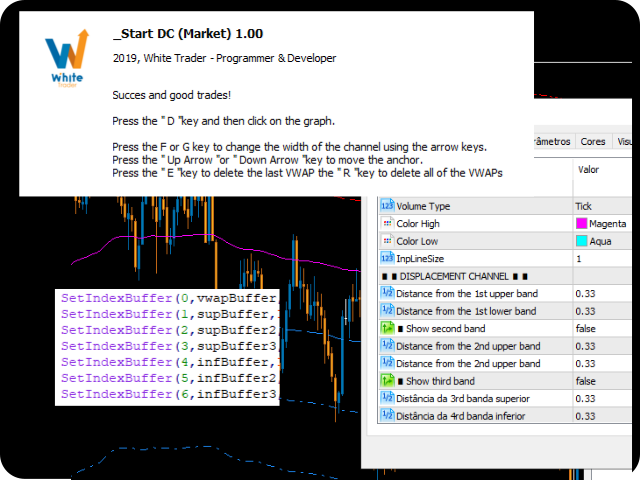
Volume type, Color High, Color Low e Line Size.
Although the parameters are digitizable, after having the indicator on the graph you start adjusting / correcting using the keyboard shortcuts which are:
Press the D key and then click on the graph.
Press the F or G key to change the width of the channel using the arrow keys.
Press the Up Arrow or Down Arrow key to move the anchor.
Press the E key to delete the last VWAP the R key to delete all of the VWAPs.


