Indicator Z Vertical Lines
- Индикаторы
- Clive Tyler
- Версия: 1.2
- Обновлено: 12 ноября 2022
- Активации: 5
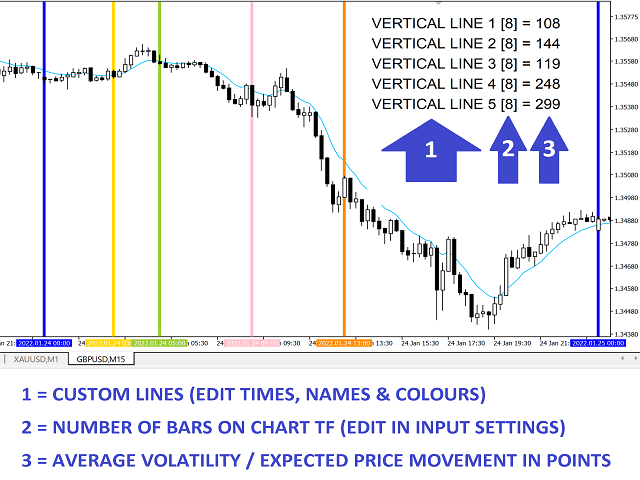
Allows you to find the average volatility / expected price movement for ANY custom period starting at ANY time of day. Simply set a vertical line at the desired entry time and calculate your TP target within the expected volatility range. Indicator places 5 custom vertical lines on chart at the same times each day throughout the history + gives live alerts with custom text each day.
1. Get the average price movement / volatility of ANY time period starting at each vertical line, so you know how much TP price movement to expect in any given period (5 lines = 5 custom volatility readings)
2. Visually check the historical chart at specific times of day (5 coloured lines per day with custom names)
3. Get live time alerts at each vertical line with your own custom alert text + the latest volatility notification
EXPECTED VOLATILITY = YOUR REAL TP TARGET !!
Many indicators give limited intra-day volatility readings like ADR or Average Session Ranges etc. but only INDICTAOR Z VERTCIAL LINES allows custom volatility readings for ANY custom-defined period at ANY time of day:
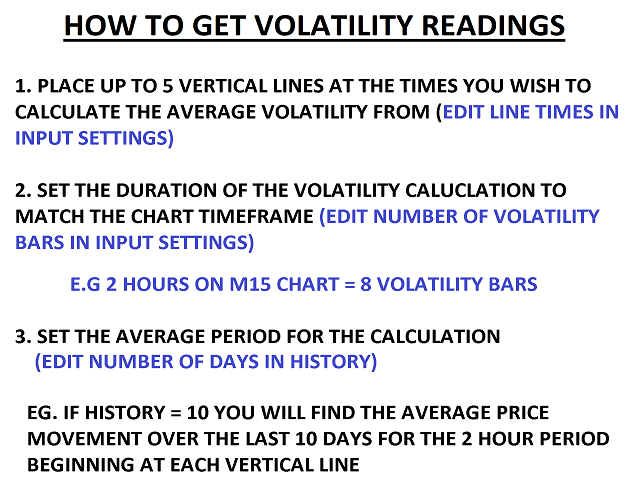
- The start time for each volatility period is defined by the VERTCIAL LINE TIME (e.g. 09.00)
- The duration of the volatility period is defined by X NUMBER OF BARS ON THE CHART TIME FRAME (e.g. 4 x M15 BARS = 1 HOUR)
- The average volatility is calculated over the NUMBER OF DAYS in the HISTORY (e.g. 10 DAY AVERAGE)
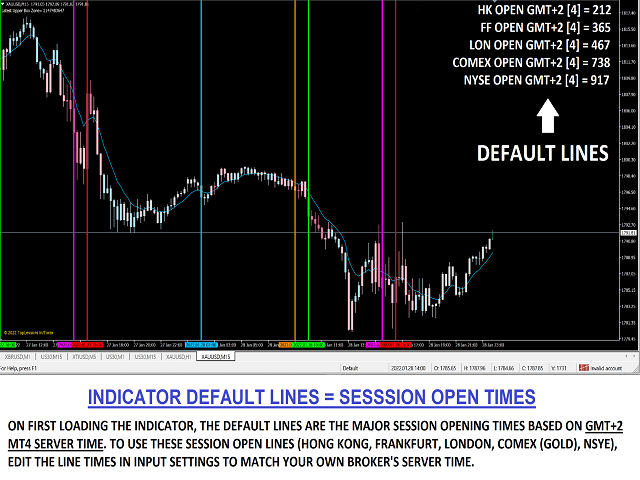
DEFAULT LINES = SESSION OPEN TIMES
The indicator default lines are the major SESSION OPEN times at GMT+2 (adjust to match your broker's MT4 SERVER TIME).
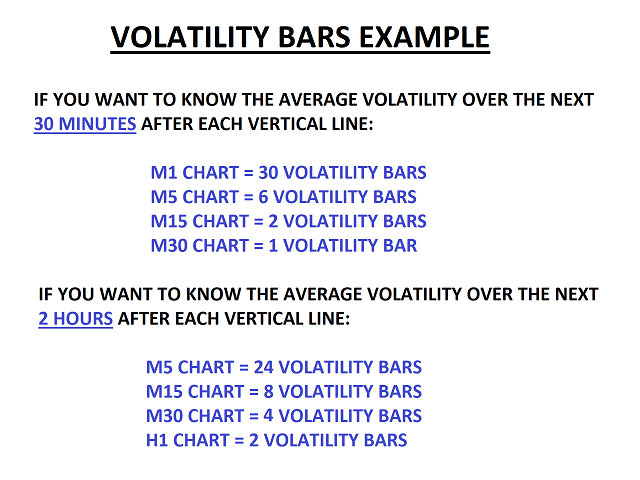
For example, if you want to know how far price moves during the first 30 minutes of each trading session, use the default lines for each Session Open, and edit the VOLATILITY BARS AFTER LINE input setting to match the required trading period to your chart timeframe e.g.
- 30 mins on M30 chart = 1 BAR
- 30 mins on M15 chart = 2 BARS
- 30 mins on M5 chart = 6 BARS
- 30 mins on M1 chart = 30 BARS
DEFAULT = 1 BAR so you can quickly get a volatility reading for different periods just by changing chart timeframe
Set the NUMBER OF DAYS in the HISTORY setting:
- If HISTORY setting = 10 then you get the average volatility over the last 10 days
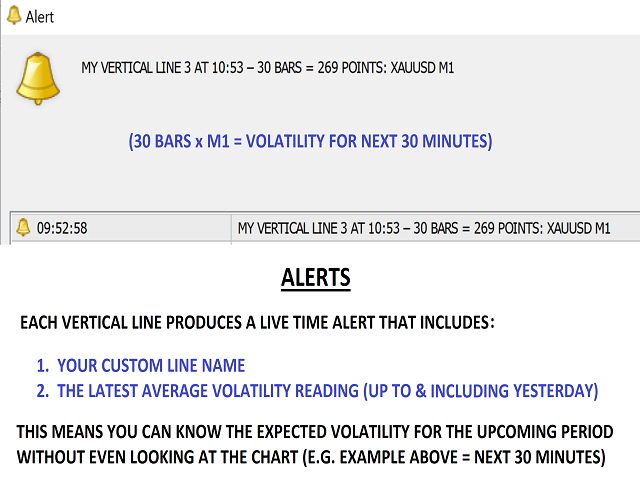
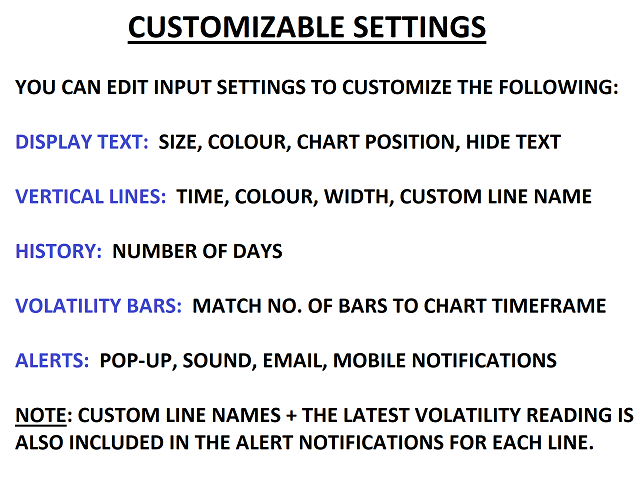
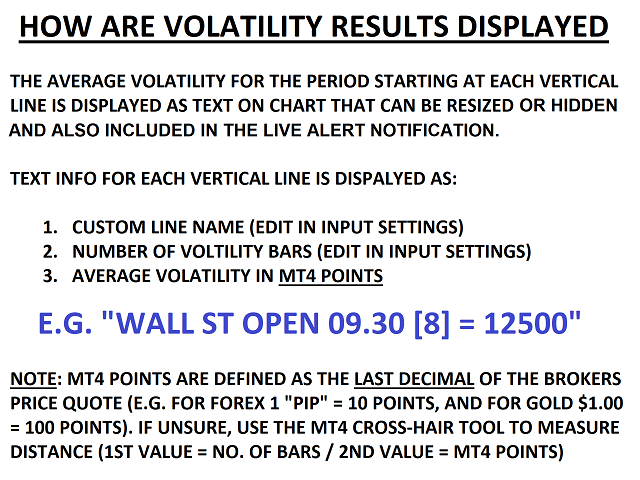
The average price volatility in MT4 Points for the first 30 minutes of each Session is displayed as text on chart, which you can move or hide, and it is also included in the live alert notifications for each vertical line, so you can know the expected volatility without even looking at the chart.
With up to 5 lines per day, you can compartmentalize the trading day into specific trading periods, and find the expected price movement for each period, which is very useful for setting realistic and achievable TP targets.
Use average volatility readings to safely lock in profits while you are away from your screen (e.g. asleep during Asia Session) or for momentum trades at the start of sessions etc. and hit safe TP targets because you know how much price movement to expect.
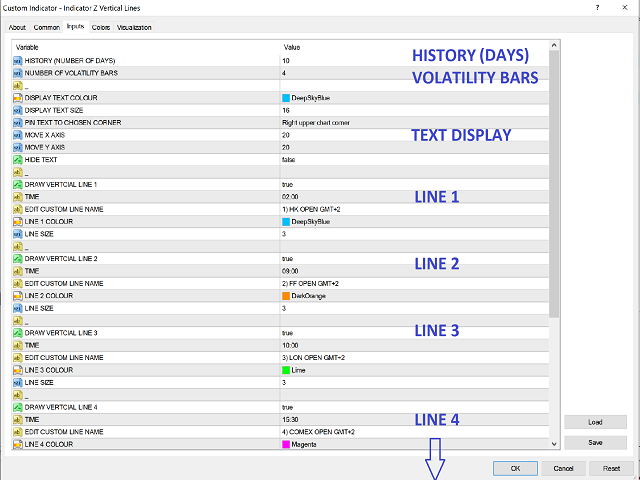
CUSTOM LINE COLOURS for easy reference to check historical price action and strategies at specific times each day, which saves much time & effort looking back through the charts.
CUSTOM LINE NAME to label each line with your own text e.g.
- "WALL ST OPEN 09.30"
Lines can also be used as alarm clocks (up to 5 LIVE ALERTS per day) to check the charts or monitor trades at specific times.
The LATEST TP VOLATILITY CALCULATION + your own CUSTOM LINE NAME text is included in the mobile notification e.g.
- "MY STRATGEY NAME
- "CHECK MY TRADE 15.00"
Useful if you have multiple trading strategies, or trades that need to be checked at certain times.
Manage all your alerts from one chart.
See Also
2. INDICATOR Z RECOVERY TRADING ZONE to profit in both directions during high volatility times, even if your 1st trade loses. Only 1 trade is open at any time = compliant hedging for US traders. Easy setup and risk controls for the additional trades.
3. INDICATOR Z PRO ENGULFING SCANNER to scan unlimited markets for high-probability STRONG ENGULFING and INSIDE REVERSAL patterns with professional pattern filters incl. Min/Max Price Levels, MA Cross, Range Breakout + live price alerts incl. Pullback, Continuation, and Invalidation. HTF + LTF SNIPER ALERT gives Lower Timeframe Patterns within a HTF Engulfing pattern for perfect sniper entries with small SL and high Reward:Risk (e.g. H4+M15 / H1+M5 / M15+M1)
