• Обзор
  • Отзывы
  • Обсуждение

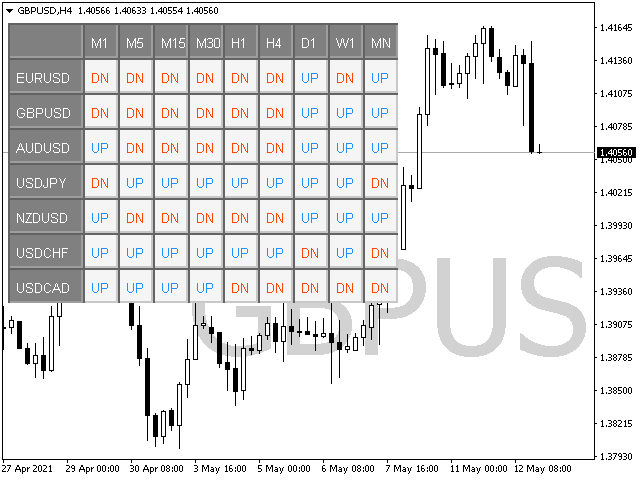
CMA dashboard

CMA dashboard is designed to help traders in identifying trend on multiple timeframes and symbols. It displays a clear state of the overall trend at one place without the need to navigate between different charts and timeframes. This saves time and makes decision making process fast so that potential opportunities are not missed.

It is based on Corrected moving averages available here

Features

  • Parameters for signal optimization
  • Inputs for multiple timeframes and symbols 

Usage

  • Higher timeframe bias can be used to find entries on lower timeframes
  • Multiple timeframes can be used to confirm strong up trend or down trend and retracement opportunities can be located with indicators such as RSI

Parameters

  • Period - Moving average period
  • Price - Raw price type from available 7 prices
  • Method - Averaging method
  • Signal change on slope change -  false = trend change on Ma and CMA cross, true = trend change on CMA slope change
  • Timeframes to show - Add or remove timeframes
  • Symbols to show from market watch - Add or remove symbols available in market watch

Рекомендуем также
Forex Gump
Andrey Kozak
2.4 (5)
Forex Gump - это полностью готовая полуавтоматическая торговая система. В виде стрелок на экран выводятся сигналы для открытия и закрытия сделок. Все, что вам нужно, это следовать указаниям индикатора. Когда индикатор показывает синюю стрелку, Вам нужно открывать ордер на покупку. Когда индикатор показывает красную стрелку, нужно открывать ордер на продажу. Закрываем ордера когда индикатор рисует желтый крестик. Для того, чтобы получить максимально эффективный результат, рекомендуем использовать
Master scalping M1 -инновационный индикатор, использующий алгоритм для быстрого и точного определения тренда.Индикатор рассчитывает время открытия и закрытия позиций, алгоритмы индикатора позволяют находить идеальные моменты для входа в сделку (покупки или продажи актива), повышающие успешность сделок у большинства трейдеров. Преимущества индикатора: Прост в использовании, не перегружает график не нужной информацией. Возможность использования  как фильтр для любой стратегии. Работает на рынке а
EZZ Elite Zig Zag is an indicator for the MetaTrader 4 terminal. This indicator traces the peak of the trend based on the market reversal, thus showing various opportunities in the financial market. EZZ Elite Zig Zag is a visual tool, intuitive, and easy to understand and use.  Test it Yourself by Downloading it for Free. Author Paulo Rocha all rights reserved
Представляем вашему вниманию индикатор "Счётчик закрытия свечи", который станет вашим незаменимым помощником в мире трейдинга. Вот почему знание того, когда свеча закроется, может помочь: Если вы любите торговать, используя свечные паттерны, то вы будете знать, когда свеча будет закрыта. Этот индикатор позволит вам проверить, сформировался ли известный шаблон и есть ли возможность торговли. Индикатор поможет вам подготовиться к открытию рынка и закрытию рынка. Вы можете установить таймер, чтобы
Индикаторы [ZhiBiCCI] подходят для всех циклов использования, а также подходят для всех разновидностей рынка. [ZhiBiCCI] Зеленая сплошная линия - разворот бычьей дивергенции. Зеленая пунктирная линия - классическая бычья дивергенция. [ZhiBiCCI] Сплошная линия к красному - обратная медвежья дивергенция. Красная пунктирная линия - классическая медвежья дивергенция. [ZhiBiCCI] можно установить в параметрах (Предупреждение, Отправить почту, Отправить уведомление), установить на (true) для отправк
The Sextet Scalper Pro  is an MT4 indicator that gives signals when new waves are starting in a trend. The trends are calculated using the original " The Sextet " indicator method. You get a free EA to trade with The Sextet Scalper Pro: Free EA . Default settings were optimized on GBPUSD H1 from 2017. EA could be tested on free demo version of The Sextet Scalper Pro, before purchase. Key Features: Uses The Sextet Trend Detection Method which is already a good strategy in itself for detecting lo
Fibonacci retracement and extension line drawing tool Fibonacci retracement and extended line drawing tool for MT4 platform is suitable for traders who use  golden section trading Advantages: There is no extra line, no too long line, and it is easy to observe and find trading opportunities Trial version: https://www.mql5.com/zh/market/product/35884 Main functions: 1. Multiple groups of Fibonacci turns can be drawn directly, and the relationship between important turning points can be seen
Это трендовый индикатор без перерисовки Разработан вместо стратегии бля бинарках опционов (по цвету свечи мартингейл) Так же хорошо работает в торговле на рынке форекс Когда открывать сделки ( бинарные опционы ) Сигнал появится в месте с свечой сигналит на текущую свечу  Открывать сделку стоит на одну свечу текущего таймфрейма рекомендуется м1 и М5 При появлении синей точки открываем сделку вверх При появлении красной точки открываем сделку в низ. Как открывать сделки на Форекс. При получени
Индикатор Point61 - результат многолетнего наблюдения за поведением цены валютных пар и металлов. Не секрет, что в моменты неопределенности трейдеры ищут возможные уровни поддержки и сопротивления - точки, где цена должна остановить движение. В этих точках возможны 2 сценария: 1. Разворот (коррекция) в обратную сторону; 2. Пробой для продолжения движения. Очень часто эти точки используются для установки стоп-ордеров - ТейкПрофит или СтопЛосс. И важно определять эти точки для максимизации прибыли
Stratos Pali Indicator   is a revolutionary tool designed to enhance your trading strategy by accurately identifying market trends. This sophisticated indicator uses a unique algorithm to generate a complete histogram, which records when the trend is Long or Short. When a trend reversal occurs, an arrow appears, indicating the new direction of the trend. Important Information Revealed Leave a review and contact me via mql5 message to receive My Top 5 set files for Stratos Pali at no cost! Dow
Crypto_Forex Indicator "Major Trend Correction Histogram" для MT4, без перерисовки. - Индикатор Major Trend Correction Histogram был разработан для обнаружения крупных трендов. - Индикатор может быть двух цветов: красный для медвежьего тренда и синий для бычьего (цвета можно менять). - Не менее 10 последовательных столбцов гистограммы одного цвета означают начало нового тренда. - Индикатор имеет встроенные оповещения для мобильных устройств и ПК. - Параметр "Period" отвечает за чувствительност
Коробка Ганна (или Квадрат Ганна) — метод анализа рынка по статье Уильяма Ганна «Математическая формула для предсказания рынка» (W.D. Gann "Mathematical formula for market predictions"). Этот индикатор может строить три модели Квадратов: 90, 52(104), 144. Шесть вариантов сеток и два варианта дуг. Вы можете построить, одновременно, несколько квадратов на одном графике. Параметры Square — выбор модели квадрата: 90 — квадрат 90 (или квадрат девяти); 52 (104) — квадрат 52 (или 104); 144 — универса
The Th3Eng PipFinite indicator is based on a very excellent analysis of the right trend direction with perfect custom algorithms. It show the true direction and the best point to start trading. With StopLoss point and Three Take Profit points. Also it show the right pivot of the price and small points to order to replace the dynamic support and resistance channel, Which surrounds the price. And Finally it draws a very helpful Box on the left side on the chart includes (take profits and Stop loss
Noize Absorption Index - is the manual trading system that measures the difference of pressure between bears forces and bulls forces. Green line - is a noize free index that showing curent situation. Zero value of index shows totally choppy/flat market.Values above zero level shows how powerfull bullish wave is and values below zero measures bearish forces.Up arrow appears on bearish market when it's ready to reverse, dn arrow appears on weak bullish market, as a result of reverse expectation. S
Уникальная мультивалютная авторская стратегия, одновременно определяющая силу трендов и точки входа в рынок, визуализируя это с помощью гистограмм на графике. Индикатор оптимально адаптирован для торговли на временных периодах М5, М15, М30, Н1. При этом для удобства пользователя по определенной точке всегда появляется точка входа (в виде стрелки), рекомендуемые уровни получения прибыли (TP1, TP2 с текстовыми метками) и рекомендация по установке Стоп Лосс. Уровни получения прибыли (TP1, TP2) авто
Alpha Trend
Evgeny Belyaev
3.33 (3)
Alpha Trend - это трендовый индикатор для платформы MT4, разработанный группой профессиональных трейдеров. Индикатор Alpha Trend находит наиболее вероятные точки разворота тенденции, что позволяет совершать сделки в самом начале тренда. Данный индикатор оснащён уведомлениями при появлении нового сигнала (алерт, почта, телефон), что поможет вам своевременно открыть позицию. Alpha Trend не перерисовывается, что дает возможность оценить его эффектность на истории. Версия  Alpha Trend для терминала
VR Cub
Vladimir Pastushak
VR Cub это индикатор что бы получать качественные точки входа. Индикатор разрабатывался с целью облегчить математические расчеты и упростить поиск точек входа в позицию. Торговая стратегия, для которой писался индикатор, уже много лет доказывает свою эффективность. Простота торговой стратегии является ее большим преимуществом, что позволяет успешно торговать по ней даже начинающим трейдерам. VR Cub рассчитывает точки открытия позиций и целевые уровни Take Profit и Stop Loss, что значительно повы
Super Reversal Pattern Indicator Unlock the power of advanced pattern recognition with our Super Reversal Pattern Indicator. Designed for traders seeking precision and reliability, this indicator identifies one of the most effective reversal patterns in technical analysis, offering a significant edge in your trading strategy. Key Features: Non-Repainting Accuracy: Enjoy the confidence of non-repainting technology. Once a Super Reversal Pattern is detected, it remains static, providing consiste
Heiken Ashi candle chart is an improved version of The Japanese candle chart, which can effectively filter the market "noise" of the Japanese candle chart. It is favored by many traders for its simplicity and intuition. For trend traders, the HA candle chart is a magic tool. Unlike the traditional Japanese candle chart, Heikenashi does not reflect the opening price, high price, low price and closing price of the market. Instead, Heikenashi calculates the value of a single K line in the dominant
Trade with Gann on your side!! MASTER CIRCLE 360 CIRCLE CHART, originally created by Gann admitted that this is “The Mother of all charts”. It is one of the last studies that this great trader left for us. The numeric tab le is apparently quite simple like all the tables and is based on square numbers, the SQUARE OF 12 and is by evolution, one of the most important square numbers. Here we can find CYCLE, PRICE AND TIME thanks to angles and grades, to show past and future support and resistance.
Индикатор тренда Riko Trend - революционное решение для торговли по трендам и фильтрации со всеми важными функциями инструмента тренда, встроенными в один инструмент! Индикатор Riko Trend хорош для любого трейдера, подойдет любому трейдеру как для форекс так и для бинарных опционов. Ничего настраивать не нужно все отточено времинем и опытом, отлично работает на во время флета та и в тренде. Индикатор тренда Riko Trend это инструмент технического анализа финансовых рынков, отражающий текущие от
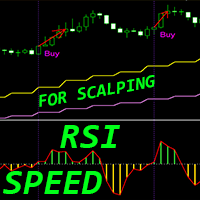
Индикатор Crypto_Forex "RSI SPEED" для MT4 - отличный предиктивный инструмент, без перерисовки. - Расчет этого индикатора основан на уравнениях из физики. RSI SPEED - это 1-я производная самого RSI. - RSI SPEED хорош для скальпинговых входов в направлении основного тренда. - Используйте его в сочетании с подходящим трендовым индикатором, например, HTF MA (как на картинках). - Индикатор RSI SPEED показывает, как быстро сам RSI меняет свое направление - он очень чувствителен. - Рекомендуется исп
To get access to MT5 version please click here . - This is the exact conversion from TradingView: "Stochastic Momentum Index" By "UCSgears". - This is a popular version of stochastic oscillator on tradingview. - This is a light-load processing and non-repaint indicator. - Buffers are available for the lines on chart. - You can message in private chat for further changes you need. Thanks for downloading
Индикатор отображает на графике данные стохастик-осцилятора более старшего временного интервала. Основная и сигнальная линии отображаются в дополнительном окне. Ступенчатая характеристика не сглажена. Индикатор удобен для отработки "ручных" стратегий форекс-торговли, использующих данные от нескольких экранов с различными временными интервалами одного инструмента. В индикаторе используются настройки, аналогичные стандартному и выпадающий список для выбора тайм-фрейма. Параметры индикатора TimeFr
Индикатор RTrends делает две вещи: во-первых, производит автоматическую (на лету) разметку графика цены путем нанесения линий трендов и, во-вторых, дает медвежьи и бычьи сигналы. Разметка отражает фрактальную природу рынка. На график одновременно наносятся тренды с разных временных горизонтов. Таким образом, трейдер, имея перед глазами только один график, может видеть линии трендов со старших таймфреймов. Линии, в зависимости от горизонта, различаются по цвету и толщине: чем старше горизонт, тем
Secret Liquidity Zones Indicator User Manual Introduction Unlock the power of hidden market opportunities with the Secret Liquidity Zones Indicator . This cutting‐edge tool is designed to reveal critical price levels where market momentum may shift. With its dynamic adaptability and sleek gold visuals, it offers clear and elegant insights into key trading opportunities—making it the perfect secret weapon for traders who demand precision and clarity. Key Features Dynamic Timeframe Adaptation: A
Are you tired of the uncertainty that arises when your orders fail to stop at a specific line due to the spread? Look no further! Introducing our  indicator that plots candlesticks based on the Ask price instead of the traditional bid-based chart commonly used in MQL4. With this indicator, you can say goodbye to the frustrations caused by the bid-based chart, as it provides you with a more accurate representation of market movements. By utilizing the Ask price, which represents the price at whic
Gvs Undefeated Trend   indicator is designed for trend and signal trading. This indicator generates trend signals.  It uses many algorithms and indicators to generate this signal. It tries to generate a signal from the points with the highest trend potential. This indicator is a complete trading product. This indicator does not need any additional indicators.  You can only trade with this indicator. The generated signals are displayed on the graphical screen.  Thanks to the alert features you ca
Способ применения Pair Trading Station Рекомендуется использовать Pair Trading Station на таймфрейме H1 с любой валютной парой. Чтобы получить сигналы на покупку и продажу, следуйте указанным ниже инструкциям по применению Pair Trading Station в терминале MetaTrader. При загрузке Pair Trading Station на график индикатор оценит доступные исторические данные на вашей платформе MetaTrader для каждой валютной пары. В самой начале на графике отобразятся исторические данные, доступные для каждой валют
Trend Oscillator — это продвинутый пользовательский индикатор Crypto_Forex, эффективный торговый инструмент! - Используется новый продвинутый метод расчета — 20 вариантов параметра «Цена для расчета». - Самый плавный осциллятор из когда-либо созданных. - Зеленый цвет для восходящих трендов, красный цвет для нисходящих трендов. - Значения перепроданности: ниже 5, значения перекупленности: выше 95. - С этим индикатором есть множество возможностей для модернизации даже стандартных стратегий. - С
С этим продуктом покупают
Gann Made Easy - это профессиональная, но при этом очень простая в применении Форекс система, основанная на лучших принципах торговли по методам господина У.Д. Ганна. Индикатор дает точные BUY/SELL сигналы, включающие в себя уровни Stop Loss и Take Profit. Пожалуйста, напишите мне после покупки! Я поделюсь своими рекомендациями по использованию индикатора. Также вас ждет отличный бонусный индикатор в подарок! Вероятно вы уже не раз слышали о торговли по методам Ганна. Как правило теория Ганна от
NOTE: CYCLEMAESTRO is distributed only on this website, there are no other distributors. Demo version is for reference only and is not supported. Full versione is perfectly functional and it is supported CYCLEMAESTRO , the first and only indicator of Cyclic Analysis, useful for giving signals of TRADING, BUY, SELL, STOP LOSS, ADDING. Created on the logic of Serghei Istrati and programmed by Stefano Frisetti ; CYCLEMAESTRO is not an indicator like the others, the challenge was to interpret only t
Инновационный индикатор, использующий эксклюзивный алгоритм для быстрого и точного определения тренда. Индикатор автоматически рассчитывает время открытия и закрытия позиций, а также подробную статистику работы индикатора на заданном отрезке истории, что позволяет выбрать наилучший торговый инструмент для торговли. Вы также можете подключить свои пользовательские стрелочные индикаторы к Scalper Inside Pro для проверки и расчета их статистики и прибыльности. Инструкция и настройки: Читать... Осно
Gold Stuff
Vasiliy Strukov
4.86 (257)
Gold Stuff - трендовый индикатор, разработанный специально для золота, также может использоваться на любых финансовых инструментах. Индикатор не перерисовывается и не запаздывает. Рекомендуемый тайм-фрейм H1.  По данному индикатору написан советник EA Gold Stuff, Вы можете найти его в моем профиле. Свяжитесь со мной сразу после покупки для получения   персонального бонуса!  Вы можете получить бесплатную копию нашего индикатора Strong Support and Trend Scanner, пожалуйста, в личку. мне! Настройки
В настоящее время скидка 20%! Лучшее решение для новичка или трейдера-эксперта! Эта приборная панель работает на 28 валютных парах. Он основан на 2 наших основных индикаторах (Advanced Currency Strength 28 и Advanced Currency Impulse). Он дает отличный обзор всего рынка Forex. Он показывает значения Advanced Currency Strength, скорость движения валюты и сигналы для 28 пар Forex на всех (9) таймфреймах. Представьте, как улучшится ваша торговля, когда вы сможете наблюдать за всем рынком с помощ
Внутридневная стратегия, основанная на двух фундаментальных принципах рынка. В основе алгоритма лежит анализ объемов и ценовых волн с применением дополнительных фильтров. Интеллектуальный алгоритм индикатора дает сигнал только тогда, когда два рыночных фактора объединяются в одно целое. Индикатор рассчитывает волны определенного диапазона, а уже для подтверждения волны индикатор использует анализ по объемам. Данный индикатор - это готовая торговая система. Все что нужно от трейдера - следовать с
Golden Trend Indicator
Noha Mohamed Fathy Younes Badr
5 (10)
Golden Trend indicator  is The best indicator for predicting trend movement this indicator never lags and never repaints and never back paints    and give  arrow buy and sell    before the candle appear  and it will help you and  will make your trading decisions clearer its work on all currencies and  gold and crypto and all time frame This unique  indicator uses very secret algorithms to catch the  trends, so you can trade using this indicator and see the trend clear on charts  manual guide and
Trend Screener
STE S.S.COMPANY
4.78 (93)
Индикатор тренда, революционное уникальное решение для торговли и фильтрации тренда со всеми важными функциями тренда, встроенными в один инструмент! Это 100% неперерисовывающийся мультитаймфреймный и мультивалютный индикатор, который можно использовать на всех инструментах/инструментах: форекс, товары, криптовалюты, индексы, акции. ПРЕДЛОЖЕНИЕ ОГРАНИЧЕННОГО ВРЕМЕНИ: Индикатор скринера поддержки и сопротивления доступен всего за 50$ и бессрочно. (Изначальная цена 250$) (предложение продлено) Tre
GOLD Impulse with Alert
Bernhard Schweigert
4.6 (10)
Этот индикатор является супер комбинацией двух наших продуктов Advanced Currency IMPULSE with ALERT  +   Currency Strength Exotics . Он работает на всех временных рамках и графически показывает импульс силы или слабости для 8 основных валют плюс один символ! Этот индикатор специализирован для отображения ускорения силы валюты для любых символов, таких как золото, экзотические пары, товары, индексы или фьючерсы. Первый в своем роде, любой символ может быть добавлен в 9-ю строку, чтобы показат
PUMPING STATION – Ваша персональная стратегия "всё включено" Представляем PUMPING STATION — революционный индикатор Forex, который превратит вашу торговлю в увлекательный и эффективный процесс! Это не просто помощник, а полноценная торговая система с мощными алгоритмами, которые помогут вам начать торговать более стабильно! При покупке этого продукта вы БЕСПЛАТНО получаете: Эксклюзивные Set-файлы: Для автоматической настройки и максимальной эффективности. Пошаговое видео-руководство: Научитесь т
Enigmera
Ivan Stefanov
5 (7)
ENIGMERA: Основы рынка Важно: демо-версия на MQL5.com работает в Strategy Tester и может не полностью отображать функциональность Enigmera. Ознакомьтесь с описанием, скриншотами и видео для подробной информации. Не стесняйтесь обращаться с вопросами! Код индикатора был полностью переписан. Версия 3.0 добавляет новые функции и устраняет ошибки, накопившиеся с момента появления индикатора. Введение Этот индикатор и торговая система представляет собой уникальный подход к финансовым рынкам. ENIGMER
Это, пожалуй, самый полный индикатор автоматического распознавания гармонического ценообразования, который вы можете найти для платформы MetaTrader. Он обнаруживает 19 различных паттернов, воспринимает проекции Фибоначчи так же серьезно, как и вы, отображает зону потенциального разворота (PRZ) и находит подходящие уровни стоп-лосс и тейк-профит. [ Руководство по установке | Руководство по обновлению | Устранение неполадок | FAQ | Все продукты ] Он обнаруживает 19 различных гармонических ценов
TPSproTREND PrO
Roman Podpora
4.68 (25)
Точки входа по закрытию бара,   без перерисовки .  Сканер трендов   по всем активам,   режим MTF  и многое другое в одном инструменте. Рекомендуем использовать вместе с   RFI LEVELS. ИНСТРУКЦИЯ RUS   /   INSTRUCTIONS  ENG         /      VERSION MT5     Основные функции: Точные сигналы на вход БЕЗ ПЕРЕРИСОВКИ! Если сигнал появился, он остается актуальным! Это важное отличие от индикаторов с перерисовкой, которые могут предоставить сигнал, а затем изменить его, что может привести к потере средств
After your purchase, feel free to contact me for more details on how to receive a bonus indicator called VFI, which pairs perfectly with Easy Breakout for enhanced confluence!   Easy Breakout is a powerful price action trading system built on one of the most popular and widely trusted strategies among traders: the Breakout strategy ! This indicator delivers crystal-clear Buy and Sell signals based on breakouts from key support and resistance zones. Unlike typical breakout indicators, it levera
Dynamic Forex28 Navigator — инструмент для торговли на рынке Форекс нового поколения. В НАСТОЯЩЕЕ ВРЕМЯ СКИДКА 49%. Dynamic Forex28 Navigator — это эволюция наших популярных индикаторов, объединяющая мощь трех в одном: Advanced Currency Strength28 Indicator (695 отзывов) + Advanced Currency IMPULSE with ALERT (520 отзывов) + CS28 Combo Signals (бонус). Подробности об индикаторе https://www.mql5.com/en/blogs/post/758844 Что предлагает индикатор Strength нового поколения?  Все, что вам нравило
IX Power MT4
Daniel Stein
4.78 (9)
IX Power: Получите рыночные инсайты для индексов, сырьевых товаров, криптовалют и форекс Обзор IX Power — это универсальный инструмент для анализа силы индексов, сырьевых товаров, криптовалют и форекс. В то время как FX Power предлагает наивысшую точность для валютных пар, используя данные всех доступных пар, IX Power фокусируется исключительно на данных рынка базового символа. Это делает IX Power отличным выбором для некорреляционных рынков и надежным инструментом для форекса, если вам не нуж
Scalper Vault — это профессиональная торговая система, которая дает вам все необходимое для успешного скальпинга. Этот индикатор представляет собой полную торговую систему, которую могут использовать трейдеры форекс и бинарных опционов. Рекомендуемый тайм фрейм М5. Система дает точные стрелочные сигналы в направлении тренда. Она также предоставляет вам сигналы выхода и рассчитывает рыночные уровни Ганна. Индикатор дает все типы оповещений, включая PUSH-уведомления. Пожалуйста, напишите мне после
Руководство пользователя + Обучающие видео + Доступ к приватному Discord-каналу + VIP-статус и мобильная версия + Лицензия на 5 ПК с неограниченным количеством аккаунтов и терминалов MT4. Сколько раз вы покупали индикатор торговли с замечательными обратными тестами, доказательствами производительности на живых счетах и зашикарными цифрами и статистикой, но после использования на своем счете вы оказываетесь с пустым счетом? Не следует доверять сигналу в отрыве от контекста, вам нужно знать, поч
- Real price is 80$ - 40% Discount (It is 49$ now) - Lifetime update free Contact me for instruction, add group and any questions! Related Products:  Bitcoin Expert , Gold Expert - Non-repaint - I just sell my products in Elif Kaya profile, any other websites are stolen old versions, So no any new updates or support. Introduction The breakout and retest strategy is traded support and resistance levels. it involves price breaking through a previous level.  The break and retest strategy is design
Advanced Supply Demand
Bernhard Schweigert
4.91 (294)
Этот индикатор является уникальным, качественным и доступным инструментом для торговли, включающим в себя наши собственные разработки и новую формулу. В обновленной версии появилась возможность отображать зоны двух таймфреймов. Это означает, что вам будут доступны зоны не только на старшем ТФ, а сразу с двух таймфреймов - таймфрейма графика и старшего: отображение вложенных зон. Обновление обязательно понравится всем трейдерам, торгующим по зонам спроса и предложения. Важная информация Для макс
Ищете мощный индикатор для торговли на рынке Форекс, который поможет вам с легкостью определить прибыльные торговые возможности? Не ищите ничего, кроме Beast Super Signal. Этот простой в использовании индикатор, основанный на тренде, постоянно отслеживает рыночные условия, ищет новые развивающиеся тренды или отслеживает уже существующие. Beast Super Signal дает сигнал на покупку или продажу, когда все внутренние стратегии совпадают и на 100% совпадают друг с другом, что устраняет необходимость в
FX Power: Анализируйте силу валют для более эффективной торговли Обзор FX Power — это ваш незаменимый инструмент для понимания реальной силы валют и золота в любых рыночных условиях. Определяя сильные валюты для покупки и слабые для продажи, FX Power упрощает принятие торговых решений и выявляет высоковероятные возможности. Независимо от того, хотите ли вы следовать за трендами или предсказывать развороты с использованием экстремальных значений дельты, этот инструмент идеально адаптируется под
KT Renko Patterns MT4
KEENBASE SOFTWARE SOLUTIONS
2.33 (3)
KT Renko Patterns анализирует график Ренко кирпич за кирпичиком, чтобы найти известные графические паттерны, которые часто используют трейдеры на различных финансовых рынках. По сравнению с графиками на основе времени, торговля по паттернам на графиках Ренко легче и нагляднее благодаря их чистому виду. KT Renko Patterns включает несколько паттернов Ренко, многие из которых подробно описаны в книге «Профитная торговля с графиками Ренко» авторства Прашанта Шаха. Полностью автоматизированный сове
Представляем       Quantum Breakout PRO   , новаторский индикатор MQL5, который меняет ваш способ торговли в зонах прорыва! Разработанная командой опытных трейдеров с опытом торговли более 13 лет,   Quantum Breakout PRO   предназначена для того, чтобы вывести ваше торговое путешествие на новые высоты благодаря своей инновационной и динамичной стратегии зон прорыва. Quantum Breakout Indicator покажет вам сигнальные стрелки на зонах прорыва с 5 целевыми зонами прибыли и предложением стоп-лосса
MTF Supply Demand Zones
Georgios Kalomoiropoulos
4.82 (22)
Следующее поколение автоматизированных зон спроса и предложения. Новый инновационный алгоритм, работающий на любом графике. Все зоны создаются динамически в соответствии с ценовым действием рынка. ДВА ТИПА СИГНАЛОВ --> 1) ПРИ ПОПАДАНИИ ЦЕНЫ В ЗОНУ 2) ПРИ ФОРМИРОВАНИИ НОВОЙ ЗОНЫ Вы не получите еще один бесполезный индикатор. Вы получаете полную торговую стратегию с проверенными результатами.     Новые особенности:     Оповещения, когда цена достигает зоны спроса/предложения     Оповещения
FX Levels: Исключительно точные уровни поддержки и сопротивления для всех рынков Краткий обзор Ищете надежный способ определить уровни поддержки и сопротивления для любых инструментов—валют, индексов, акций или сырьевых товаров? FX Levels сочетает традиционный «Lighthouse» метод с современным динамическим подходом, обеспечивая почти универсальную точность. Благодаря сочетанию опыта реальных брокеров и автоматических ежедневных плюс «в реальном времени» обновлений, FX Levels поможет вам выявлят
Попробуйте "Chart Patterns All in One" в режиме демо и получите бонус. Отправьте мне сообщение после тестирования в режиме демо, чтобы получить бонус. Оставьте комментарий после покупки, чтобы получить 8 высококачественных индикатора в качестве бонуса. Индикатор Chart Patterns All-in-One помогает трейдерам визуализировать различные графические модели, которые широко используются в техническом анализе. Он помогает определить возможное поведение рынка, но не гарантирует прибыльность. Рекомендуетс
Apollo Secret Trend — это профессиональный индикатор тренда, который можно использовать для поиска трендов на любой паре и тайм фрейме. Индикатор может легко стать вашим основным торговым индикатором, который вы можете использовать для определения рыночных тенденций, независимо от того, какую пару или временной интервал вы предпочитаете торговать. Используя специальный параметр в индикаторе, вы можете адаптировать сигналы к своему личному стилю торговли. Индикатор предоставляет все типы оповещен
Reversal Master
Alexey Minkov
4.92 (13)
Reversal Master – индикатор для определения текущего направления движения цены и разворотных точек. Индикатор будет полезен для тех, кто хочет лучше видеть текущую ситуацию на рынке. Индикатор может использоваться как в качестве дополнения для уже готовых торговых систем, так и в качестве самостоятельного инструмента, или разработки своих собственных торговых систем. Для определения разворотных точек индикатор Reversal Master анализирует множество условий, так как совокупный анализ дает более то
FX Volume
Daniel Stein
4.6 (35)
FX Volume: Оцените подлинную динамику рынка глазами брокера Краткий обзор Хотите вывести свою торговлю на новый уровень? FX Volume дает вам информацию в реальном времени о том, как розничные трейдеры и брокеры распределяют свои позиции — задолго до появления запаздывающих отчетов типа COT. Независимо от того, стремитесь ли вы к стабильной прибыли или ищете дополнительное преимущество на рынке, FX Volume поможет выявлять крупные дисбалансы, подтверждать пробои и совершенствовать управление риск
Другие продукты этого автора
Informative & optimized Zigzag, Accumulated volume, Price change   A rewrite of the traditional zigzag tool with new additions. Features:- Optimized code Displays accumulated volume between peaks Displays price change between peaks Usage:- Identify trend swings Identify high volume swings Compare price changes between swings Drawing Fibonacci tool on strong price change or high volume swings
FREE
The indicator builds a Renko chart in the sub window for the current symbol. The bars are formed from live data and the desired bar size can be set in the inputs tab. Most importantly, because the Renko chart only uses price to construct bars and ignores time, the indicator can be applied to any time frame and same results can be achieved. Recommended usage As Renko charts are famous for eliminating noise so traders can use this tool to see clear picture of the trend to help their analysis, entr
FREE
ADR Bands
Navdeep Singh
4.5 (2)
Average daily range, Projection levels, Multi time-frame ADR bands shows levels based on the selected time-frame. Levels can be used as projections for potential targets, breakouts or reversals depending on the context in which the tool is used. Features:- Multi time-frame(default = daily) Two coloring modes(trend based or zone based) Color transparency  
FREE
50+ Candlestick Patterns, Simulated Trading Results, Top Five Performers Candle Analysis extends Candlesticks Pattern Analysis by not only identifying Patterns but also recording the Past Performance of the Patterns. What it Does:- Identifies and plots results on chart Displays Top Patterns for both Bullish and Bearish type.  Log can be printed in experts tab to see Simulated Trading results Displays All or Selected Patterns Alerts on Pattern formation More detailed information in   Blog
IBB Candles is a tool that is based on the concept of Inverse Bollinger Bands. It compares price relative to state of the bands and plots candles with different colors defining the current state of the market i.e range | trend | strong trend. As the name suggests IBB(Inverse Bollinger Bands) is a technique which is completely different from the traditional Bollinger Bands and proves to be much more effective in analyzing market. This personal implementation makes this tool a more reliable option
RSI Scanner, Multiple Symbols and Timeframes, Graphical User Interface An indicator that scans multiple symbols added from the market watch and timeframes and displays result in a graphical panel. Features: Multi symbol Multi timeframe Alerts and Notifications Live Monitoring Sorting modes One click to change symbol and timeframe Inputs for RSI and scanner settings
FREE
RSI Scanner, Multiple Symbols and Timeframes, Graphical User Interface An indicator that scans multiple symbols added from the market watch and timeframes and displays result in a graphical panel. Features: Multi symbol Multi timeframe Alerts and Notifications Live Monitoring Sorting modes One click to change symbol and timeframe Inputs for RSI and scanner settings

FREE
Algorithmic Signals indicator   is not an indicator but a strategy that generates entry/exit signals. The entry arrows are formed after multiple conditions are met. The indicator is using an   Adaptive Algorithm   which automatically adjust to the symbol and time frame (see the screenshots below) . Signals can be used for scalping or even trend trading. Main features:- Non repainting signals Entry signals Exit signals Alert for price reaching 1 x ATR(14) (could be utilized for initial take prof
Stochastic force is an advanced version of the stochastic oscillator. Instead of using the regular price a more efficient price data is provided as an input for the oscillator which takes into account the price efficiency, volume and market noise. Also price is pre-filtered with the selected average type and then post-filtered by a hull moving average which provides a smooth transition of the oscillator. It eliminates maximum false signals and has the potential to become an integral part of any
This is the new version of the Algorithmic signals featuring a new algorithm. It is a blend of technical and candlestick analysis. Candlestick analysis are often ignored while creating technical strategies but this version has a feature to include that and make confirmations more strong.  Usage:- Traders can use the signals for buying and selling assets or even blend their own favorite indicators with it.
TDI Signals generates buy and sell arrows based on a TDI(Traders Dynamic Index) algorithm. It looks for price breakouts, continuations and reversals. By default it runs in the trend mode but user is provided with the option to change that to reversal mode. Trader can use the mode which compliments his/her trading style.  Usage:-   TDI Signals can be used as a stand alone indicator with context or even be added to strategies to make confirmations more strong. Volatility based stop loss, take pro
RSI Levels generates buy and sell arrows based on RSI analysis. Signals are based on extreme levels breakouts and can be further filtered by a volatility metric. Trader can use the mode which compliments his/her trading style.  Features:- Parameters for signal optimization and alerts. Usage:-   RSI Levels can be used as a stand alone indicator with context or even be added to strategies to make confirmations more strong. Volatility based stop loss, take profit & position sizing can be very helpf
The indicator helps the trader in identifying potential liquidity levels. The algorithm used in this indicator checks the behavior of the asset taking into account the price levels, momentum and volume analysis. Features:- Parameters for signal optimization and alerts. Usage:- The levels formed by the indicator can be helpful to traders in identifying potential entries, breakouts or reversals. it can assist traders of technical trading background or even pure price action trading. Examples of
Step force index is a modified version of the famous force index indicator. As the name suggests it incorporates a step feature to filter the force index values thus eliminating small fluctuations in the indicator. It also utilizes the smooth algorithm library thereby providing multiple smoothing options for the index values. This personal implementation makes it a more easy to use and a reliable tool. Main features A wide range of parameters for signals optimization Alerts, emails and push noti
Market structures, Market balance, Range breakouts This tools helps to identify areas of market ranges, structures and plots colored boxes on breakout of those areas. User is given the option to receive alerts and notifications on the formation of the blocks. The tool has the ability to become an essential part of a technical trading system or even pure price action trading. Usage:- An essential tool for price action or technical traders.  More information in the blog
Horizontal volume bars, Cluster analysis, Volume profile Volume in Range gets information about the accumulated volume in a specified vertical range and period in bars. The received data is then plotted on the chart as rectangular boxes with the volume quantity inside. Usage:- The tool acts as a support resistance levels but most importantly it should be used to check in which direction the price breaks out of the significant levels formed by this indicator and then actions to be taken on correc
This utility is specifically designed for No Nonsense Forex traders. What it does:- Let traders add or remove symbols to trade Editable boxes in panel for updating inputs Automatically applies money management to the trades Places all orders with a single click  How it calculates:- Two trades are opened per symbol By default max risk per trade is 1% By default total risk is 6% which can changed in inputs tab(recommended to keep it 6 or below)  On addition of symbols the total risk will be divide
Price breakouts, Levels, Multi-time frame Inside bars checks for price failure to break from the previous high/low and on breakout draws a breakout box on the chart. The choice of breakout price is given to the user i.e. close or high/low of bar. Alerts can be received on breakouts. Features:- Multi-time frame Alerts, notifications & emails Usage:- Breakout signals Check how price action is evolving with the help of boxes Get multi-time frame bias
Market Fractal Analysis, Fractal Swing, Market Flow Fractal Cycles looks for Similar Patterns in the Market that repeat themselves because of the Market Fractal Nature. These patterns are displayed with help of Graphical Objects and Alerts can be received on their arrival. Read the Blog for full information. Features:- Auto Detection of Patterns Customization for Color and Line Styles Alerts, Emails & Push Notifications 
50+ Candlestick Patterns, Simulated Trading Results, Top Five Performers Candle Analysis extends Candlesticks Pattern Analysis by not only identifying Patterns but also recording the Past Performance of the Patterns. What it Does:- Identifies and plots results on chart Displays Top Patterns for both Bullish and Bearish type.  Log can be printed in experts tab to see Simulated Trading results Displays All or Selected Patterns Alerts on Pattern formation More detailed information in Blog
Stochastic force is an advanced version of the stochastic oscillator. Instead of using the regular price a more efficient price data is provided as an input for the oscillator which takes into account the price efficiency, volume and market noise. Also price is pre-filtered with the selected average type and then post-filtered by a hull moving average which provides a smooth transition of the oscillator. It eliminates maximum false signals and has the potential to become an integral part of any
The indicator helps the trader in identifying potential liquidity levels. The algorithm used in this indicator checks the behavior of the asset taking into account the price levels, momentum and volume analysis. Features:- Parameters for signal optimization and alerts. Usage:- The levels formed by the indicator can be helpful to traders in identifying potential entries, breakouts or reversals. it can assist traders of technical trading background or even pure price action trading.
IBB Candles is a tool that is based on the concept of Inverse Bollinger Bands. It compares price relative to state of the bands and plots candles with different colors defining the current state of the market i.e range | trend | strong trend. As the name suggests IBB(Inverse Bollinger Bands) is a technique which is completely different from the traditional Bollinger Bands and proves to be much more effective in analyzing market. This personal implementation makes this tool a more reliable optio
Horizontal volume bars, Cluster analysis, Volume profile Volume in Range gets information about the accumulated volume in a specified vertical range and period in bars. The received data is then plotted on the chart as rectangular boxes with the volume quantity inside. Usage:- The tool acts as a support resistance levels but most importantly it should be used to check in which direction the price breaks out of the significant levels formed by this indicator and then actions to be taken on correc
Market structures, Market balance, Range breakouts This tools helps to identify areas of market ranges, structures and plots colored boxes on breakout of those areas. User is given the option to receive alerts and notifications on the formation of the blocks. The tool has the ability to become an essential part of a technical trading system or even pure price action trading. Usage:- An essential tool for price action or technical traders.  More information in the blog
Market Fractal Analysis, Fractal Swing, Market Flow Fractal Cycles looks for Similar Patterns in the Market that repeat themselves because of the Market Fractal Nature. These patterns are displayed with help of Graphical Objects and Alerts can be received on their arrival. Read the   Blog   for full information. Features:- Auto Detection of Patterns Customization for Color and Line Styles Alerts, Emails & Push Notifications
The indicator is designed to detect range market or consolidation areas on the chart. It does this by using the market volatility and price momentum. The indicator signals the start and stop of the range with icons on the chart and various  type of alerts options provided in the input settings. Usage: The indicator can be used to check the state of the market i.e. trending or ranging to make appropriate decision and use strategies designed for specific market state. Please see the attached video
Фильтр:
Нет отзывов
Ответ на отзыв