• Обзор
  • Отзывы
  • Обсуждение
  • Что нового

Better Volume OnOff MT4

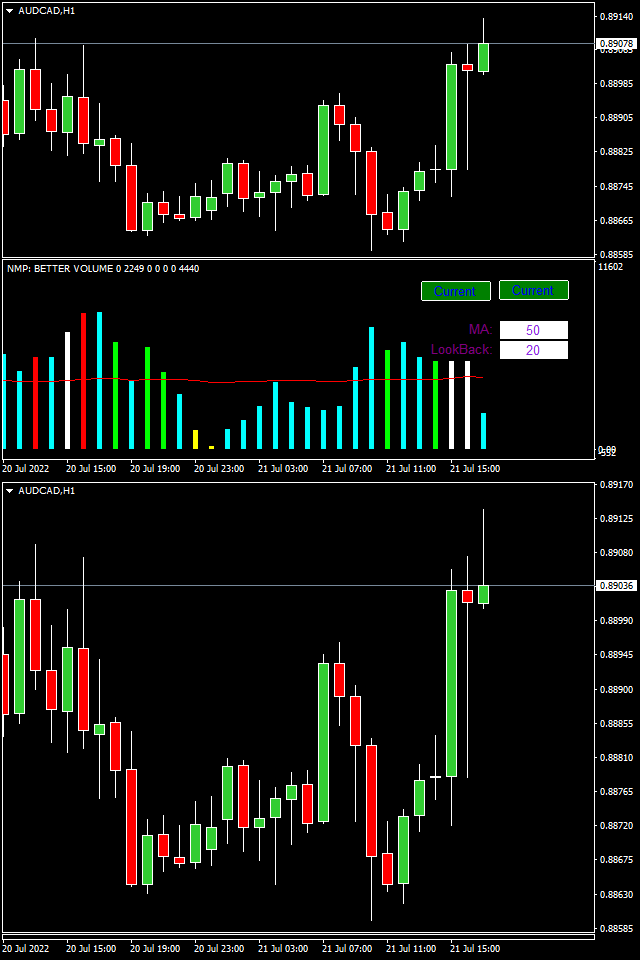
The Better Volume indictator improves the comprehension on volume by coloring the classical histogram bars. The colors point out differents nature of volume. Further through two buttons and without change the main chart it is possibile to change the time frames and navigate among three symbols. The alerts will work accordingly. For each symbol can be  choosed the LookBack and Ma periods. The possibility to show/hide the indicator allows you to focus on the price.


The subwindow can be hided with a botton or using the key of the keyboard. The default keys are: numPad 1 ON -  numPad 2 OFF

You can customize the button to switch the indicator with 3 symbols. The default are: 'EURUSD', 'GBPUSD', 'USDJPY. The label 'Current' let you use the indicator normally.

You can setup the LookBack and Ma periods for each time frames of three custom symbols. The default value for these symbols and 'Current' value are: LookBack=20 and Ma periods=50

These customizations will be lost by uninstalling the indicator

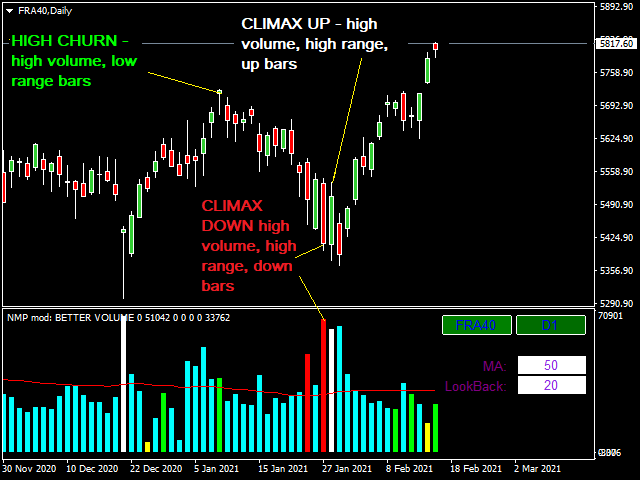
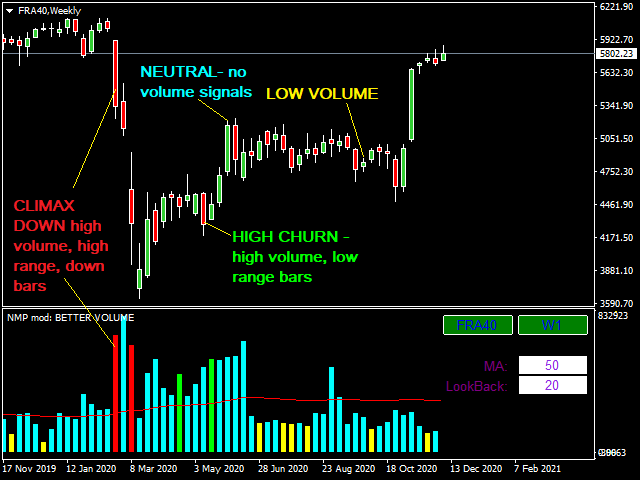
The indicator  improves the comprehension  on volume by coloring the classical histogram bars:

  • CLIMAX UP -  it points out high volume, high range, up bars - White
  • CLIMAX DOWN - it indicates high volume, high range, down bars - Red
  • LOW VOLUME - it can be seen at the similar places to the low churn bar - Yellow
  • HIGH CHURN - it shows high volume, low range bars - Lime
  • CLIMAX CHURN - it's the combination of Volume Climax plus High Volume Churn - Magenta
  • NEUTRAL - there aren't volume signals - Cyan
  • Moving Average of volume - Red


Input

  • It is possibile to customize 3 symbols
  • It is possible to shut down the button and setup your favorite keys to on-off the indicator
  • It is possible to customize the button: the position on the screen, the size, the colors and the label
    Alerts:
    • It's possible set up alerts on colors
    • in the metatrader terminal with sound and graphical interface or only with sound
    • sending email. You have to fill Email in metatrader platform: 'Tools-Options-Email' tab"



    Рекомендуем также
    Smart Currency Strength   is a powerful yet simple indicator that measures the strength of individual currencies. It features a graphic panel that lists the main currencies and their strength in each timeframe, ranging from 0 (most oversold) to 100 (most overbought). The strength for all currencies in the current timeframe is also shown in a separate window as a multi-line graph, where each currency is represented with a different color, this allows you to monitor the evolution of strength t
    This is a volume profile where you can customize the time period you want. You can do this with a line or choose automatic functions such as showing the volume from the last time period. The indicator also shows the maximum volume value (VPOC - VOLUME POINT OF CONTROL) and the average value, colors and settings you can adjust as you like, there are many possibilities. If you need an indicator that shows the constant volume time frames there is  ...HERE... Volume Profile  is an advanced charting
    This is a Manual Indicator to help Manual traders see the Trend Visually it allows you to fully control how the candle closes with many different options, and you can plot the path with many different options. This Indicator is best used in Timeframe: H1 or higher Close Candle Methods Close Open High Low Median Typical Weighted Close Median Body (Open+Close)/2 Average (High+Low+Open+Close)/4 Trend Biased Heiken Ashi Close Heiken Ashi Open Heiken Ashi High    Heiken Ashi Low Heiken Ashi Media
    Этот индикатор «все в одном» отображает в реальном времени «структуру рынка» (внутреннюю и колебательную BOS / CHoCH), блоки ордеров, зоны премий и скидок, равные максимумы и минимумы и многое другое... позволяя трейдерам автоматически размечать свои графики с помощью широко используемых методологий ценового действия. После выпуска нашего скрипта Fair Value Gap мы получили многочисленные запросы от нашего сообщества на выпуск большего количества функций в той же категории. «Структура рынка» —
    FREE
    Индикатор SPV четко отражает цикличность рынка. Всего один ключевой параметр настройки! Если он равен единице то отображается быстрая  цикличность, но если например ппараметр равен 12 то индиатор ищет цикличность в 12 последних барах. Можно увидеть подъемы и спады индикатора чередуются и имеют такую ​​зависимость с рынком по которой можно делать выводы для предсказания поведения цены. Также индикаторы можно комбинировать между собой. Также индикатор может указывать на качество аномальные моменты
    Relative Volume MT4
    Alberto Gauer Borrego
    4 (1)
    Relative Volume or RVOL is an indicator that averages the volume of X amount of days, making it easy to compare sessions volumes. The histogram only has 3 colors: Green - Above average volume Yellow - Average volume Red - Below average volume The default setting is 20 days, which corresponds more or less to a month of trading. With the data obtained from this indicator you can better gauge the commitment behind a move. For example, you will be better equipped to judge if a bre
    FREE
    With Fixed Range Volume Profile,The traces left by the big players will not go unnoticed by you. Professional   Volume Profile   Indicator reveals Institutional order flow. This advanced market indicator will teach you to spot the buying and selling. Dont want to say more because its well known by most professionals  trader. This Indicator : -  Quickly Identify the Strongest Institutional S/R Zones. - W orks with all Trading Instruments (Forex, Futures, Indexes, Commodities, Stocks, Cryptoc
    "Ichimoku Waves Meter"  Измеритель Волн Ишимоку  это професиональный инструмент для графического анализа с использованием действительных интерпретаций Ichimoku kinkōhyō! это графическая программа, позволяющая быстро и просто измерить пропорции между указанными точками на графике цены. Предлагаемый показатель ценового и временного диапазона является основным инструментом для анализа графика в соответствии со стратегией Ichimoku на платформе MT4. За короткий промежуток времени с помощью данного ин
    Market Profile Shows where the price has spent more time, highlighting important levels that can be used in trading. It is a powerful tool which is designed to take the fundamental components which comprise every market; price/volume/time, and visually display their relationship in real-time as the market develops for a pre-determined time period. Very powerful tool!
    Индикатор строит уровни по локальным максимумам минимумам недели, месяца, года. Параметры: Week number - количество недель для отображения линий Week level color - Цвет линии недели Month number - количество месяцев для отображения линий Month level color - Цвет линии месяца Year number - количество лет для отображения линий Year level color - Цвет линии года Width line - Ширина линий Style line - Стиль линий
    Directional Volatility & Volume Oscillator - Unleash Your Trading Potential Welcome to a new era of trading excellence with the "Directional Volatility & Volume Oscillator." This innovative indicator is engineered to provide you with essential insights into market volatility and volume, empowering you to make well-informed trading decisions. Basic Details : Indicator Type : Directional Volatility & Volume Oscillator Key Metrics : Real-time volatility and volume insights for precise trading analy
    Внимание: Для корректного шрифта меню необходимо скачать и установить шрифт "Agency FB" ! Индикатор BreakoutSR отображает уровни возможного пробоя цены для текущего/следующего дня . График очень наглядный благодаря встроенным линиям поддержки и сопротивления , а также меню . При закрытии свечи выше уровня "LONG" открывайте длинную позицию , при закрытии ниже уровня "SHORT" - короткую . То же относится к пробою уровней SHORT/LONG. Простой и понятный инструмент, отлично подходит для любых трейдеро
    Graphic Shapes -используя историю,проецирует в текущий момент четыре вида графических фигур, позволяющих определить основные диапазоны движения цены в будущем,а так же даёт понимание основных разворотов рынка ,при этом давая точки входа по приоритету!В панели расположены три вида величины фигур выраженные таймфреймами. Позволяют проводить полный анализ рынка,не используя дополнительные инструменты! Индикатор является мощным инструментом прогноза движения цены на рынке форекс!
    Преимущества индикатора тиковых объемов: Идентификация рыночных настроений : Преобладание белых столбцов гистограммы может указывать на восходящий тренд или сильное покупательское давление, что полезно для определения точек входа в длинные позиции. Преобладание красных столбцов указывает на нисходящий тренд или сильное давление со стороны продавцов, что полезно для определения точек входа в короткие позиции. Анализ активности рынка : Индикатор помогает выявить периоды высокой активности, когда
    Call/Put Ratio является одним из самых известных индикаторов настроения толпы (сантимента). Индикатор был разработан Мартином Цвейгом, и его работа основывается на учете реальных объемов опционного рынка CBOE. Известно, что опцион Call дает право владельцу купить базовый актив по заранее фиксированной цене. Опцион Put, напротив, дает право его продать. Таким образом, увеличение объемов по Call-опционам указывает, что спрос на товар начинает увеличиваться. Когда растет объем Put-опционов, предлож
    ComplexPulse - импульсный индикатор или сигнальный. Чувствительный и быстро реагирует на ценовые движения. Индикатор показывает взаимозависимость различных валютных пар, а именно: USD, EUR, GBP, CHF, JPY. Валюты измеряются в относительных единицах, поэтому в каждую единицу времени сумма всех валют будет равна нулю. Отсюда один из основных элементов кластерных индикаторов является линия нуля, или линия баланса (нулевая линия). Если какая-то валюта находится ниже линии баланса, то говорят, что вал
    The Sensitive Price Level indicator (SPL) draws fixed horizontal levels on charts that allow seeing sensitive target prices, helping to find more accurate entry points to open or close your trades. It is a needful instrument to take a decision in trading activity and to give a clear orientation on charts. A simple control panel allows calculating operation costs and lots. Features 1.Grid visualization price levels multiple of 10X,100X,1000X, identified by colors: - 10X     : DIMGRAY dot lines. -
    The MT4 DumpTicksCSV EA is a powerful tool designed for traders who need to capture and analyse market tick data. This EA continuously records all incoming tick data and saves it in a CSV file, making it easy to import the data into Excel or any database for detailed analysis. Each tick entry includes the server and candle timestamps, bid price, ask price, and spread, volume, Open, Close, High and Low; ensuring comprehensive data collection. Ideal for quantitative analysts, developers, and trade
    Скрипт используется для сбора статистики по переходам цены между уровнями сетки, размер которой задается в настройках (смотрите индикатор Transitions between levels ). Данные записываются в CSV файл. Есть два режима сбора статистики: SeparateTransition - учитывается каждый отдельный переход (смотрите скриншот 2). Время перехода - время, когда цена коснулась нового уровня. Accumulation - в файл записывается количество однонаправленных переходов  (смотрите скриншот 4). Например, -7 - семь пеерех
    Features: Sharkfin Alerts Multi-timeframe Multi-currency SM TDI: To show TDI lines with sharkfin levels Zigzag MTF: To see Higher Timeframe trend Detailed blog post and extras: https://www.mql5.com/en/blogs/post/759138 Arrows works on a single timeframe and single currency. But it’s visually helps see that sharkfins. You can also get the simple arrows from mql5 site product: https://www.mql5.com/en/market/product/42405 About Scanner: It is an easy to use simplified scanner. It will show w
    IceFX TickInfo - это уникальный индикатор для тиковых графиков для платформы MetaTrader 4. Индикатор графически отображает последние 100 тиков, а также дополнительно показывает текущий спред, цены bid/ask и значение времени на элегантной панели IceFX. Индикатор является эффективным инструментом для трейдеров, торгующих на таймфрейме M5 или даже M1. Параметры индикатора: Corner - угол привязки панели; CornerXOffset - отступ от угла по горизонтали; CornerYOffset - отступ от угла по вертикали; Ch
    FREE
    В работе индикатора Trend Rever для отображения сигналов на покупку  либо продажу используются две линии разного цвета. Первая из этих линий красная, а вторая синяя. При изменении цвета линий также отображается стрелка которая говорит о том  какую открыть сделку, на покупку или продажу. Простая, но эффектиная система для определения форекс-тренда. Алгоритм учитывает измерение цен, также данном методе делается упор на измерение каждого из перепадов цен - что дает более детализированную информаци
    The latest version of Indicator is fully integrated into an all-in-one package, including: Fair Value Gaps (FVG). See more =>  How to trade with FVG Implied Fair Value Gap (IFVG). See more =>   How to trade with IFVG OrderBlock (OB). See more =>   How to trade with OrderBlock The options in the settings section are relatively easy to navigate, and you can even use them right away upon activation without encountering difficulties when using the default configuration. The indicator utilizes an al
    Индикатор PipTick Effort Index основан на работах спредового трейдера Картика Марара (Karthik Marar). Индикатор сравнивает изменение цены (результат) с объемом (усилие) за определенный период времени. Сравнивая результат с усилием, мы можем получить больше информации о будущем ценовом движении. Оба значения нормализуются и преобразуются в шкалу от 0 до 100% на основе выбираемого периода истории. Закон усилия и результата Согласно закону, изменение цены торгового актива является результатом усили
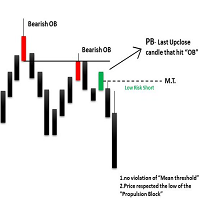
    The   ICT Propulsion Block   indicator is meant to detect and highlight propulsion blocks, which are specific price structures introduced by the Inner Circle Trader (ICT). Note: THIS IS MTF version.  Single Timeframe version avaiable at   here  Propulsion Blocks are essentially blocks located where prices interact with preceding order blocks. Traders often utilize them when analyzing price movements to identify potential turning points and market behavior or areas of interest in the market.
    DataGrabber The database creator DataGrabber store selected instrument history to .csv files. It's purpose is to automatically create extensive history database. DataGrabber is added to the selected instrument chart window as an indicator. It periodically check presence of bar data on the server and presence of .csv files on client PC (local database). If missing files detected in local database, it's created, filled with data and added to the database. Range of bar history in days bee
    Индикатор спреда между двумя парами инструментов. Индикатор показывает разницу в цене между двумя инструментами: График в виде гистограммы показывает разницу в цене между двумя инструментами в отдельном окне. Идеально подходит для связанных инструментов, например:  BRN -- WTI,  GOLD -- 50* Silver, DJ -- 14*S&P500, и т.д.; Метод расчета: разница в ценах закрытия (открытие / максимум / минимум) между двумя текущими барами и последовательно N-баров назад; Скользящая средняя по гистограмме; Параме
    Gann Box MT4
    Frederic Jacques Collomb
    aИндикатор Gann Box — это мощный и многофункциональный инструмент, разработанный для помощи трейдерам в выявлении и использовании ключевых уровней на рынке. Этот индикатор позволяет нарисовать на графике прямоугольник, который автоматически разделяется на несколько зон со стратегическими уровнями 0, 0.25, 0.50, 0.75, 1 . Когда цена касается одного из этих уровней, срабатывают предупреждения, что является ценным помощником в принятии торговых решений. Вы мгновенно видите, как развивается рынок п
    Forex Volume MT4
    KEENBASE SOFTWARE SOLUTIONS
    KT Forex Volume shows the buying and selling volume of a currency pair in the form of a colored histogram. The volume is made of buying and selling transactions in an asset. In FX market: If the buying volume gets bigger than the selling volume, the price of a currency pair would go up. If the selling volume gets bigger than the buying volume, the price of a currency pair would go down. Features Avoid the bad trades by confirming them using the tick volume data. It helps you to stay on the si
    NAM Chart Info New
    NAM TECH GROUP, CORP.
    4 (1)
    Этот замечательный инструмент позволит вам легко и быстро управлять риском каждой операции. Его инновационный интерфейс позволяет вам рассчитывать количество лотов и соотношение риска и прибыли за секунды, удерживать ваши операции в пределах желаемого диапазона риска и избегать плохих времен в вашей торговле. После того, как у вас есть открытые операции, на панели отображается раздел с подробностями каждой операции и сводкой всех указанных очень важных данных. Не усложняйте себя, открывая мно
    С этим продуктом покупают
    Gann Made Easy - это профессиональная, но при этом очень простая в применении Форекс система, основанная на лучших принципах торговли по методам господина У.Д. Ганна. Индикатор дает точные BUY/SELL сигналы, включающие в себя уровни Stop Loss и Take Profit. Пожалуйста, напишите мне после покупки! Я поделюсь своими рекомендациями по использованию индикатора. Также вас ждет отличный бонусный индикатор в подарок! Вероятно вы уже не раз слышали о торговли по методам Ганна. Как правило теория Ганна от
    Official Release price of $65 for the first 48 /50   copies ( 2 copies left). Next price is $120 !  Send us a message after your purchase to receive more information on how to get your  BONUS  for FREE  that works in great combination with Bull vs Bear ! Bull versus Bear is an easy-to-use Forex indicator that gives traders clear and accurate signals based on clear trend retests . Forget about lagging indicators or staring at charts for hours because  Bull vs Bear provides real-time entries
    - Real price is 80$ - 40% Discount ( It is 49$ now ) Contact me for instruction, add group and any questions! Related Products:  Bitcoin Expert , Gold Expert Introduction The breakout and retest strategy is traded support and resistance levels. it involves price breaking through a previous level.  The break and retest strategy is designed to help traders do two main things, the first is to avoid false breakouts. Many false breakouts start with a candlestick that breaks out of a level but ends w
    FX Volume
    Daniel Stein
    4.58 (33)
    Получайте ежедневную информацию о рынке с подробностями и скриншотами в нашем утреннем брифинге здесь, на mql5 , и в Telegram ! FX Volume - это ПЕРВЫЙ и ЕДИНСТВЕННЫЙ индикатор объема, который дает РЕАЛЬНОЕ представление о настроении рынка с точки зрения брокера. Он дает потрясающее представление о том, как институциональные участники рынка, такие как брокеры, позиционируют себя на рынке Forex, гораздо быстрее, чем отчеты COT. Видеть эту информацию прямо на своем графике - это настоящий геймчей
    Прежде всего стоит подчеркнуть, что этот торговый индикатор не перерисовывается, не перерисовывает и не отставает, что делает его идеальным как для ручной, так и для роботизированной торговли. Руководство пользователя: настройки, вводы и стратегия. Атомный аналитик - это индикатор ценового действия PA, который использует силу и импульс цены, чтобы найти лучший край на рынке. Оборудованный расширенными фильтрами, которые помогают убирать шумы и ложные сигналы, и повышают торговый потенциал. Испо
    Gold Stuff
    Vasiliy Strukov
    4.89 (241)
    Gold Stuff - трендовый индикатор, разработанный специально для золота, также может использоваться на любых финансовых инструментах. Индикатор не перерисовывается и не запаздывает. Рекомендуемый тайм-фрейм H1.  По данному индикатору написан советник EA Gold Stuff, Вы можете найти его в моем профиле. Свяжитесь со мной сразу после покупки для получения   персонального бонуса!  Вы можете получить бесплатную копию нашего индикатора Strong Support and Trend Scanner, пожалуйста, в личку. мне! Настройки
    Trend Punch
    Mohamed Hassan
    4.95 (20)
    Halloween Promotion   until Sunday 11-03-24  with a 40% discount on the original price!  This indicator is unstoppable when combined with our other indicator called  Support & Resistance . After purchase, send us a message and you will get it   for  FREE as a BONUS! Introducing Trend Punch , the revolutionary forex trend indicator that will transform the way you trade! Trend Punch is uniquely designed to provide precise buy and sell arrows during strong market trends, making your trading d
    Инновационный индикатор, использующий эксклюзивный алгоритм для быстрого и точного определения тренда. Индикатор автоматически рассчитывает время открытия и закрытия позиций, а также подробную статистику работы индикатора на заданном отрезке истории, что позволяет выбрать наилучший торговый инструмент для торговли. Вы также можете подключить свои пользовательские стрелочные индикаторы к Scalper Inside Pro для проверки и расчета их статистики и прибыльности. Scalper Inside PRO (версии 6.5 и выше)
    Получайте ежедневную информацию о рынке с подробностями и скриншотами через наш утренний брифинг здесь, на mql5 , и в Telegram ! FX Power MT4 NG - это новое поколение нашего популярного измерителя силы валют FX Power. Что же предлагает этот измеритель силы нового поколения? Все, что вы любили в оригинальном FX Power ПЛЮС Анализ силы GOLD/XAU Еще более точные результаты расчетов Индивидуально настраиваемые периоды анализа Настраиваемый предел расчета для еще более высокой производительности Спец
    FX Levels - это исключительно точный индикатор поддержки и сопротивления, объединяющий традиционный метод Lighthouse с инновационным динамическим подходом и безупречно работающий на всех торговых инструментах. Это касается и валютных пар, и индексов, и акций, и сырьевых товаров. FX Levels определяет точки разворота и отображает их на графике, которые могут быть идеально использованы в качестве целей прибыли в вашей торговой деятельности. При разработке FX Levels мы использовали наш богатый опыт
    The Stochastic Basket Currency Strenght  brings the Stochastic indicator to a new level.  Expanding the boundaries of TimeFrames and mono-currency analysis, the SBCS take the movements of each currency that composes the cross and confront them in the whole basket of 7 crosses.  The indicator works with any combination of AUD, CAD, CHF, EUR, GBP, JPY, NZD, USD pairs and with full automation takes in account every stochastic value (main line) for the selected Time Frame.  After that, the indicator
    Trend Pulse
    Mohamed Hassan
    5 (4)
    Halloween Promotion   for   24 hours only   with a   40%   discount on the original price!  $̶6̶5̶  $39 ONLY!  Please contact me after purchase to immediately get your PDF strategy + documentation for Trend Pulse !  Introducing Trend Pulse , a unique and robust indicator capable of detecting bullish, bearish, and even ranging trends! Trend Pulse uses a special algorithm to filter out market noise with real precision. If the current symbol is moving sideways, Trend Pulse will send you a
    TPSproTREND PrO
    Roman Podpora
    4.79 (19)
    TPSpro TREND PRO   —  трендовый индикатор, который автоматически анализирует рынок и предоставляет информацию о тренде и каждой его смене а также дающий сигналы для входа в сделки без перерисовки! Индикатор использует каждую свечу, анализируя их отдельно. относя к разным импульсам – импульс вверх или вниз. Точные точки входа в сделки  для  валют, крипты, металлов, акций, индексов! Version MT5           ПОЛНОЕ ОПИСАНИЕ ИНДИКАТОРА           Рекомендуем использовать с  индикатором -  RFI LEVELS
    Stratos Pali Indicator   is a revolutionary tool designed to enhance your trading strategy by accurately identifying market trends. This sophisticated indicator uses a unique algorithm to generate a complete histogram, which records when the trend is Long or Short. When a trend reversal occurs, an arrow appears, indicating the new direction of the trend. Important Information Revealed Leave a review and contact me via mql5 message to receive My Top 5 set files for Stratos Pali at no cost! D
    Trend Screener
    STE S.S.COMPANY
    4.81 (88)
    Индикатор тренда, революционное уникальное решение для торговли и фильтрации тренда со всеми важными функциями тренда, встроенными в один инструмент! Это 100% неперерисовывающийся мультитаймфреймный и мультивалютный индикатор, который можно использовать на всех инструментах/инструментах: форекс, товары, криптовалюты, индексы, акции. ПРЕДЛОЖЕНИЕ ОГРАНИЧЕННОГО ВРЕМЕНИ: Индикатор скринера поддержки и сопротивления доступен всего за 50$ и бессрочно. (Изначальная цена 250$) (предложение продлено) Tre
    Reversal-Arrow: Определите точки разворота с точностью и надежностью Reversal-Arrow — это продвинутый индикатор, созданный для помощи трейдерам всех уровней в определении потенциальных точек разворота тренда. Индикатор предоставляет четкие и визуальные сигналы, чтобы помочь вам лучше понимать рыночный контекст, снижая неопределенность и облегчая процесс принятия решений. Reversal-Arrow оптимизирован специально для пар XAUUSD и XAUEUR на таймфреймах 1 минута, 5 минут и 15 минут, где он показывает
    Важным ключевым элементом в трейдинге являются зоны или уровни, от которых принимаются решения о покупке или продаже торгового инструмента. Несмотря на попытки крупных игроков скрыть свое присутствие на рынке, они неизбежно оставляют следы. Наша задача заключалась в том, чтобы научиться находить эти следы и правильно их интерпретировать. INSTRUCTIONS     RUS   -    ENG                    Рекомендуем использовать с индикатором -   TPSpro  TREND PRO -  Version MT5 Основные функции: Отображения ак
    Dynamic Forex28 Navigator — инструмент для торговли на рынке Форекс нового поколения. В НАСТОЯЩЕЕ ВРЕМЯ СКИДКА 49%. Dynamic Forex28 Navigator — это эволюция наших популярных индикаторов, объединяющая мощь трех в одном: Advanced Currency Strength28 Indicator (695 отзывов) + Advanced Currency IMPULSE with ALERT (520 отзывов) + CS28 Combo Signals (бонус). Подробности об индикаторе https://www.mql5.com/en/blogs/post/758844 Что предлагает индикатор Strength нового поколения?  Все, что вам нрав
    Эта панель показывает последние доступные гармонические паттерны для выбранных символов, так что вы сэкономите время и будете более эффективны / MT5 версия . Бесплатный индикатор: Basic Harmonic Pattern Колонки индикатора Symbol: отображаются выбранные символы Trend : бычий или медвежий Pattern : тип паттерна (Гартли, бабочка, летучая мышь, краб, акула, шифр или ABCD) Entry : цена входа SL: цена стоп-лосса TP1: цена первого тейк-профита TP2: цена второго тейк-профита TP3: цена 3-го тейк-про
    Scalper Vault — это профессиональная торговая система, которая дает вам все необходимое для успешного скальпинга. Этот индикатор представляет собой полную торговую систему, которую могут использовать трейдеры форекс и бинарных опционов. Рекомендуемый тайм фрейм М5. Система дает точные стрелочные сигналы в направлении тренда. Она также предоставляет вам сигналы выхода и рассчитывает рыночные уровни Ганна. Индикатор дает все типы оповещений, включая PUSH-уведомления. Пожалуйста, напишите мне после
    Gold Channel is a volatility-based indicator, developed with a specific timing algorithm for the XAUUSD pair, which consists of finding possible corrections in the market. This indicator shows two outer lines, an inner line (retracement line) and an arrow sign, where the theory of the channel is to help identify overbought and oversold conditions in the market. The market price will generally fall between the boundaries of the channel. If prices touch or move outside the channel it is a tra
    В настоящее время скидка 20%! Лучшее решение для новичка или трейдера-эксперта! Эта приборная панель работает на 28 валютных парах. Он основан на 2 наших основных индикаторах (Advanced Currency Strength 28 и Advanced Currency Impulse). Он дает отличный обзор всего рынка Forex. Он показывает значения Advanced Currency Strength, скорость движения валюты и сигналы для 28 пар Forex на всех (9) таймфреймах. Представьте, как улучшится ваша торговля, когда вы сможете наблюдать за всем рынком с пом
    Currency Strength Wizard — очень мощный индикатор, предоставляющий вам комплексное решение для успешной торговли. Индикатор рассчитывает силу той или иной форекс-пары, используя данные всех валют на нескольких тайм фреймах. Эти данные представлены в виде простых в использовании индексов валют и линий силы валют, которые вы можете использовать, чтобы увидеть силу той или иной валюты. Все, что вам нужно, это прикрепить индикатор к графику, на котором вы хотите торговать, и индикатор покажет вам ре
    Прежде всего стоит подчеркнуть, что этот Торговый Инструмент является Неперерисовывающимся Нерепейнтинговым Индикатором, что делает его идеальным для профессиональной торговли. Онлайн-курс, руководство пользователя и демонстрация. Индикатор Концепций Умного Действия Цены - очень мощный инструмент как для новичков, так и для опытных трейдеров. Он объединяет более 20 полезных индикаторов в одном, комбинируя передовые торговые идеи, такие как анализ Inner Circle Trader и стратегии торговли конц
    В НАСТОЯЩЕЕ ВРЕМЯ СКИДКА 26% Лучшее решение для новичка или трейдера-эксперта! Этот индикатор является уникальным, высококачественным и доступным торговым инструментом, поскольку мы включили в него ряд собственных функций и новую формулу. С помощью всего лишь ОДНОГО графика вы можете определить силу валюты для 28 пар Форекс! Представьте, как улучшится ваша торговля, потому что вы сможете точно определить точку запуска нового тренда или возможность скальпирования? Руководство пользователя:
    Ultimate Gold Advisor для MetaTrader 4 Ultimate Gold Advisor — это продвинутый технологический инструмент, созданный для оптимизации торгового процесса на MetaTrader 4. Разработанный для удовлетворения потребностей опытных трейдеров, этот индикатор сочетает точность, сложный анализ и многофункциональность, предоставляя поддержку для принятия обоснованных торговых решений. Идеально подходит для торговли золотом, но также применим к широкому спектру активов. Ultimate Gold Advisor может помочь вам
    Данный индикатор основан на математике великого трейдера W.D.Ganna.  С помощью его мы с легкостью найдете сильные уровни анализируя свинг для поиска оптимальной точки входа. Индикатор работает на всех инструментах и всех тайм фреймах. Индикатор полностью ручной и оснащен кнопками управления. Все что вам нужно это нажать на кнопку NEW, появится отрезок, данный отрезок вы размещаете на любое движение, свинг или даже 1 свечу, которую хотите проанализировать. Разместив отрезок нажимаете кнопку ОК. П
    Представляем ON Trade Waves Patterns Harmonic Elliot Wolfe, передовой индикатор, разработанный для обнаружения разнообразных рыночных паттернов с использованием как ручных, так и автоматизированных методов. Вот как это работает: Гармонические паттерны: Этот индикатор может определять гармонические паттерны, появляющиеся на вашем графике. Эти паттерны важны для трейдеров, практикующих теорию гармонической торговли, как это описано в книге Скотта Карни "Гармоническая Торговля том 1 и 2". Независи
    Market Structure Patterns   is an indicator based on   smart money concepts   that displays   SMC/ICT   elements that can take your trading decisions to the next level. Take advantage of the   alerts ,   push notifications   and   email messages   to keep informed from when an element is formed on the chart, the price crosses a level and/or enters in a box/zone. Developers can access the values of the elements of the indicator using the   global variables  what allows the automation of trading
    IX Power MT4
    Daniel Stein
    4.67 (6)
    IX Power , наконец, предлагает непревзойденную точность FX Power для нефорексных символов. Он точно определяет интенсивность краткосрочных, среднесрочных и долгосрочных трендов в ваших любимых индексах, акциях, товарах, ETF и даже криптовалютах. Вы можете анализировать все, что может предложить ваш терминал. Попробуйте и почувствуйте, как значительно улучшается ваш тайминг при торговле. Ключевые особенности IX Power 100% точные результаты расчетов без перерисовки - для всех торговых сим
    Другие продукты этого автора
    The Bolliger Bands On-Off let you control the indicator  using  the keyboard  or a  button . You can choose if you want the indicator always shown or always hided while switching among different time frames or financial instruments .    --->  This indicator is part of Combo Indicator OnOff The Bollinger Bands identify the degree of real-time volatility for a financial instruments . A lower amplitude corresponds to a low volatility, conversely a greater bandwidth corresponds to high volatility
    FREE
    The Moving Averages On-Off  let you  control the indicator  using  the keyboard  or a  button . You can choose if you want the indicator always shown or always hided while switching among different time frames or financial instruments .    --->  This indicator is part of Combo Indicator OnOff It's possible to  setup three Moving Averages : Short ,  Medium ,  Long   Input You can customize the price type used for calculation : close, open, high, low, median price, typical price, weighted It
    FREE
    The purpose of the Combo OnOff indicator is combine differerent tecniques and approachs to the market in order to spot signals that occur simultaneosly. A signal is more accurate if it is validate from more indicators as the adaptive expectations can be used to predict prices.The On-Off  feature and alarms help to look for the better prices to enter/exit in the markets Moving Averages are statistics that captures the average change in a data series over time Bollinger Bands is formed by upp
    The Bolliger Bands On-Off let you control the indicator  using  the keyboard  or a  button . You can choose if you want the indicator always shown or always hided while switching among different time frames or financial instruments . --->  This indicator is part of Combo Indicator OnOff The Bollinger Bands identify the degree of real-time volatility for a financial instruments . A lower amplitude corresponds to a low volatility, conversely a greater bandwidth corresponds to high volatility. N
    FREE
    The Moving Averages On-Off  let you  control the indicator  using  the keyboard  or a  button . You can choose if you want the indicator always shown or always hided while switching among different time frames or financial instruments . --->  This indicator is part of Combo Indicator OnOff It's possible to use three Moving Averages , defined as  Short ,  Medium ,  Long or Raimbow MA 5,10,20,50,100,200. Input MOVING AVERAGES You can customize the price type used for calculation : close,
    FREE
    The Multicharts Crosshair draws a cross hair in any linked chart. The indicator can be used for comparison of symbol price levels in different time frame or to compare candles of different instruments in the same time frame How it works: It can works from every linked charts where the indicator is installed towards the others or from the chart where is istalled towards the following linked charts . It can be shown just pressing a the key of keyboard. After installing the indicators in the cha
    Данный индикатор отображает значения доходности за выбранный период. Они отображаются как логарифм доходности, нежели значения цены или необработанные данные о доходности. Для малых значений доходности, показатели арифметической и геометрической доходности будут схожими. Преимущество использования значений доходности вместо цен заключается в нормализации. Это делает возможным сравнение всех переменных в сопоставимой метрике, несмотря на происхождение из ценовых рядов с разными значениями. Вход
    FREE
    This utility allows to switch among symbols. You have to insert in the input your favorite tickers. it is possible to customize up to 5 symbols   Shortcut Keys :   Switch among  Symbols :   A  -Forward    D  -Backward Inputs You can setup your favorite  keys to switch among symbols. You can customize the color of background   and the edge   of the buttons . You can customize the labels : dimension and font.
    FREE
    The purpose   of this utility is to manage one or more subwindow in the same chart by opening and closing them through a button or the keyboard keys How it works: If you want to handle more than one subwindow you need to reinstall the indicator . In this case some setups has to be customized onlu in the last subwindow installed and others setups in the installed subwindow during the first time installation. They are denoted in the input rispectively as ' LW ' and ' IW '. First of all insta
    The utility helps to locate in the  lower time frames  the maximum and minimum of the upper  time frame.  The length of time frame level line  represents the temporal  length of the upper time frame. The indicator draws lines that delimit the upper time frames candle and highlights his high-low price, the pips candle range, the returns and the volatility. How it works: Firstly . Choose which time frames levels to represent in the lower ones : monthly, weekly, daily, H4, H1, M30, M15, M5.
    This utility can compare simultaneously time frames of different instruments and keep under control   the nine major time frames  of an instrument. It is composed by two changers, a crosshair and some additional components : the  multicharts time frames changer   is designed to  compare  simultaneously  up to thirty time frames  of different symbols with the  keyboard or the button the multicharts symbols changer can  link up to nine charts and control simultaneously the nine major time frame b
    The Multicharts Crosshair draws a cross hair in any linked chart. The indicator can be used for comparison of symbol price levels in different time frame or to compare candles of different instruments in the same time frame How it works: It can works from every linked charts where the indicator is installed towards the others or from the chart where is istalled towards the following linked charts . It can be shown just pressing a the key of keyboard. After installing the indicators in the cha
    The purpose of the Combo OnOff indicator is combine differerent tecniques and approachs to the market in order to spot signals that occur simultaneosly. A signal is more accurate if it is validate from more indicators as the adaptive expectations can be used to predict prices.The On-Off  feature and alarms help to look for the better prices to enter/exit in the markets Moving Averages are statistics that captures the average change in a data series over time Bollinger Bands is formed by upp
    The purpose   of this utility is to manage one or more subwindow in the same chart by opening and closing them through a button or the keyboard keys How it works: If you want to handle more than one subwindow you need to reinstall the indicator . In this case some setups has to be customized onlu in the last subwindow installed and others setups in the installed subwindow during the first time installation. They are denoted in the input rispectively as ' LW ' and ' IW '. First of all insta
    The Better Volume indictator improves the comprehension on volume by coloring the classical histogram bars . The colors point out differents nature of volume . The Better Volume OnOff   allows to  open/close the subwindow   through  a botton   or using the keyboard   only.  There is the possibility to customize 3 symbols  and assign them  different parameters   for each time frame . The indicator   improves the comprehension   on volume by coloring the classical histogram bars : CLIMAX UP -
    This utility can compare simultaneously time frames of different instruments and keep under control   the nine major time frames  of an instrument. It is composed by two changers, a crosshair and some additional components : the  multicharts time frames changer   is designed to  compare  simultaneously  up to thirty time frames  of different symbols with the  keyboard or the button the multicharts symbols changer can  link up to nine charts and control simultaneously the nine major time frame b
    The utility helps to locate in the  lower time frames  the maximum and minimum of the upper  time frame.  The length of time frame level line  represents the temporal  length of the upper time frame. It's possible to OnOff the levels with a button or keys The indicator draws lines that delimit the upper time frames candle and highlights his high-low price and the pips candle range. How it works: Firstly . Choose which time frames levels to represent in the lower ones : monthly, weekly, da
    Фильтр:
    Нет отзывов
    Ответ на отзыв
    Версия 1.1 2022.07.07
    - Added the possibility to switch between time frames and symbols(max 3) without change the main chart. The three symbols can be customized in the input.
    - Added two input box to play with MA periods and the look back parameter. When the indicator is deleted these two parameters will be deleted accordingly.