H Line
- Индикаторы
- Tomas Lucena De Oliveira
- Версия: 1.1
- Обновлено: 5 декабря 2020
- Активации: 5
The moving average applied to the price chart is one of the most used technical analysis methods. There are several ways to use averages, among them, through the analysis of crossings.
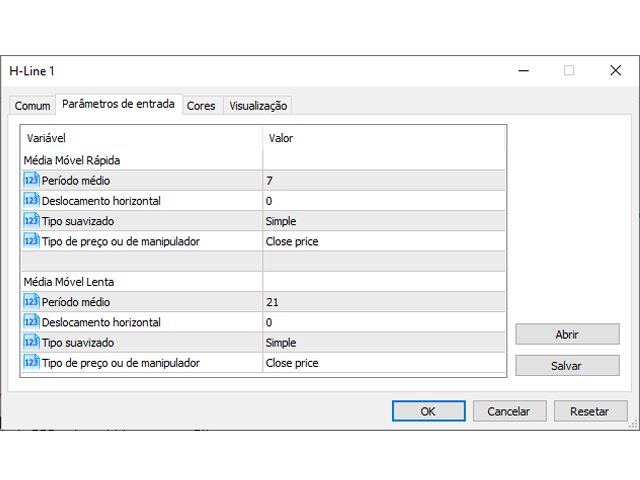
The method consists of using two moving averages, one fast period and one slow period. The concept is very simple, when there is a crossing of the fast moving average upwards it indicates a high market trend and when the fast moving average crosses downwards it indicates a low trend in the market, combining this strategy together with other technical indicators an experienced graphist will have an optimal view of the market.
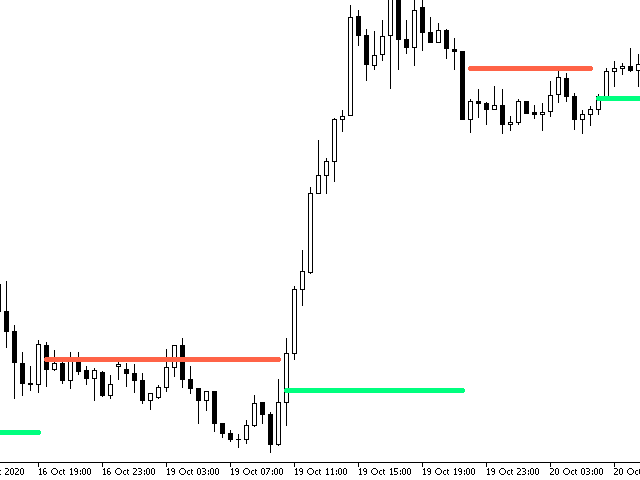
However, even for an experienced graphist using several technical indicators at the same time can often be disrupting, H-Line has emerged as a solution to show the trend lines of the market without having to pollute the screen and facilitate the reading of graphics. With only one line at a time on the screen, the indicator user will be able to more easily identify high movement in the market by looking for the green lines of the H-Line. The program will also identify falling trends through red lines. Making your job much simpler, faster and all around a more pleasant experience.

