Didi Index Indicator
- Индикаторы
- Eduardo Fernando Teixeira
- Версия: 1.5
- Активации: 5
The Didi Index is an indicator that helps in the identification of the so called “Didi Needles” (Agulhada do Didi), a method created by the experienced Brazilian trader Odir Aguiar (Didi).
DIDI NEEDLES EXPLAINED
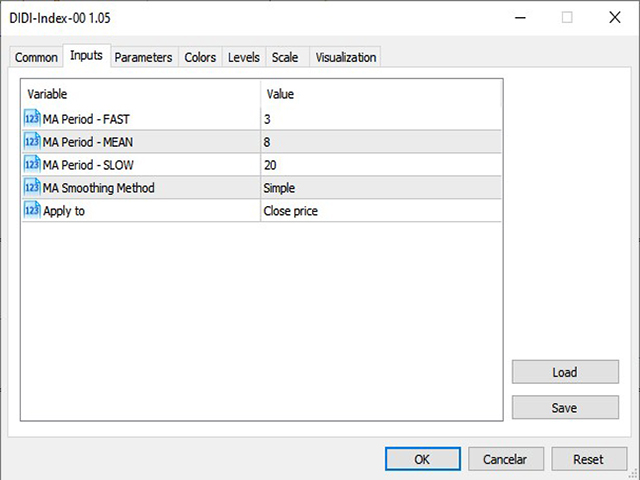
The concept of the needles is simple: 3 moving averages are added to the chart (by default 3, 8 and 20 periods, simple mode), and whenever all 3 averages pass simultaneously inside the real body of a candle, the needling occurs. It was named after the movement of passing a thread through the head of a needle.
After the needling, if the moving averages come out in ascending order (MA 3 above 8, and MA 8 above 20), we will have a BUY SIGNAL, which means that prices can RISE very quickly, because ordered moving averages may indicate a strong trend towards the side they are pointing at.
Conversely, if the moving averages come out in descending order (MA 3 below 8, and MA 8 below 20), we will have a SELL SIGNAL, which means that prices can FALL very quickly.
This method is consistent with the principle of contraction and expansion of moving averages. If all 3 averages are very close together (in this case, passing through the same candle), it means that different price averages of the instrument are in a state of compression, and that there is a great chance that a movement of expansion could occur soon.
THE DIDI INDEX INDICATOR
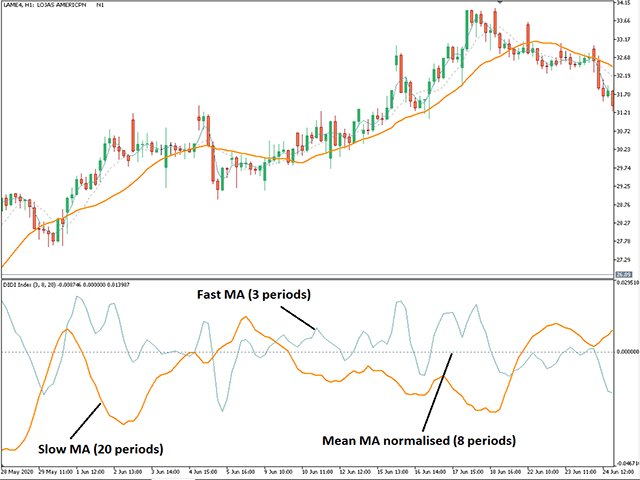
The Didi Index Indicator is built from these 3 moving averages. The central (8 periods) is normalized, staying flat on the chart the whole time, and the other 2 are divided by it, thus creating a crossing relationship between the averages, with a "leveled" base from the central average.
The dotted flat line at position 0 represents the moving average of the central period (8 periods, by default), and the other two lines oscillate, indicating whether they are above or below the central average.
The BUY SIGNAL on this indicator occurs when the 3-period line rises above 0, at the same time that the 20-period line falls below 0. This characterizes the ascending order as described previously (MA 3 greater than 8 , and MA 8 greater than 20). The closer the two crossings occur, the more reliable the signal is.
The SELL SIGNAL occurs when the 3-period line falls below 0, at the same time that the line of 20 periods rises above 0. This characterizes the descending order (MA 3 is less than 8, and the value of the MA 8 is less than 20). The closer the two crossings occur, the more reliable the signal is.

