BollingerStochasticReversal
- Индикаторы
- Lorenzo Coletta
- Версия: 1.0
- Активации: 10
Hello Guys! I want to share with you a very simple but very effective indicator, which I use a lot in my daily trading. Bollinger bands are one of the most effective tools in trading, especially for those who like to operate on low time frames and prefer fast operations.
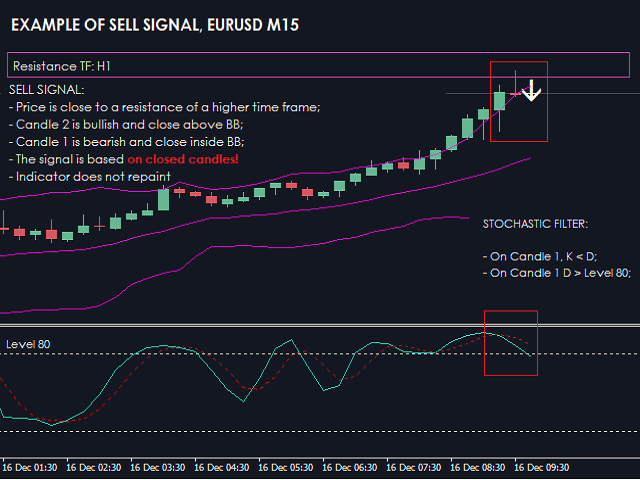
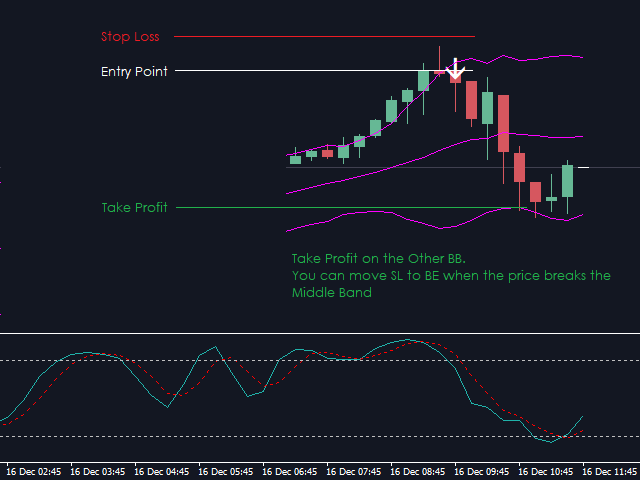
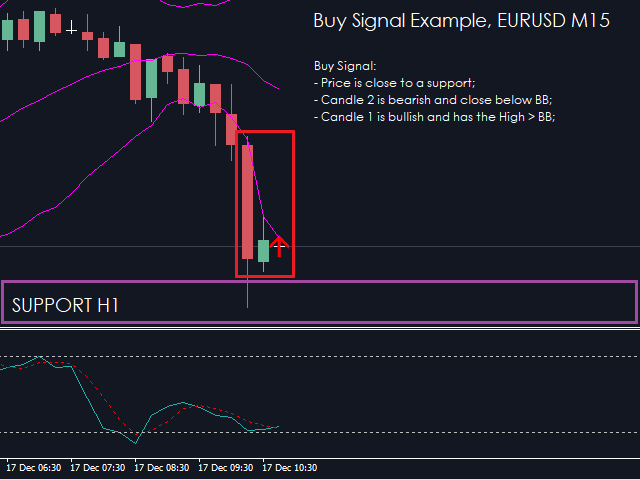
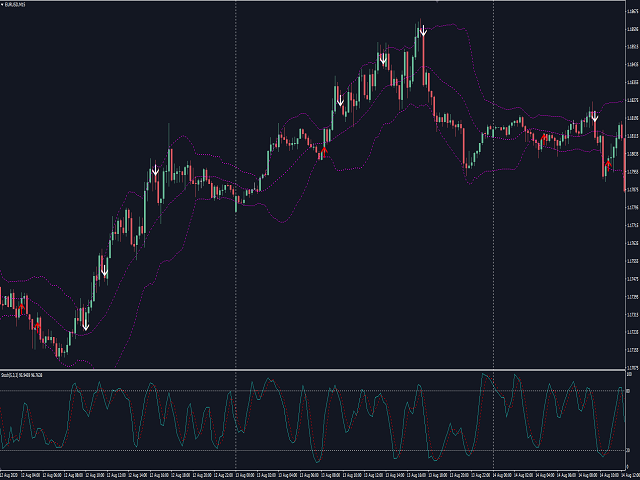
The indicator detects fast reversals: when the price close above or below the Bollinger Bands, but then re-enters in the Bands on the next candle, the indicator sends a signal and draws an arrow on the newly opened candle! It is very important to point out that the indicator works WITH CANDLE CLOSED, therefore all the signals are confirmed. Indicator does not repaint, and you can check it on the chart.
NB: Together with the indicator, is also provided the template as shown in the screenshots.
NOTE ON INDICATOR SETTINGS:
Use Stochastic Filter? - Set true to enable stochastic filter. If false, then the indicator detects only the signal when price re-enter inside the BB Bands
Stochastic Level Up - You can choose whether the reversal of the stochastic must occur above a certain value (usually equal to 80). If it remains 0, this filter is not applied.
Stochastic Level Down - You can choose whether the reversal of the stochastic must occur below a certain value (usually equal to 20). If it remains 100, this filter is not applied.
CONDITION FOR A SIGNAL (BUY/SELL):
1 - Candle 2 is bearish/bullish and close below/above BB;
2 - Candle 1 bullish/bearish (so it's a reversal candle) and at least touch with the spike the BB;
3 - If Stochastic Filter is enabled, on Candle 1 K > D / K < D;
4 - If Stochastic Filter is enabled and Stochastic Level Up is not 0 or Level Down is not 100, on Candle 1 D must be < Level Down / > Level Up.
HOW TO USE THE INDICATOR:
The signals provided by the indicator are very effective on low time frames, such as M15. I use it for scalping operations, to capture a few pips and immediately exit the market.
If used together with the plotting on the chart of supports and resistances (especially for supports and resistances from higher time frames, such as H1 and H4), the success of the indicator is significantly increased
- Prepare the chart by plotting supports and resistance for the current TF, and for the higher time frames (if you are working on M15, use H1 and H4);
- Attach the indicator to the chart;
- Wait for a signal that occurs close to a support or resistance.
NB: To call this indicator in an Expert Advisor with the function ICustom:
iCustom(NULL, 0, "BollingerStochasticReversal", 0, 1); - Buffer 0 is the Buy Signal, so the Up Arrow;
iCustom(NULL, 0, "BollingerStochasticReversal", 0, 1); - Buffer 1 is the Sell Signal, so the DownArrow;I hope this indicator will be useful and if you have any questions, or suggestions for future improvements, send me a message!
