Trap Zone
- Индикаторы
- Luigi Nunes Labigalini
- Версия: 1.2
- Обновлено: 9 октября 2020
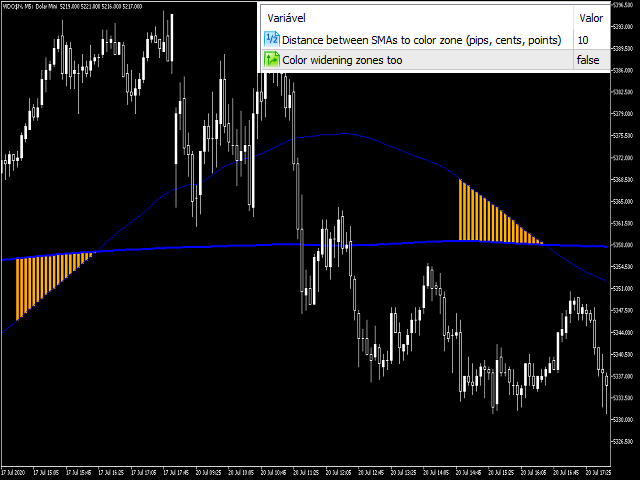
This indicator serves as an alert for climax regions.
How does it work?
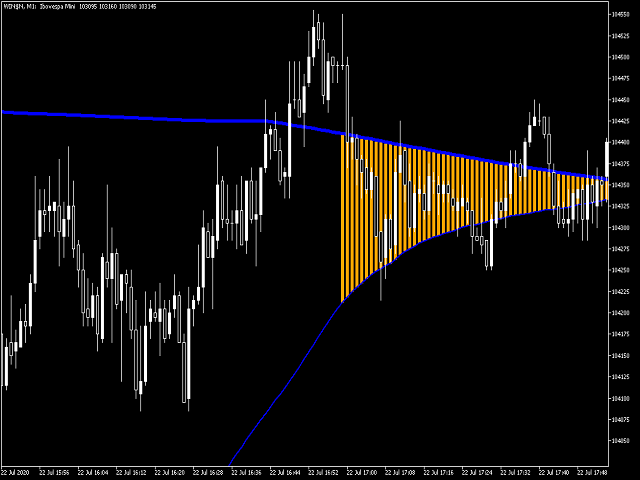
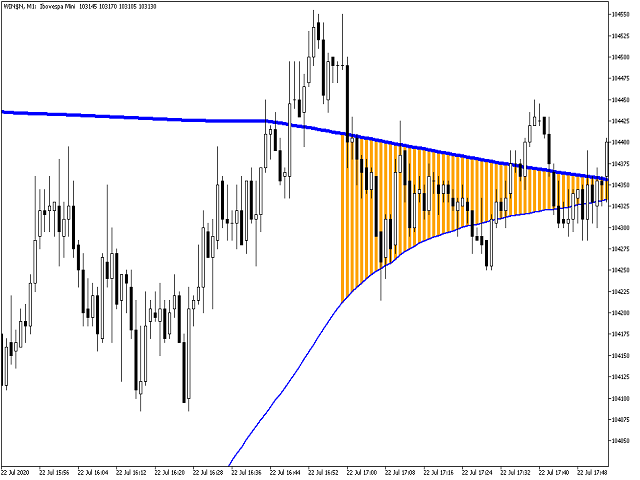
When the 20-period arithmetic moving average meets the 200-period arithmetic moving average, a conflict region forms with two major opposing forces fighting.
This causes the price to show random peaks until a winner side is defined, which can be dangerous.
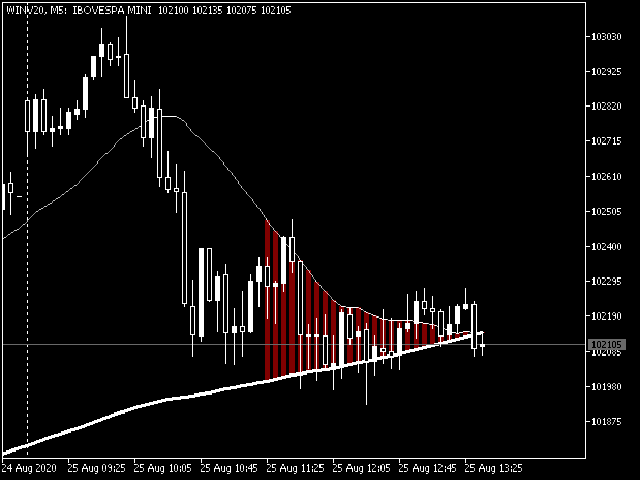
Therefore, the indicator paints the region between the moving averages to alert you.
How to use it?
It can be used for specific volatility or support and resistance strategies, but it is recommended to avoid operations within this region.
So it is useful to plot it on the chart to remember when to stay out.
Features you can edit to your preference:
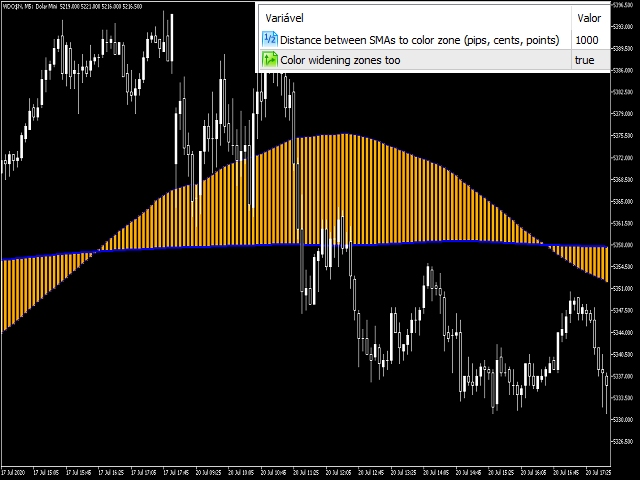
- Maximum distance between the averages to start coloring the zone
- Color only regions of approximation between moving averages or also when they're distancing and widening the zone
- Color of painted area
- Color, thickness and style of moving averages





Good job , good tool to identify the change in the trend .