TMoney Interquartile Range II
- Индикаторы
- Moises Orlando Urbina Sojo
- Версия: 1.10
- Обновлено: 13 июля 2020
- Активации: 5
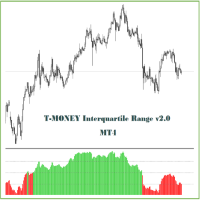
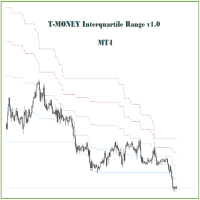
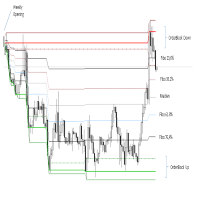
This indicator is similar to "T-MONEY Interquartile I" but it is normalized (on a scale of 0 to 100) and is plotted in a separate window. The normalized interquartile range, the median, and the maximum and minimum zones can be observed. As a visual aid, the green color has been considered in the histogram when the asset is trading above the configured median of "n" periods, and red when the asset is trading below it.
Like its similar, this indicator should be used as a support tool for making operational decisions.
