• Обзор
  • Отзывы (4)
  • Обсуждение (26)
  • Что нового

SFP pattern mql4

4.5

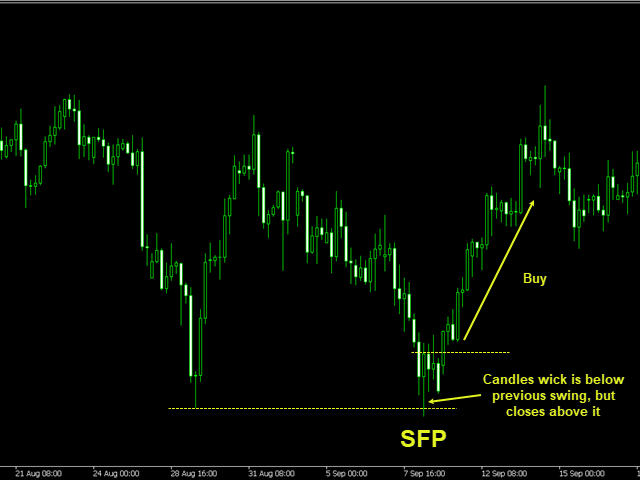
A Swing Failure Pattern (SFP) is a trade setup in which big traders hunt stop-losses above a key swing high or below a key swing low for the purpose of generating the liquidity needed to push price in the opposite direction.

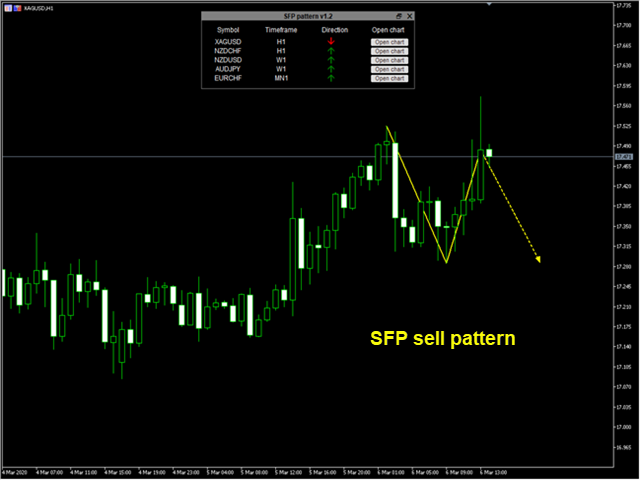
When price 1) pierces above a key swing high but then 2) closes back below that swing high, we have a potential bearish SFP. Bearish SFPs offer opportunities for short trades. When price 1) dumps below a key swing low but then 2) closes back above that swing low, we have a potential bullish SFP. Bullish SFPs offer opportunities for long trades.

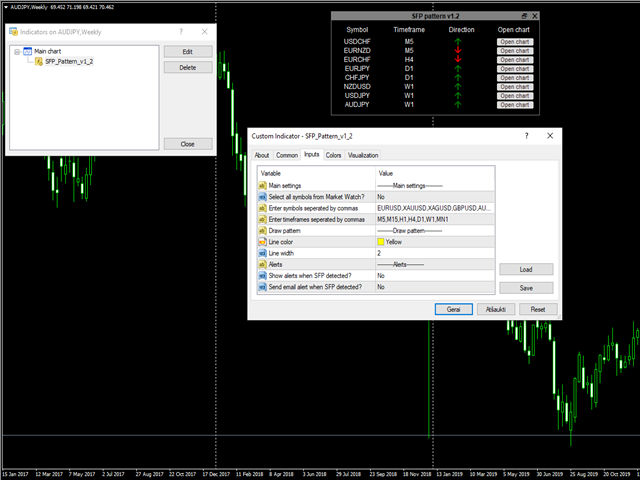
Indicator finds SFP patterns on selected symbols and  time frames and depending on your choice alerts or sends an email. All information is shown in the dashboard. You can open selected chart from the table and see the drawn pattern.

---------Main settings--------
  • Select all symbols from Market Watch? - if Yes the program scans through all the symbols displayed in Market Watch, if No - only selected in next input symbols are scanned
  • Enter symbols separated by commas - enter symbols separated by commas (they must be selected in Market Watch)
  • Enter time frames separated by commas - enter time frames separated by commas (M1,M5,M15,H1,H4,D1,W1,MN1)
---------Draw pattern--------
  • Line color - choose the color for drawing
  • Line width - enter number for line thickness
  • Place mark for stop loss (in ATR units)? - choose Yes or No
  • Multiplier for stop loss (in ATR units) - enter number what size for stop loss in ATR units you want
  • ATR period - period for ATR indicator

-----------Alerts----------

  • Show alerts when SFP detected? - choose Yes or No
  • Send email alert when SFP detected? - choose Yes or No, also you have to configure your email settings in Tools/Options/Email.

    Notes:

    • In tester mode the patterns are drawn only for symbols and time frames of the current chart ant alerts are shown in menu's Journal tab. Also email will not be sent.

    For rebates go to https://premiumtrading.co/?ref=13525 and choose broker.

    Отзывы 4
    GillC
    21
    GillC 2024.06.04 07:20 
     

    I keep getting multiple alerts about symbols I didn't select in the settings such as Symbol CADCHF not valid or not selected in Market Watch. Please enter correct name. Giving good review in the hopes that I will get a prompt reply!

    So it's still not working. It is now saying I have the incorrect timeframe format- timeframe not valid. It's showing zero patterns and I have all on market watch selected so that's most unlikely!

    orangeedge
    240
    orangeedge 2020.12.23 12:56 
     

    Great indicator. Does exactly as described. Like the continuous updates.

    kot2303
    20
    kot2303 2022.03.24 06:40 
     

    орабатывает

    Рекомендуем также
    Fibonacci Channel What is a Fibonacci Channel? The Fibonacci channel is a technical analysis tool that is used to estimate support and resistance levels based on the Fibonacci numbers. It is a variation of the Fibonacci retracement tool, except with the channel the lines run diagonally rather than horizontally. It can be applied to both short-term and long-term trends, as well as to uptrend and downtrends. Lines are drawn at 23.6, 38.2, 50, 61.8, 78.6, 100, 161.8, 200, 261.8, 361.8 and 423.6
    индикатор для торговли бинарными опцыонами отличто подойдкт трейдерам использующым скальпинг или порговлю от уровней поддержки сопротивления или на их пробой индикатор рекомендиется применять в совокупности с дополнительными фильтрами что бы избежать входа в убыточную сделку  так же можно использовать с Bollinger Bands  индикатор показал не плохие результаты (перед использованием на реальном счете проверьте свою торговлю на демо счете что бы привыкнуть к инструменту) Сигналы формируются на текущ
    Forex Indicator  " Engulfing Bar and Consolidation Bar patterns" for MT4 Indicator "Engulfing Bar and Consolidation Bar patterns" is very powerful for Price Action trading Indicator detects Engulfing Bars and Consolidation Bars on chart: Bullish Engulfing Bar pattern - Green arrow signal on chart  Bearish Engulfing Bar   pattern  - Orange arrow signal on chart  Bullish Consolidation Bar  pattern - Blue arrow signal on chart Bearish Consolidation Bar   pattern  - Red arrow signal on chart     N
    Индикатор сканирует до 30 торговых инструментов и до 8 таймфреймов на наличие высоковероятностных моделей паттерна Двойная вершина/дно с ложными прорывами . Концепция индикатора Ultimate Double Top/Bottom и профессиональный способ его применения подробно описаны в блоге (на английском языке): Professional Trading With Double Tops/Bottoms And Divergences! Эта бесплатная версия работает только на EURUSD и GBPUSD. Полная версия индикатора доступна по ссылке: Ultimate Double Top Bottom Reversal Scan
    FREE
    Wicks UpDown Target GJ Wicks UpDown Target GJ is specialized in GJ forex pairs. Choppy movement up and down on the opening range every day.  Trading breakouts on London session and New York session is recommended. Guideline Entry Strategy Idea: Step 1 - Breakout Forming (Warning! Trade on London Session and New York Session) Step 2 - Breakout Starting (Take Action on your trading plan) Step 3 - Partial Close your order & set breakeven (no-risk) Step 4 - Target complete Step 5 - Don't tr
    FREE
    Bar Size MT4
    Mikhail Tcvetkov
    5 (3)
    Технический индикатор, в реальном времени осуществляет поиск свечей, которые своим размером превышают заданный в настройках и дает об этом сигналы. Как правило, такие аномально большие свечи появляются либо в начале сильных импульсов, либо на окончании направленного движения цены. В начале импульса сигнал может служить основанием для поиска точки входа, в конце движения  - является признаком кульминации и может говорить о близком окончании тренда. Эталонным размером для фильтрации аномальных све
    FREE
    Contact me for any queries or custom orders, if you want to use this in an EA. Key Features: Pattern Recognition : Identifies Fair Value Gaps (FVGs) Spots Break of Structure (BOS) points Detects Change of Character (CHoCH) patterns Versatile Application : Optimized for candlestick charts Compatible with any chart type and financial instrument Real-Time and Historical Analysis : Works seamlessly with both real-time and historical data Allows for backtesting strategies and live market analysis V
    FREE
    BE auto
    Muhammad Ridzuan Mohd Radzali
    5 (2)
    Indicator automatically draw bullish and bearish engulfing without any rules. Bearish and Bullish engulf is well known area for supply and demand area marking. This indicator can be used in any strategy that required supply demand zone. Show Last Engulf : Enable this option to show unfresh engulfing  Candle to calculate : set 0 will load all history bar and can use up more memory Bearish Engulfing Colour : Pick any colour that suit Bearish Engulfing Colour  : Pick any colour that suit -Use thi
    FREE
    Индикатор Price Bars and Chart Patterns основан на трех баровых паттернах:  Double Key Reversal Bar Popgun Multiple Inside Bar Индикатор  Price Bars and Chart Patterns  выставляет значки на покупку - зеленый цвет, и на продажу - красный цвет. Значки выставляются согласно сформированным баровым моделям после их подтверждения. Индикатор  Price Bars and Chart Patterns  работает на всех тайм-фреймах.Входные параметры отсутствуют. Индикатор  Price Bars and Chart Patterns  самостоятельно проделывает р
    FinArk Support and Resistance is an indicator that will detect support and resistance zone that are drawn on the chart by automatic. Supply Demand uses previous price action to identify potential imbalances between buyers and sellers. This trend detection indicator will compliment any strategy and can also be used as an independent tool.  We can enter in good price with this Indicator, in order to follow the   strong demand   on the current instrument. 
    Индикатор "BO  indicator at zero bar" для торговли бинарных опционов. Индикатор выдаёт свои сигналы на нулевом баре не перерисовывает и не меняет свои показатели при переключении временных периодов. Рекомендую использовать индикатор совместно с другим индикатором как фильтр  "BO indicator at zero bar" indicator for binary options trading. The indicator gives its signals on the zero bar, does not redraw and does not change its indicators when switching time periods. I recommend using the indicato
    As the title says, this is an indicator that shows the current open market (session). It has 4 sessions with customizable schedule : 1. London session, 2. New York session, 3. Sydney session, 4. Tokyo session. Indicator inputs: - The color of each session. - The open time and close time of the sessions. - The line width. The objective of the indicator, is to follow each sessions, observe at what times are multiple sessions open, and thus take the chance of the high market movements.
    FREE
    Fibonacci retracement is really one of the most reliable technical analysis tools used by traders. The main problem with using these levels in trading is that you need to wait until the end of the impulse movement to calculate the retracement levels, making difficult to take a position for limited retracement (0.236 or 0.382). Fibo Dynamic solves this problem. Once the impulse movement is identified the retracement levels are automatically updated allowing very dynamic trading in trends with onl
    FREE
    Ценовое действие - одна из самых популярных концепций в торговле. Для торговли по ценовому действию крайне важны свечные паттерны. Свечной паттерн представляет собой ценовое действие в пределах одного или иногда нескольких баров, графически отображаемое на свечном графике, которое трейдеры используют в торговле. Входные параметры On Alert - true/false, отображение уведомления в отдельном окне. Send Message - интервал для отправки сообщений: 5 минут / 15 минут / 30 минут / 1 час. Patterns Rever
    Данный индикатор создан для поиска предполагаемых разворотных точек цены символа. В его работе используется небольшой разворотный свечной паттерн в совокупности с фильтром экстремумов. Индикатор не перерисовывается! В случае отключения фильтра экстремумов, индикатор показывает все точки, в которых есть паттерн. В случае включения фильтра экстремумов, работает условие – если в истории на Previous bars 1 свечей назад, были более высокие свечки и они дальше чем свеча Previous bars 2 – то тогда тако
    FREE
    KFX Pattern manual
    Marcel Kirchhof
    5 (1)
    KFX PATTERN - это утилита для ручной работы на основе ценовых моделей. Ручная работа означает, что утилита не открывает сделок самостоятельно. Она только показывает отдельные уровни со значениями целевой прибыли. Индивидуальные стратегии основаны на книгах Томаса Булковского. Утилита распознает следующие модели: Three Falling Peaks. Three Rising Valleys. Diamond Pattern. High and Tight Flags. Cup with Handle Pattern. Horn Top. Horn Bottom. Earnings Flag. Three Line Strike. Falling Three Methods.
    Уверенная торговля с помощью уровней поддержки и сопротивления! Представляем вашему вниманию индикатор   "Уровни поддержки и сопротивления" , который станет вашим незаменимым помощником в мире трейдинга. Индикатор автоматически определяет ключевые уровни поддержки и сопротивления , на основе которых вы сможете: Совершать точные сделки:   Вход в рынок на уровнях поддержки и сопротивления значительно повышает шансы на успешную торговлю. Определять трендовые движения:   Прорыв или отскок от уровне
    Tron Scalper  -  индикатор предназначенный для  скальпинга . Индикатор дающий сигналы на основе показаний целого комплекса стандартных и авторских инструментов. Xарактеристики  Tron Scalper : Аналитические функции Может использоваться на любых валютных парах и тайм-фреймах; Индикатор не перерисовывается; Графические возможности Занимает минимальное кол-во места на графике; Гибкие настойки; Легкий в усвоении;    Tron Scalper состоит из Голубая линия – индикатор RSI; Оранжевая линия – консолид
    Candlestick Patterns MT4 - простой и удобный индикатор свечных моделей, находит 29 свечных моделей. Индикатор выгодно отличается следующим Находит и помечает на графике 29 свечных моделей; Обозначает стрелкой каноническое направление торговли; Каждая свечная модель может быть отключена в настройках; Индикатор можно использовать в качестве стрелочного индикатора в советниках. Параметры TextSize - размер текста на графике; TextColor - цвет текста на графике; Alert - включить/отключить алерты;
    --- FREE VERSION - WORKS ONY ON EURUSD ------------------------------------------------------------------- This is a unique breakout strategy that is used for determination of the next short term trend/move. The full system is available on MQL5 under the name "Forecast System". Here is the link -->  https://www.mql5.com/en/market/product/104166?source=Site Backtest is not possible, because calculations are done based on the data of all timeframes/periods. Therefore I propose you use the technol
    FREE
    Гармонические паттерны наилучшим образом используются для прогнозирования точек разворота рынка. Они обеспечивают высокую вероятность успешных сделок и множество возможностей для торговли в течение одного торгового дня. Наш индикатор идентифицирует наиболее популярные гармонические паттерны, основываясь на книгах о Гармоническом трейдинге. ВАЖНЫЕ ЗАМЕЧАНИЯ: Индикатор не перерисовывается, не отстает (он обнаруживает паттерн в точке D) и не изменяется (паттерн либо действителен, либо отменен). КАК
    FREE
    Necessary for traders: tools and indicators Waves automatically calculate indicators, channel trend trading Perfect trend-wave automatic calculation channel calculation , MT4 Perfect trend-wave automatic calculation channel calculation , MT5 Local Trading copying Easy And Fast Copy , MT4 Easy And Fast Copy , MT5 Local Trading copying For DEMO Easy And Fast Copy , MT4 DEMO Easy And Fast Copy , MT5 DEMO Strongly recommend trend indicators,   automatic calculation of wave standard   and   MT5 ve
    FREE
    BUY INDICATOR AND GET EA FOR FREE AS A BONUS + SOME OTHER GIFTS! ITALO LEVELS INDICATOR  is the best levels indicator ever created, and why is that? Using high volume zones on the market and Fibonacci the Indicator works on all time-frames and assets, indicator built after 7 years of experience on forex and many other markets. You know many levels indicators around the internet are not complete, does not help, and it's difficult to trade, but the   Italo Levels Indicator is different , the Ital
    Triple RSI
    Pablo Leonardo Spata
    1 (1)
    LOOK AT THE FOLLOWING STRATEGY   WITH THIS INDICATOR.   Triple RSI   is a tool that uses the classic Relative Strength Indicator, but in several timeframes to find market reversals.    1.  ️ Idea behind the indicator and its strategy: In Trading, be it Forex or any other asset, the ideal is   to keep it simple, the simpler the better . The   triple RSI   strategy is one of the simple strategies that seek market returns. In our experience, where there is more money to always be won, i
    FREE
    Necessary for traders: tools and indicators Waves automatically calculate indicators, channel trend trading Perfect trend-wave automatic calculation channel calculation , MT4 Perfect trend-wave automatic calculation channel calculation , MT5 Local Trading copying Easy And Fast Copy , MT4 Easy And Fast Copy , MT5 Local Trading copying For DEMO Easy And Fast Copy , MT4 DEMO Easy And Fast Copy , MT5 DEMO Can set the cycle for other varieties of K line graph covered this window, fluctuations obse
    FREE
    WaPreviousCandleLevelsMT4
    Wachinou Lionnel Pyrrhus Sovi Guidi
    !!!The free version works only on "EURUSD"!!! WaPreviousCandleLevels MT4 shows the previous candle levels, it shows the previous candle Open High Low Close levels (OHLC Levels) in different time frame. It's designed to help the trader to analyse the market and pay attention to the previous candle levels in different time frame.  We all know that the OHLC Levels in Monthly, Weekly and Daily are really strong and must of the time, the price strongly reacts at those levels. In the technical analys
    FREE
    Ppr PA
    Yury Emeliyanov
    4 (1)
    "Ppr PA" – это уникальный технический индикатор, созданный для выявления паттернов " PPR " на валютных графиках торговой платформы МТ4. Эти паттерны могут указывать на возможные развороты или продолжения тренда, предоставляя трейдерам ценные сигналы для входа в рынок. Особенности: Автоматическое Обнаружение PPR: Индикатор автоматически идентифицирует и отмечает паттерны PPR стрелками на графике. Визуальные Сигналы: Зеленые и красные стрелки обозначают оптимальные точки для покупки и продажи соот
    FREE
    Индикатор GTAS FidTdi использует сочетание волатильности и потенциальных уровней коррекции. Этот индикатор был создан Бернардом Пратсом Деско (Bernard Prats Desclaux), трейдером и бывшим менеджером хедж-фонда, основателем E-Winvest. Описание Индикатор представлен собой красную или зеленую огибающую выше или ниже цены. Инструкция по применению Обнаружение тренда Когда огибающая зеленого цвета, тренд бычий. Когда она красная, тренд медвежий. Торговля После открытия сделки GTAS FibTdi показыв
    FREE
    AQ Pattern Explorer
    HIT HYPERTECH INNOVATIONS LTD
    3.67 (3)
    Pattern Explorer – надежный инструмент для применения всех возможностей самых популярных свечных паттернов . Для подтверждения всех паттернов используются алгоритмы машинного обучения. Выберите тейк-профит и стоп-лосс и нажмите кнопку Backtest your strategy (протестировать стратегию на истории) для тестирования стратегии на истории в реальном времени и увидеть следующие данные (в зависимости от настроек): Общее число сигналов Сигналы, достаточно надежные для тестирования Прибыльные сигналы (%) У
    FREE
    The " YK Find Support And Resistance " indicator is a technical analysis tool used to identify key support and resistance levels on a price chart. Its features and functions are as follows: 1. Displays support and resistance levels using arrow lines and colored bands, with resistance in red and support in green. 2. Can be adjusted to calculate and display results from a specified timeframe using the forced_tf variable. If set to 0, it will use the current timeframe of the chart. 3. Uses t
    FREE
    С этим продуктом покупают
    Gann Made Easy - это профессиональная, но при этом очень простая в применении Форекс система, основанная на лучших принципах торговли по методам господина У.Д. Ганна. Индикатор дает точные BUY/SELL сигналы, включающие в себя уровни Stop Loss и Take Profit. Пожалуйста, напишите мне после покупки! Я поделюсь своими рекомендациями по использованию индикатора. Также вас ждет отличный бонусный индикатор в подарок! Вероятно вы уже не раз слышали о торговли по методам Ганна. Как правило теория Ганна от
    Golden Trend Indicator
    Noha Mohamed Fathy Younes Badr
    5 (8)
    Golden Trend indicator  is The best indicator for predicting trend movement this indicator never lags and never repaints and never back paints    and give  arrow buy and sell    before the candle appear  and it will help you and  will make your trading decisions clearer its work on all currencies and  gold and crypto and all time frame This unique  indicator uses very secret algorithms to catch the  trends, so you can trade using this indicator and see the trend clear on charts  manual guide and
    - Real price is 80$ - 40% Discount ( It is 49$ now ) Contact me for instruction, add group and any questions! Related Products:  Bitcoin Expert , Gold Expert Introduction The breakout and retest strategy is traded support and resistance levels. it involves price breaking through a previous level.  The break and retest strategy is designed to help traders do two main things, the first is to avoid false breakouts. Many false breakouts start with a candlestick that breaks out of a level but ends w
    After your purchase, feel free to contact me for more details on how to receive a bonus indicator called VFI, which pairs perfectly with Easy Breakout for enhanced confluence!   Easy Breakout is a powerful price action trading system built on one of the most popular and widely trusted strategies among traders: the Breakout strategy ! This indicator delivers crystal-clear Buy and Sell signals based on breakouts from key support and resistance zones. Unlike typical breakout indicators, it leve
    TPSproTREND PrO
    Roman Podpora
    4.79 (19)
    TPSpro TREND PRO   —  трендовый индикатор, который автоматически анализирует рынок и предоставляет информацию о тренде и каждой его смене а также дающий сигналы для входа в сделки без перерисовки! Индикатор использует каждую свечу, анализируя их отдельно. относя к разным импульсам – импульс вверх или вниз. Точные точки входа в сделки  для  валют, крипты, металлов, акций, индексов! INSTRUCTIONS     RUS   -    ENG         Рекомендуем использовать с  индикатором -  RFI LEVELS Version MT5 Осно
    Важным ключевым элементом в трейдинге являются зоны или уровни, от которых принимаются решения о покупке или продаже торгового инструмента. Несмотря на попытки крупных игроков скрыть свое присутствие на рынке, они неизбежно оставляют следы. Наша задача заключалась в том, чтобы научиться находить эти следы и правильно их интерпретировать. INSTRUCTIONS     RUS   -    ENG                    Рекомендуем использовать с индикатором -   TPSpro  TREND PRO -  Version MT5 Основные функции: Отображения ак
    Dynamic Forex28 Navigator — инструмент для торговли на рынке Форекс нового поколения. В НАСТОЯЩЕЕ ВРЕМЯ СКИДКА 49%. Dynamic Forex28 Navigator — это эволюция наших популярных индикаторов, объединяющая мощь трех в одном: Advanced Currency Strength28 Indicator (695 отзывов) + Advanced Currency IMPULSE with ALERT (520 отзывов) + CS28 Combo Signals (бонус). Подробности об индикаторе https://www.mql5.com/en/blogs/post/758844 Что предлагает индикатор Strength нового поколения?  Все, что вам нрав
    Ultimate Sniper Dashboard
    Hispraise Chinedum Abraham
    4.82 (22)
    Скидка $299! Цены могут вырасти в будущем! Читайте описание ниже! Лучшая система ввода для Ultimate Sniper Dashboard: ПРЕДЕЛЬНЫЕ ДИНАМИЧЕСКИЕ УРОВНИ. (Пожалуйста, проверьте мои продукты) Ultimate Sniper Dashboard работает ТОЛЬКО на реальных рынках из-за ограничений мультивалютного тестирования MT4. Представляем вам Ultimate-Sniper Dashboard! Наша самая лучшая панель, которая содержит HA-Sniper, MA-Sniper и множество специальных режимов. Ultimate Sniper Dashboard - это абсолютный зверь!
    Инновационный индикатор, использующий эксклюзивный алгоритм для быстрого и точного определения тренда. Индикатор автоматически рассчитывает время открытия и закрытия позиций, а также подробную статистику работы индикатора на заданном отрезке истории, что позволяет выбрать наилучший торговый инструмент для торговли. Вы также можете подключить свои пользовательские стрелочные индикаторы к Scalper Inside Pro для проверки и расчета их статистики и прибыльности. Scalper Inside PRO (версии 6.5 и выше)
    Раскройте всю мощь FX Power NG: лучший измеритель силы валют Уже более восьми лет FX Power предоставляет трейдерам по всему миру надежный и точный анализ силы валют. Теперь FX Power NG выводит этот надежный инструмент на новый уровень, предлагая расширенные функции, которые обеспечивают непревзойденную точность, настройку и понимание вашей торговли. Что делает FX Power NG обязательным для серьезных трейдеров? FX Power NG основывается на всем том, что вы любили в оригинальном FX Power, с ключ
    Bull versus Bear
    Mohamed Hassan
    4.47 (17)
    Enjoy a   50% OFF   Christmas holiday sale!   Send us a message after your purchase to receive more information on how to get your  BONUS  for FREE  that works in great combination with Bull vs Bear ! Bull versus Bear is an easy-to-use Forex indicator that gives traders clear and accurate signals based on clear trend retests . Forget about lagging indicators or staring at charts for hours because  Bull vs Bear provides real-time entries with no lag and no repaint, so you can trade with conf
    В настоящее время скидка 20%! Лучшее решение для новичка или трейдера-эксперта! Эта приборная панель работает на 28 валютных парах. Он основан на 2 наших основных индикаторах (Advanced Currency Strength 28 и Advanced Currency Impulse). Он дает отличный обзор всего рынка Forex. Он показывает значения Advanced Currency Strength, скорость движения валюты и сигналы для 28 пар Forex на всех (9) таймфреймах. Представьте, как улучшится ваша торговля, когда вы сможете наблюдать за всем рынком с пом
    Trend Reversal – Ваш помощник в определении разворотов тренда на MT4 Ищете мощный и интуитивно понятный инструмент для улучшения анализа рынка и принятия более осознанных решений? Индикатор Trend Reversal специально разработан для трейдеров, которые хотят точно определять точки разворота тренда прямо на платформе MetaTrader 4. Благодаря сочетанию продвинутых алгоритмов и проверенных техник Trend Reversal предоставляет четкие и видимые сигналы, помогающие распознавать ключевые рыночные моменты.
    FX Volume
    Daniel Stein
    4.58 (33)
    Получите истинное преимущество на Forex с помощью FX Volume: Лучший индикатор объема FX Volume - это первый и единственный индикатор объема, который показывает истинное настроение рынка с точки зрения инсайдера. Предоставляя уникальную информацию о позиционировании институциональных участников рынка и брокеров, FX Volume позволяет вам торговать с такой прозорливостью, которая обычно присуща крупным игрокам. Попрощайтесь с задержками с отчетами COT - FX Volume предоставляет вам эту важную инфор
    Enigmera
    Ivan Stefanov
    5 (3)
    ЭНИГМЕРА: ядро рынка https://www.enigmera.com Введение Этот индикатор и торговая система представляют собой удивительный подход к финансовым рынкам. ENIGMERA использует фрактальные циклы для точного расчета уровней поддержки и сопротивления. Он показывает подлинную фазу накопления и дает направление и цели.  Система, которая работает независимо от того, находимся ли мы в тренде или в коррекции.  Как она работает? ENIGMERA состоит из трех линий: линии поддержки/сопротивления, линии цели и ли
    Станьте Breaker Trader и получайте прибыль от изменений структуры рынка по мере изменения цены. Индикатор выключателя блока ордеров определяет, когда тренд или движение цены приближаются к истощению и готовы развернуться. Он предупреждает вас об изменениях в структуре рынка, которые обычно происходят, когда произойдет разворот или серьезный откат. Индикатор использует собственный расчет, который определяет прорывы и ценовой импульс. Каждый раз, когда новый максимум формируется около возможн
    TrendMaestro
    Stefano Frisetti
    5 (3)
    note: this indicator is for METATRADER4, if you want the version for METATRADER5 this is the link:  https://www.mql5.com/it/market/product/108106 TRENDMAESTRO ver 2.4 TRENDMAESTRO recognizes a new TREND in the bud, he never makes mistakes. The certainty of identifying a new TREND is priceless. DESCRIPTION TRENDMAESTRO identifies a new TREND in the bud, this indicator examines the volatility, volumes and momentum to identify the moment in which there is an explosion of one or more of these data a
    Данный индикатор находит и отрисовывает зоны , так сказать места силы, где цена будет разворачиваться. Индикатор может работать на любом графике, любом инструменте, любом таймфрейме. Индикатор имеет два режима. Индикатор оснащен панелью управления с кнопками для удобства и разбит на два режима. Ручной и авто. Ручной режим: Для работы с ручным режимом необходимо нажать кнопку NEW, появится отрезок. Данный отрезок натягиваете на движение и нажимаете кнопку LVL. Отрисовывается уровень. Авто режим:
    Оставьте комментарий после покупки, чтобы получить 4 высококачественных индикатора в качестве бонуса. Индикатор Chart Patterns All-in-One помогает трейдерам визуализировать различные графические модели, которые широко используются в техническом анализе. Он помогает определить возможное поведение рынка, но не гарантирует прибыльность. Рекомендуется протестировать индикатор в демо-режиме перед покупкой. Текущая акция : Скидка 50% на индикатор "Chart Patterns All in One". Включенные модели : Модель
    Trend Screener
    STE S.S.COMPANY
    4.81 (89)
    Индикатор тренда, революционное уникальное решение для торговли и фильтрации тренда со всеми важными функциями тренда, встроенными в один инструмент! Это 100% неперерисовывающийся мультитаймфреймный и мультивалютный индикатор, который можно использовать на всех инструментах/инструментах: форекс, товары, криптовалюты, индексы, акции. ПРЕДЛОЖЕНИЕ ОГРАНИЧЕННОГО ВРЕМЕНИ: Индикатор скринера поддержки и сопротивления доступен всего за 50$ и бессрочно. (Изначальная цена 250$) (предложение продлено) Tre
    В НАСТОЯЩЕЕ ВРЕМЯ СКИДКА 20%! Лучшее решение для новичка или трейдера-эксперта! Этот индикатор специализирован для отображения силы валюты для любых символов, таких как экзотические пары, товары, индексы или фьючерсы. Впервые в своем роде, любой символ может быть добавлен в 9-ю строку, чтобы показать истинную силу валюты золота, серебра, нефти, DAX, US30, MXN, TRY, CNH и т.д. Это уникальный, высококачественный и доступный торговый инструмент, потому что мы включили в него ряд собственных функци
    Прежде всего стоит подчеркнуть, что этот Торговый Инструмент является Неперерисовывающимся Нерепейнтинговым Индикатором, что делает его идеальным для профессиональной торговли. Онлайн-курс, руководство пользователя и демонстрация. Индикатор Концепций Умного Действия Цены - очень мощный инструмент как для новичков, так и для опытных трейдеров. Он объединяет более 20 полезных индикаторов в одном, комбинируя передовые торговые идеи, такие как анализ Inner Circle Trader и стратегии торговли конц
    Merry Christmas Deals:   ALL PRODUCTS   priced at   $35 ! Индикатор Volumetric Order Blocks Multi Timeframe – мощный инструмент, предназначенный для трейдеров, стремящихся получить глубокие инсайты о рыночном поведении, выявляя ключевые ценовые области, где значительные участники рынка накапливают ордера. Эти области, известные как объемные блоки ордеров, могут служить потенциальными зонами поддержки и сопротивления, предоставляя важное преимущество для принятия обоснованных торговых решений. С
    В настоящее время скидка 20%! Эта приборная панель - очень мощное программное обеспечение, работающее на нескольких символах и до 9 таймфреймов. Он основан на нашем основном индикаторе (Лучшие отзывы: Advanced Supply Demand ).   Приборная панель дает отличный обзор. Она показывает:  Отфильтрованные значения спроса и предложения, включая рейтинг силы зон, расстояния между пунктами в зонах и внутри зон, Выделяются вложенные зоны, Выдает 4 вида предупреждений для выбранных символов на всех (9)
    Ultimate Dynamic Levels
    Hispraise Chinedum Abraham
    4.7 (10)
    В настоящее время праздничная скидка составляет $399! Цены могут вырасти в будущем. Читайте описание ниже!   Представляем Ultimate Dynamic Levels - ЛУЧШИЙ индикатор входов для Ultimate Sniper Dashboard! Чрезвычайно низкий риск своевременных входов и высокий RR!!! Найдите Ultimate Sniper Dashboard ЗДЕСЬ. Самая важная способность как для начинающих, так и для профессиональных трейдеров - точно определить, где и когда рынок, скорее всего, развернется, и как безопасно войти в рынок и выйти из нег
    Enjoy a   50% OFF   Christmas holiday sale!   This Indicator only places quality trades when the market is really in your favor with a clear break and retest. Patience is key with this price action strategy! If you want more alert signals per day, you increase the number next to the parameter called: Support & Resistance Sensitivity.  After many months of hard work and dedication, we are extremely proud to present you our  Break and Retest price action indicator created from scratch. One of t
    Gold Stuff
    Vasiliy Strukov
    4.86 (247)
    Gold Stuff - трендовый индикатор, разработанный специально для золота, также может использоваться на любых финансовых инструментах. Индикатор не перерисовывается и не запаздывает. Рекомендуемый тайм-фрейм H1.  По данному индикатору написан советник EA Gold Stuff, Вы можете найти его в моем профиле. Свяжитесь со мной сразу после покупки для получения   персонального бонуса!  Вы можете получить бесплатную копию нашего индикатора Strong Support and Trend Scanner, пожалуйста, в личку. мне! Настройки
    Advanced Supply Demand
    Bernhard Schweigert
    4.91 (294)
    Этот индикатор является уникальным, качественным и доступным инструментом для торговли, включающим в себя наши собственные разработки и новую формулу. В обновленной версии появилась возможность отображать зоны двух таймфреймов. Это означает, что вам будут доступны зоны не только на старшем ТФ, а сразу с двух таймфреймов - таймфрейма графика и старшего: отображение вложенных зон. Обновление обязательно понравится всем трейдерам, торгующим по зонам спроса и предложения. Важная информация Для мак
    Stratos Pali Indicator   is a revolutionary tool designed to enhance your trading strategy by accurately identifying market trends. This sophisticated indicator uses a unique algorithm to generate a complete histogram, which records when the trend is Long or Short. When a trend reversal occurs, an arrow appears, indicating the new direction of the trend. Important Information Revealed Leave a review and contact me via mql5 message to receive My Top 5 set files for Stratos Pali at no cost! D
    IMPORTANT; Price is subject to rise at any time from now! Do not miss this offer! Dear trader I am glad to introduce my new tool called Trend Analyser Dashboard to you. The design, style, and settings of this indicator  have been made simple to make its users not take too much time in understanding the indicator itself.   The purpose is to help traders in analysing the direction of the major trend and the status of the trend whether in weak trend or its strong trend. The indicator will also prov
    Другие продукты этого автора
    FZR indicator determines fractal zigzag reversal pattern of all the time frames of the chosen symbol and shows the information in the Info label. Indicator draws the detected pattern in the chosen time frame and also you can select in the menu to draw the trend line according to FZR peaks. What it is FZR? See the first picture in the screenshots. As you can see for every peak of FZR the AO indicator must cross zero line. FZR indicator determines the trend direction. How to use FZR for trading?
    FREE
    Indicator SR levels true in small time frames is very useful for scalping while in bigger ones it is good for day or position trading. SR levels true can draw 4 support/resistance levels based on defined maximum rebouds from price level. Indicator scans  defined number of bars in time axis and defined number of pips in price axis (both sides - up and down) and calculates how much times price was rejected from scanned price levels. At the price levels where maximum rebounds are counted, support
    FREE
    Pivot levels
    Egidijus Bikulcius
    4.5 (2)
    Pivot levels is indicator showing 7 pivot levels. It is adjusted for major use, including: all standard time frames choice of periods to show three popular calculation formulas (typical, median, weighted) 9 level Camarilla pivot pivot day shift choice of properties for lines and labels choice of showing alerts when crossing pivot lines Parameters: ----------Main parameters----------- Timeframe - time frame for pivot levels Number of periods to show - displays pivot levels for number of period
    FREE
    Candle Pattern Alert indicator alerts when the last price closed candle matches the set input parameters. You can choose to scan through all the symbols in Market Watch or enter your favorite symbols and also you can enter time frames you need to scan. --------- Main settings- ------- Select all symbols from Market Watch? - if Yes the program scans through all the symbols displayed in Market Watch, if No - only selected in next input symbols are scanned Enter symbols separated by commas - enter
    FREE
    FZR indicator determines fractal zigzag reversal pattern of all the time frames of the chosen symbol and shows the information in the Info label. Indicator draws the detected pattern in the chosen time frame and also you can select in the menu to draw the trend line according to FZR peaks. What it is FZR? See the first picture in the screenshots. As you can see for every peak of FZR the AO indicator must cross zero line. FZR indicator determines the trend direction. How to use FZR for trading?
    Pivot levels indicator shows 7(9 for Camarilla) pivot levels. It is adjusted for major use, including: all standard time frames choice of periods to show four popular calculation formulas (typical, median, weighted and Camarilla) pivot day shift choice of properties for lines and labels choice of showing alerts when crossing pivot lines Parameters: ----------Main parameters----------- Timeframe - time frame for pivot levels Number of periods to show - displays pivot levels for number of perio
    Indicator SR levels true in small time frames is very useful for scalping while in bigger ones it is good for day or position trading. SR levels true can draw 4 support/resistance levels based on defined maximum rebouds from price level. Indicator scans  defined number of bars in time axis and defined number of pips in price axis (both sides - up and down) and calculates how much times price was rejected from scanned price levels. At the price levels where maximum rebounds are counted, support
    Candle Pattern Alert indicator alerts when the last price closed candle matches the set input parameters. You can choose to scan through all the symbols in Market Watch or enter your favorite symbols and also you can enter time frames you need to scan. ---------Main settings-------- Select all symbols from Market Watch? - if Yes the program scans through all the symbols displayed in Market Watch, if No - only selected in next input symbols are scanned Enter symbols separated by commas - enter s
    A Swing Failure Pattern ( SFP ) is a trade setup in which big traders hunt stop-losses above a key swing high or below a key swing low for the purpose of generating the liquidity needed to push price in the opposite direction. When price 1) pierces above a key swing high but then 2) closes back below that swing high, we have a potential bearish SFP . Bearish SFPs offer opportunities for short trades. When price 1) dumps below a key swing low but then 2) closes back above that swing low, we have
    Indicator Constant TF Moving Average basically is the same Moving Average indicator, but differently it always shows the price values of chosen time frame. Also, number of periods to show can be selected. Indicators purpose is to use it as support and resistance level in smaller time frames than selected in Input menu. How it looks like you can see in screenshots and video. ---------Main settings-------- Timeframe - choose time frame from dropdown menu Number of periods to show - enter the integ
    Impulse Fibo indicator is used to determine price levels after some price impulse occurs. How to use it you can see in screenshots and video. In the indicator setup you can fix two different setups for two different patterns. For drawing convenience also two different rectangles can be easy put on the screen to draw support/resistance levels. . Inputs Draw pattern 1 Line color - choose color from dropdown menu Line style - choose style from dropdown menu Line width - enter integer number 1,2
    Pinbar Outside Pattern indicator shows in a table symbol, time frame and direction of the last price candle if it matches outside pinbar input parameters. Outside pinbar means that the candle is extreme in the chosen time frame. By clicking ' Open chart ' button you can view drawn pattern. You can choose to scan through all the symbols in Market Watch or enter your favorite symbols, and also you can enter time frames you need to scan. ---------Main settings-------- Select all symbols from Market
    Фильтр:
    GillC
    21
    GillC 2024.06.04 07:20 
     

    I keep getting multiple alerts about symbols I didn't select in the settings such as Symbol CADCHF not valid or not selected in Market Watch. Please enter correct name. Giving good review in the hopes that I will get a prompt reply!

    So it's still not working. It is now saying I have the incorrect timeframe format- timeframe not valid. It's showing zero patterns and I have all on market watch selected so that's most unlikely!

    Egidijus Bikulcius
    8972
    Ответ разработчика Egidijus Bikulcius 2024.06.04 13:30
    So check the symbols names that are entered in the input: Enter symbols separated by commas. The name must be the same as in Market Watch. Try one to few symbols for the beginning. Also please view the video. Before loading indicator for the first time it is advisable to load some history for every symbol by scrolling charts backwards.
    Check TF format - it must be like M15,H1,H4,D1,W1,MN1. The big TF can show sometimes errors, because there is not enough history on the chart. Now there are patterns on AUDUSD H1 and EURGBP W1.
    kot2303
    20
    kot2303 2022.03.24 06:40 
     

    орабатывает

    orangeedge
    240
    orangeedge 2020.12.23 12:56 
     

    Great indicator. Does exactly as described. Like the continuous updates.

    Евгений Колосков
    25
    Евгений Колосков 2020.12.14 13:22 
     

    хороший индикатор. конечно я бы кое что добавил. но в общем работает стабильно.

    Ответ на отзыв
    Версия 1.25 2020.11.06
    On SFP pattern detection send push notification option added.
    You have to configure your Push notifications settings in Tools/Options/Notifications.
    Версия 1.24 2020.07.07
    New features added are intended only for programmers to use indicator in EA. There are 3 buffers added:
    • Buffer 0 for signal – returned values can be 1 for buy and 2 for sell
    • Buffer 1 for stop loss reference – returned value is of the last price peak
    • Buffer 2 for take profit reference – returned value is of the second price peak from the last one
    So iCustom indicator in your EA have to look:
    iCustom(NULL,0," SFP_Pattern","Algo",0,”Symbol name”,”TF_Period”,0,0)

    Where parameters are:
    • NULL – current symbol (no matter for output)
    • 0 – current timeframe (no matter for output)
    • " SFP_Pattern" - indicator name, relative to the root indicators directory (MQL4/Indicators/)
    • "Algo" – first parameter of SFP pattern indicator
    • 0 – second parameter
    • ”Symbol name” – third parameter, enter exact name of the symbol that is shown in Market Watch
    • ”TF_Period” – fourth parameter, enter timeframe period you need in the format: “M1”,”M5”, “M15”,”M30”, “H1”,”H4”, “D1”,”W1” or ”MN1”.
    • Other SFP_Pattern parameters can be omitted
    • 0 – buffer number, can be 0, 1 or 2
    • 0 – shift, use only 0
    Example how to use:
    input string TF_Period="H1"; //Timeframe
    input string Symbol_name="EURUSD"; //Symbol name
    input double K_ATR_SL=1.5; //Multiplier for stop loss in ATR values
    //buy signal
    If (iCustom(NULL,0,"SFP_Pattern","Algo",0,Symbol_name,TF_Period,0,0)==1)
    {
    double StopLoss = iCustom(NULL,0,”SFP_Pattern","Algo",0,Symbol_name,TF_Period,1,0) - K_ATR_SL*iATR(Symbol_name,PERIOD_H1,14,1); //use the same Symbol_name and TF_Period in iATR
    double TakeProfit = iCustom(NULL,0,"SFP_Pattern","Algo",0,Symbol_name,TF_Period,2,0);
    int result = OrderSend(Symbol(),OP_BUY,volume,Ask,Slippage,NormalizeDouble(StopLoss,Digits),NormalizeDouble(TakeProfit,Digits)," SFP_Pattern",MagicNumber,0,Blue);
    }
    //sell signal


    Версия 1.23 2020.03.18
    By default indicator will draw pattern on current chart if detected.
    An option to mark the place for stop loss in ATR units is added.
    Версия 1.21 2020.03.05
    Some drawing error repaired.
    Версия 1.2 2020.03.03
    Info dashboard is created for SFP patterns. You can choose to show your favorite symbols and time frames. Also you can choose to show alert or send an email when new SFP pattern is detected.
    Версия 1.1 2019.12.14
    On alert send email option added.
    You have to configure your email settings in Tools/Options/Email.