• Обзор
  • Отзывы
  • Обсуждение
  • Что нового

KT Stoch Divergence MT5

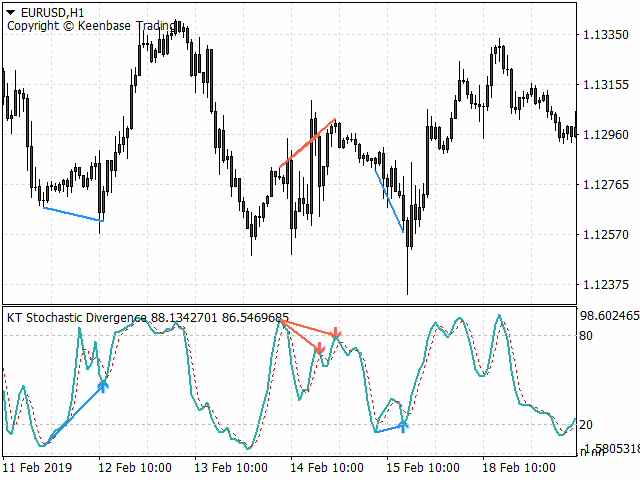
Дивергенция — это один из важных сигналов, указывающих на возможный разворот цены на рынке. KT Stoch Divergence показывает обычные и скрытые дивергенции между ценой и стохастическим осциллятором.


Ограничения KT Stoch Divergence

Использование дивергенции стохастика в качестве единственного сигнала входа может быть рискованным. Не каждую дивергенцию можно трактовать как сильный сигнал разворота. Для лучших результатов рекомендуется комбинировать с анализом цены и направлением тренда.


Особенности

  • Отмечает обычные и скрытые дивергенции между ценой и стохастическим осциллятором.
  • Подходит для стратегий разворота и продолжения тренда.
  • Полностью совместим с использованием в экспертных советниках.
  • Не симметричные дивергенции игнорируются для повышения точности и снижения визуального шума.
  • Можно использовать как для входа, так и для выхода из рынка.
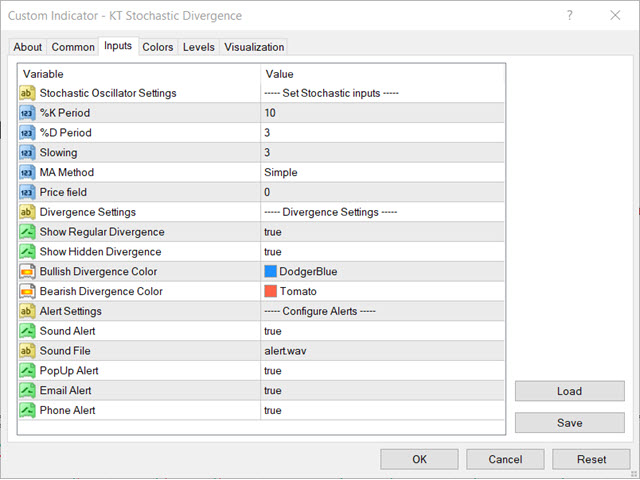
  • Включает все стандартные оповещения MetaTrader.


Что такое дивергенция?

Как правило, если цена обновляет максимумы, осциллятор также должен делать более высокие максимумы. Если цена делает более низкие минимумы, осциллятор также должен показывать более низкие минимумы. Когда этого не происходит — цена и осциллятор расходятся, что называется дивергенцией. Существует два типа дивергенции:


Обычная дивергенция

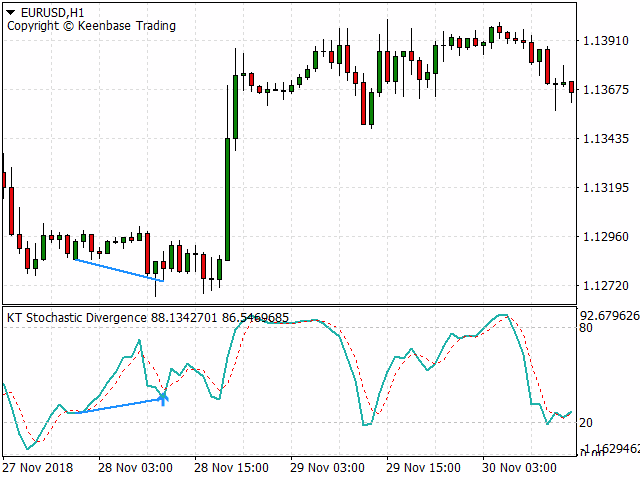
  • Бычья обычная дивергенция: цена делает более низкие минимумы, а осциллятор — более высокие минимумы.
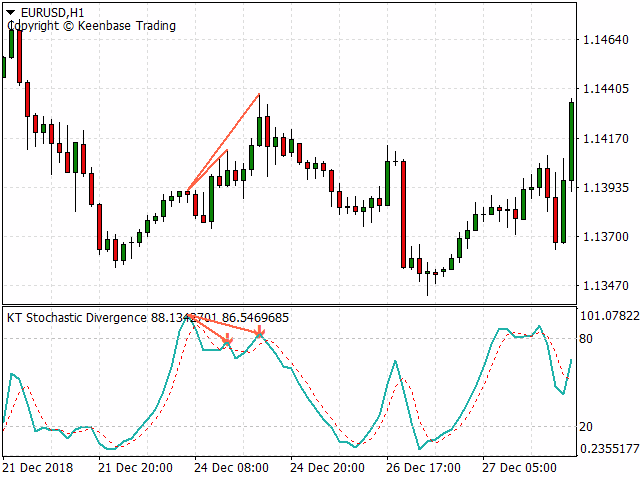
  • Медвежья обычная дивергенция: цена делает более высокие максимумы, а осциллятор — более низкие максимумы.

Скрытая дивергенция

  • Бычья скрытая дивергенция: цена делает более высокие минимумы, а осциллятор — более низкие минимумы.
  • Медвежья скрытая дивергенция: цена делает более низкие максимумы, а осциллятор — более высокие максимумы.
Обычная дивергенция используется для определения разворотов тренда, а скрытая — для подтверждения продолжения текущего тренда. 
Рекомендуем также
Introducing the Consecutive Green/Red Candle Alert Indicator for MT5 - Your Trend Spotting Companion! Are you ready to take your trading to the next level? We present the Consecutive Green/Red Candle Alert Indicator, a powerful tool designed to help you spot trends and potential reversals with ease. Whether you're a new trader looking for clarity in the market or an experienced pro seeking additional confirmation, this indicator is your trusted companion. Key Features of the Consecutive Green
FREE
KT MACD Divergence shows the regular and hidden divergences build between the price and oscillator. If your trading strategy anticipates the trend reversal, you can include the MACD regular divergence to speculate the potential turning points. And if your trading strategy based on the trend continuation, MACD hidden divergence would be a good fit. Limitations of KT MACD Divergence Using the macd divergence as a standalone entry signal can be a risky affair. Every divergence can't be interprete
**  All Symbols  x  All Timeframes  scan just by pressing scanner button ** *** Contact me  to send you instruction and add you in "Wolfe Wave Scanner group" for sharing or seeing experiences with other users. Introduction: A Wolfe Wave is created with five-wave patterns in price. It shows supply and demand and a fight towards a balance price. T hese waves of price actions can help traders identify the boundaries of   the trend . Also  It helps forecast how the price will move in the near futur
Развитие идей, заложенных в популярный индикатор MACD: Находит и наглядно отображает классические и обратные дивергенции (два способа обнаружения дивергенций). Выделяет на индикаторе разными цветами тренд вверх, вниз. Два метода определения тренда: а) MACD пересекает уровень 0 (классический сигнал); б) MACD пересекает свою среднюю (ранний сигнал). Индикатор мультитаймфреймовый - может показывать данные MACD других таймфреймов. Два способа отрисовки индикатора: классическая гистограмма и линия. З
KT Renko Patterns MT5
KEENBASE SOFTWARE SOLUTIONS
KT Renko Patterns анализирует график Ренко кирпич за кирпичиком, чтобы найти известные графические паттерны, которые часто используют трейдеры на различных финансовых рынках. По сравнению с графиками на основе времени, торговля по паттернам на графиках Ренко легче и нагляднее благодаря их чистому виду. KT Renko Patterns включает несколько паттернов Ренко, многие из которых подробно описаны в книге «Профитная торговля с графиками Ренко» авторства Прашанта Шаха. Полностью автоматизированный сове
Сложно найти и дефицит по частоте, дивергенции являются одним из самых надежных торговых сценариев. Этот индикатор автоматически находит и сканирует регулярные и скрытые расхождения, используя ваш любимый осциллятор. [ Руководство по установке | Руководство по обновлению | Устранение неполадок | FAQ | Все продукты ] Легко торговать Находит регулярные и скрытые расхождения Поддерживает много известных генераторов Реализует торговые сигналы на основе прорывов Отображает подходящие уровни стоп-
Tough MACD
Florian Leonhard Schaal
Tough MACD - Advanced MACD with Divergence Detection, by Tough Cookie Traders Tough MACD is a powerful and customizable MACD indicator for MetaTrader 5 that enhances classic MACD analysis by incorporating automatic divergence detection. Designed for traders who rely on momentum and trend reversal signals, this indicator helps identify potential market turning points with visual cues. Key Features: Customizable MACD Settings – Adjust Fast EMA, Slow EMA, and Signal SMA periods to fit your tradin
FREE
Bollinger bands out/in strategy A strategy created by Joe Ross, and very useful for finding trades when the market is overloaded. Indicator You don't need to find where there are entries on the chart, this indicator shows them for you. The entrance The trade is confirmed when the price closes outside the bollinger bands on a candle and the candle after the price closes inside the bands. comment I want to improve this indicator, so you can help me sending me your reviews and comments, thanks :).
FREE
Индикатор SMC Venom Model BPR — профессиональный инструмент для трейдеров, работающих в рамках концепции Smart Money (SMC). Он автоматически идентифицирует на графике цены два ключевых паттерна:  FVG   (Fair Value Gap) — комбинация их трёх свечей, в которой имеется разрыв между первой и третьей свечой. Формирует зону между уровнями, где отсутствует поддержка объемов, что часто приводит к коррекции цены. BPR   (Balanced Price Range)— комбинация двух FVG-паттернов, образующих «мост»  — зону пробо
This indicator can automatically scan the RSI values of all varieties on the mt5 and set an alarm. Note that it is fully automatic scanning, you do not need to enter which varieties, do not need to open the variety chart, as long as there are some varieties in the market quotation column, will be automatically scanned to reach the set rsi alarm value, will pop up the alarm, and cycle with the market changes to scan the latest RSI values of all varieties, and alarm. This is very helpful to fr
Free automatic Fibonacci is an indicator that automatically plots a Fibonacci retracement based on the number of bars you select on the BarsToScan setting in the indicator. The Fibonacci is automatically updated in real time as new highest and lowest values appears amongst the selected bars. You can select which level values to be displayed in the indicator settings. You can also select the color of the levels thus enabling the trader to be able to attach the indicator several times with differe
FREE
Visual Aroon Cross Signal Indicator Price: $65 Discover the power of trend identification and reversal points with the Visual Aroon Cross Signal Indicator! Designed to assist traders in recognizing key market movements, this indicator focuses on the Aroon oscillator’s signal crossing to detect market trends and shifts, offering insights into potential trade setups. Note to Buyers: This indicator is not optimized. It’s a powerful tool crafted for traders to adjust and customize according to thei
Just another   Auto Fibonacci Retracement indicator . However, this is the most   Flexible   &   Reliable   one you can find for FREE. If you use this indicator and you like it, please leave a review/comment. If you just looking for a powerful indicator, please check this   Timeframes Trend Scanner indicator ### FEATURES ### Auto-calculate up to 7 Fibonacci levels on your customized frame. Adjust levels as your need. Use High/Low price or  Open/Close price to calculate. Freeze the levels and don
FREE
AdaptiveMomentumCCI Indicator The AdaptiveMomentumCCI is a custom technical indicator for MetaTrader 5 that enhances the traditional Commodity Channel Index (CCI) by incorporating adaptive period adjustments, momentum analysis, and signal filtering. It calculates a smoothed CCI based on a user-defined price source (e.g., HLC/3, OHLC/4, or close), with its period dynamically adjusted using the Average True Range (ATR) to reflect market volatility. The indicator features a dual-line system with
The indicator illustrates the divergence between the price movements of two financial instruments, such as EURUSD and GBPUSD or US500 and US30 or Gold and Silver. These divergences are plotted in the form of segments on the price chart of the dominant instrument. The dominant instrument refers to the one that exhibits a stronger bullish trend in the case of a bullish divergence, or a stronger bearish trend in the case of a bearish divergence. Investors are encouraged to independently seek correl
Ловец трендов: Стратегия Ловец трендов с индикатором оповещения - это универсальный инструмент технического анализа, который помогает трейдерам определять рыночные тренды и потенциальные точки входа и выхода. Он представляет собой динамичную стратегию Ловец трендов, адаптирующуюся к рыночным условиям для четкого визуального представления направления тренда. Трейдеры могут настраивать параметры в соответствии со своими предпочтениями и уровнем риска. Индикатор помогает в идентификации тренда, с
FREE
FXC iMACD-DivergencE MT5 Indicator This is an advanced MACD indicator that finds trend-turn divergences on the current symbol. The indicator detects divergence between the MACD and the price movements as a strong trend-turn pattern. Main features: Advanced divergence settings Price based on Close, Open or High/Low prices Give Buy/Sell open signals PUSH notifications E-mail sending Pop-up alert Customizeable Information panel Input parameters: MACD Fast-EMA: The Fast-EMA variable of the MACD indi
MACD Intraday Trend PRO - это индикатор, разработанный на основе адаптации оригинального MACD, созданного Джеральдом Аппелем в 1960-х годах. За годы торговли было замечено, что, изменяя параметры MACD с пропорциями Фибоначчи, мы достигаем лучшего представления непрерывности движений тренда, что позволяет более эффективно обнаруживать начало и конец ценового тренда. Благодаря своей эффективности в обнаружении ценовых тенденций, также можно очень четко идентифицировать расхождения вершин и осно
Unlock the full potential of trading with MACD PROject Expert Advisor (EA) , a highly customizable, automated tool based on the popular MACD indicator. The EA is designed with robust filters, allowing traders to manage risks through flexible settings like lot size, stop-loss, take-profit, and session filters. It offers multiple trend confirmation options and trailing stop methods, making it suitable for diverse market conditions. Price : $32 (3 copies left), Next: $99 Full Control Over Your Tra
KT Double Top Bottom MT5
KEENBASE SOFTWARE SOLUTIONS
1 (1)
The double top bottom pattern is arguably one of the technical analysis's most popular chart patterns. These patterns are used to capitalize on recurring patterns and identify trend reversal patterns, thereby creating well-placed entry and exit levels. The KT Double Top Bottom is based on these patterns and fine-tunes the trade signal development process for traders. Features It's based on one of the most reliable trading patterns and brings some fine-tuning and automation to the process. Also
This plots  Fibonacci deviation levels above and below a moving average of the price. Companion indicator to the " Golden Bull Wave Trader "  expert advisor which uses volume\price trend to determine price reversals. https://www.mql5.com/en/market/product/56291 The expert advisor and this indicator were created in order to: Identify ideal and repeatable trade entries with high level of certainty Create a day trading strategy which doesn’t require a hard SL and TP Use alternate risk management me
FXC iDeM-DivergencE MT5 Indicator This is an advanced DeMarker indicator that finds trend-turn divergences on the current symbol. The indicator detects divergence between the DeMarker and the price movements as a strong trend-turn pattern. Main features: Advanced divergence settings Price based on Close, Open or High/Low prices Give Buy/Sell open signals PUSH notifications E-mail sending Pop-up alert Customizeable Information panel Input parameters: DeM Period: The Period size of the DeMarker in
SDivergence Indicator calculates and shows regular divergences and hidden divergences for MACD and Stochastic(for now). The benefit of this indicator is multiple input variables. Using these inputs you can modify to get more adaptive RD and HD's to your strategy. Guide : 1- First put your desired oscillator (MACD or Stochastic or Both) on the chart. 2- Run SDivergence indicator and set corresponding sub-window index of previously put oscillator in SDivergence input window. -Note: the chart sub-w
FREE
DYJ Super Trend Wave - это высокоточная торговая система пиков и долинов. Этот индикатор ищет самые высокие и самые низкие точки свечей при входе и выходе из рынка. Входные цены находятся рядом с самой высокой или самой низкой точкой. Тип уведомления для сигналов был добавлен в dyj supertrend. При создании многопространственного сигнала, Можно использовать следующие типы сигналов уведомления: Alert mailSend, MobilePush. Input InpSignalPeriod = 10 BarDistance = 24 InpIsAlert = true
Тип: осциллятор Индикатор схождения/расхождение скользящих средних Gekko (MACD) — это модифицированная версия знаменитого индикатора MACD. Индикатор сочетает стандартный индикатор MACD с различными расчетами сигналов входа и оповещением о потенциальной точке входа. Входные параметры Fast MA Period - период быстрой скользящей средней индикатора MACD (по умолчанию 12); Slow MA Period - - период медленной скользящей средней индикатора MACD (по умолчанию 26); Signal Average Offset Period - период у
KT Pin Bar MT5
KEENBASE SOFTWARE SOLUTIONS
KT Pin Bar identifies the pin bar formation which is a type of price action pattern which depicts a sign of reversal or rejection of the trend. When combined with support and resistance, BRN and other significant levels, Pin Bar pattern proved to be a very strong sign of reversal. Basically, a pin bar is characterized by a small body relative to the bar length which is closed either in upper or lower 50% part of its length. They have very large wicks and small candle body. A pin bar candlestic
To download MT4 version please click here . - This is the exact conversion from TradingView: "Trend Direction Force Index - TDFI [wm]" By "causecelebre". - The screenshot shows similar results from tradingview and Metatrader when tested on ICMarkets on both platforms. - This indicator uses multiple levels of averaging to detect trend strength. - You can optimize filter low and filter high levels to achieve best results. - You have access to buffers to use in EAs. - This is a light-load processin
As an ICT or SMC trader you must do top-down analysis, and you struggle to make template of drawing object on Metatrader just like you normally do on Tradingview. Well, Drawing Assistance indicator will make your top-down analysis much easier on Metatrader. Allow to design template for 3 timeframes. (HTF, MTF and LTF). Each objects drawn on chart will have the color, style and visibility individually by the timeframe it was drawn on. Save time as all analyzing is done on Metatrader chart. Shortc
Iceberg Divergen MT5
Komang Putra Riswanjaya
3 (1)
Iceberg Divergen Indicator Uncover the hidden opportunities beneath the surface. Overview Divergences in the Awesome Oscillator (AO) often signal powerful market reversals, yet spotting them manually can be challenging and time-consuming. Missing out on these opportunities can cost traders valuable entry points. That’s why we created the   Iceberg Divergence Indicator   — a powerful tool that precisely detects both regular and hidden divergences in AO. With Iceberg Divergence, you won’t just id
FREE
Range Directional Force Indicator – Designed for You to Optimize! The Range Directional Force Indicator is a cutting-edge tool designed to empower traders by visualizing market dynamics and directional strength. Built to offer insights into market trends and reversals, this indicator is an invaluable asset for traders seeking precision in their strategies. However, it is important to note that this indicator is not optimized, leaving room for you to tailor it to your unique trading preferences.
С этим продуктом покупают
Раскройте силу торговли трендами с помощью индикатора Trend Screener: вашего идеального решения для торговли трендами, основанного на нечеткой логике и мультивалютной системе! Повысьте уровень своей торговли по тренду с помощью Trend Screener, революционного индикатора тренда, основанного на нечеткой логике. Это мощный индикатор отслеживания тренда, который сочетает в себе более 13 инструментов и функций премиум-класса и 3 торговые стратегии, что делает его универсальным выбором для превращения
PUMPING STATION – Ваша персональная стратегия "всё включено" Представляем PUMPING STATION — революционный индикатор Forex, который превратит вашу торговлю в увлекательный и эффективный процесс! Это не просто помощник, а полноценная торговая система с мощными алгоритмами, которые помогут вам начать торговать более стабильно! При покупке этого продукта вы БЕСПЛАТНО получаете: Эксклюзивные Set-файлы: Для автоматической настройки и максимальной эффективности. Пошаговое видео-руководство: Научитесь т
Golden Trend Indicator MT5
Noha Mohamed Fathy Younes Badr
4.89 (18)
Golden Trend indicator  is The best indicator for predicting trend movement this indicator never lags and never repaints and never back paints    and give  arrow buy and sell    before the candle appear  and it will help you and  will make your trading decisions clearer its work on all currencies and  gold and crypto and all time frame This unique  indicator uses very secret algorithms to catch the  trends, so you can trade using this indicator and see the trend clear on charts  manual guide and
Разворотные зоны / Пиковые объемы / Активные зоны крупного игрока =  ТС TPSPROSYSTEM ИНСТРУКЦИЯ RUS  /  INSTRUCTIONS  ENG        /       Version MT4    Каждый покупатель этого индикатора получает дополнительно БЕСПЛАТНО:  3 месяцев доступа к торговым сигналам от сервиса RFI SIGNALS — готовые точки входа по алгоритму TPSproSYSTEM. Обучающие материалы с регулярными обновлениями — погружение в стратегию и рост профессионального уровня. Круглосуточная поддержка в будние дни (24/5) и доступ в закрыт
Сейчас 147 долл. США (увеличиваясь до 499 долл. США после нескольких обновлений) - неограниченные учетные записи (ПК или Mac) Руководство пользователя + Обучающие видео + Доступ к приватному Discord-каналу + VIP-статус и мобильная версия + Лицензия на 5 ПК с неограниченным количеством аккаунтов и терминалов MT4. Сколько раз вы покупали индикатор торговли с замечательными обратными тестами, доказательствами производительности на живых счетах и зашикарными цифрами и статистикой, но после исполь
Точки входа по закрытию бара, без перерисовки .  Сканер трендов по всем активам, режим MTF  и многое другое в одном инструменте. Рекомендуем использовать вместе с   RFI LEVELS. ИНСТРУКЦИЯ RUS   /   INSTRUCTIONS  ENG         /        VERSION MT4   Основные функции: Точные сигналы на вход БЕЗ ПЕРЕРИСОВКИ! Если сигнал появился, он остается актуальным! Это важное отличие от индикаторов с перерисовкой, которые могут предоставить сигнал, а затем изменить его, что может привести к потере средств на деп
Скринер поддержки и сопротивления находится в одном индикаторе уровня для MetaTrader, который предоставляет несколько инструментов внутри одного индикатора. Доступные инструменты: 1. Скринер структуры рынка. 2. Зона бычьего отката. 3. Зона медвежьего отката. 4. Ежедневные опорные точки 5. еженедельные опорные точки 6. ежемесячные опорные точки 7. Сильные поддержка и сопротивление, основанные на гармоническом паттерне и объеме. 8. Зоны уровня берега. ПРЕДЛОЖЕНИЕ ОГРАНИЧЕННОЕ ВРЕМЯ: Индикатор подд
Gold Stuff mt5
Vasiliy Strukov
4.93 (178)
Gold Stuff mt5 - трендовый индикатор, разработанный специально для золота, также может использоваться на любых финансовых инструментах. Индикатор не перерисовывается и не запаздывает. Рекомендуемый тайм-фрейм H1.  Свяжитесь со мной сразу после покупки для получения   персонального бонуса!   Вы можете получить бесплатную копию нашего индикатора Strong Support and Trend Scanner, пожалуйста, в личку. мне! Настройки и мануал  здесь ПАРАМЕТРЫ Draw Arrow -   вкл.выкл. отрисовку стрелок на графике. Al
Каждый покупатель этого индикатора получает дополнительно Бесплатно: Авторскую утилиту "Bomber Utility", которая автоматически сопровождает каждю торговую операцию, устанавливает уровни Стоп Лосс и Тейк профит и закрывает сделки согласно правилам этой стратегии, Сет-файлы для настройки этого индикатора на различных активах, Сет-файлы для настройки Bomber Utility в режимы: "Минимум Риска", "Взвешенный Риск" и "Стратегия Выжидания", Пошаговый видео-мануал, который поможет вам быстро установить, на
MONEYTRON – ТВОЙ ЛИЧНЫЙ СИГНАЛ НА УСПЕХ! XAUUSD | AUDUSD | USDJPY | BTCUSD Поддержка таймфреймов: M5, M15, M30, H1 Почему трейдеры выбирают Moneytron? 82% успешных сделок — это не просто цифры, это результат продуманной логики, точного алгоритма и настоящей силы анализа. Автоматические сигналы на вход — не нужно гадать: когда покупать, когда продавать. 3 уровня Take Profit — ты сам выбираешь свой уровень прибыли: безопасный, уверенный или максимум. Четкий Stop Loss — контролируешь риск
FX Power: Анализируйте силу валют для более эффективной торговли Обзор FX Power — это ваш незаменимый инструмент для понимания реальной силы валют и золота в любых рыночных условиях. Определяя сильные валюты для покупки и слабые для продажи, FX Power упрощает принятие торговых решений и выявляет высоковероятные возможности. Независимо от того, хотите ли вы следовать за трендами или предсказывать развороты с использованием экстремальных значений дельты, этот инструмент идеально адаптируется под
FX Volume MT5
Daniel Stein
4.82 (17)
FX Volume: Оцените подлинную динамику рынка глазами брокера Краткий обзор Хотите вывести свою торговлю на новый уровень? FX Volume дает вам информацию в реальном времени о том, как розничные трейдеры и брокеры распределяют свои позиции — задолго до появления запаздывающих отчетов типа COT. Независимо от того, стремитесь ли вы к стабильной прибыли или ищете дополнительное преимущество на рынке, FX Volume поможет выявлять крупные дисбалансы, подтверждать пробои и совершенствовать управление риск
Эта панель показывает последние доступные   гармонические паттерны   для выбранных символов, так что вы сэкономите время и будете более эффективны /   MT4 версия . Бесплатный индикатор:   Basic Harmonic Pattern Колонки индикатора Symbol:   отображаются выбранные символы Trend   :   бычий или медвежий Pattern   :   тип паттерна (Гартли, бабочка, летучая мышь, краб, акула, шифр или ABCD) Entry   :   цена входа SL:   цена стоп-лосса TP1:   цена первого тейк-профита TP2:   цена второго тейк-профи
Представляю Вам отличный технический индикатор GRABBER, который работает, как готовая торговая стратегия "Все включено"! В одном программном коде интегрированы мощные инструменты для технического анализа рынка, торговые сигналы (стрелки), функции алертов и Push уведомлений.  Каждый покупатель этого индикатора получает дополнительно БЕСПЛАТНО:  Grabber Утилиту для автоматического управления открытыми ордерами, Пошаговый видео-мануал : как установить, настроить и торговать, Авторские сет-файлы дл
Следующее поколение автоматизированных зон спроса и предложения. Новый инновационный алгоритм, работающий на любом графике. Все зоны создаются динамически в соответствии с ценовым действием рынка. ДВА ТИПА СИГНАЛОВ --> 1) ПРИ ПОПАДАНИИ ЦЕНЫ В ЗОНУ 2) ПРИ ФОРМИРОВАНИИ НОВОЙ ЗОНЫ Вы не получите еще один бесполезный индикатор. Вы получаете полную торговую стратегию с проверенными результатами.     Новые особенности:     Оповещения, когда цена достигает зоны спроса/предложения     Оповещения
Matrix Arrow Indicator MT5
Juvenille Emperor Limited
5 (13)
Индикатор Matrix Arrow MT5   — это уникальный индикатор тренда 10 в 1, следующий за   100% неперерисовывающимся   индикатором с несколькими таймфреймами, который можно использовать на всех символах/инструментах:   форекс ,  товары ,   криптовалюты ,   индексы ,  акции . Индикатор Matrix Arrow MT5  будет определять текущую тенденцию на ранних этапах, собирая информацию и данные от до 10 стандартных индикаторов, а именно: Индекс среднего направленного движения (ADX) Индекс товарного канала (CCI)
Quantum TrendPulse
Bogdan Ion Puscasu
5 (13)
Представляем   Quantum TrendPulse   , совершенный торговый инструмент, который объединяет мощь   SuperTrend   ,   RSI   и   Stochastic   в один комплексный индикатор, чтобы максимизировать ваш торговый потенциал. Разработанный для трейдеров, которые ищут точность и эффективность, этот индикатор помогает вам уверенно определять рыночные тренды, сдвиги импульса и оптимальные точки входа и выхода. Основные характеристики: Интеграция SuperTrend:   легко следуйте преобладающим рыночным тенденциям и п
Топовый индикатор МТ5, дающий сигналы для входа в сделки без перерисовки! Идеальные точки входа в сделки для  валют, крипты, металлов, акций, индексов !  Смотрите  видео  (6:22) с примером отработки всего одного сигнала, окупившего индикатор. Версия индикатора для MT4 Преимущества индикатора Сигналы на вход без перерисовки Если сигнал появился, он никуда НЕ исчезает! В отличие от индикаторов с перерисовкой, которые ведут к потере депозита, потому что могут показать сигнал, а потом убрать его. Б
ATrend
Zaha Feiz
4.77 (13)
ATREND: Как это работает и как его использовать Как это работает Индикатор "ATREND" для платформы MT5 разработан для предоставления трейдерам надежных сигналов на покупку и продажу с использованием комбинации методов технического анализа. Этот индикатор в первую очередь использует среднюю истинную амплитуду (ATR) для измерения волатильности, наряду с алгоритмами обнаружения тренда для выявления потенциальных движений рынка. Оставьте сообщение после покупки и получите специальный бонусный подаро
WHY IS OUR FXACCCURATE LS MT5 THE PROFITABLE ? PROTECT YOUR CAPITAL WITH RISK MANAGEMENT Gives entry, stop and target levels from time to time. It finds Trading opportunities by analyzing what the price is doing during established trends. POWERFUL INDICATOR FOR A RELIABLE STRATEGIES We have made these indicators with a lot of years of hard work. It is made at a very advanced level. Established trends provide dozens of trading opportunities, but most trend indicators completely ignore them! The
FX Levels: Исключительно точные уровни поддержки и сопротивления для всех рынков Краткий обзор Ищете надежный способ определить уровни поддержки и сопротивления для любых инструментов—валют, индексов, акций или сырьевых товаров? FX Levels сочетает традиционный «Lighthouse» метод с современным динамическим подходом, обеспечивая почти универсальную точность. Благодаря сочетанию опыта реальных брокеров и автоматических ежедневных плюс «в реальном времени» обновлений, FX Levels поможет вам выявлят
Прежде всего стоит подчеркнуть, что этот торговый индикатор не перерисовывается, не перерисовывает и не отставает, что делает его идеальным как для ручной, так и для роботизированной торговли. Руководство пользователя: настройки, вводы и стратегия. Атомный аналитик - это индикатор ценового действия PA, который использует силу и импульс цены, чтобы найти лучший край на рынке. Оборудованный расширенными фильтрами, которые помогают убирать шумы и ложные сигналы, и повышают торговый потенциал. Испо
IX Power MT5
Daniel Stein
4.86 (7)
IX Power: Получите рыночные инсайты для индексов, сырьевых товаров, криптовалют и форекс Обзор IX Power — это универсальный инструмент для анализа силы индексов, сырьевых товаров, криптовалют и форекс. В то время как FX Power предлагает наивысшую точность для валютных пар, используя данные всех доступных пар, IX Power фокусируется исключительно на данных рынка базового символа. Это делает IX Power отличным выбором для некорреляционных рынков и надежным инструментом для форекса, если вам не нуж
FX Dynamic: Отслеживайте волатильность и тренды с помощью настраиваемого ATR-анализа Обзор FX Dynamic — это мощный инструмент, который использует расчёты среднего истинного диапазона (ATR) для предоставления трейдерам непревзойдённой информации о дневной и внутридневной волатильности. Настраивая понятные пороги волатильности (например, 80%, 100% и 130%), вы можете быстро определять потенциальные возможности для прибыли или получать предупреждения, когда рынок выходит за типичные рамки. FX Dyna
Эта панель обнаруживает и отображает на графике зоны   спроса   и   предложения , как в скальпинге, так и в долгосрочном режиме, в зависимости от вашей торговой стратегии для выбранных символов. Кроме того, сканерный режим панели помогает сразу проверить все нужные символы и не пропустить ни одной подходящей позиции /   MT4 версия Бесплатный индикатор:   Basic Supply Demand Особенности Позволяет просматривать торговые возможности по   нескольким валютным парам , давая вам четкое и ясное пред
Прежде всего стоит подчеркнуть, что этот Торговый Инструмент является Неперерисовывающимся Нерепейнтинговым Индикатором, что делает его идеальным для профессиональной торговли. Онлайн-курс, руководство пользователя и демонстрация. Индикатор Концепций Умного Действия Цены - очень мощный инструмент как для новичков, так и для опытных трейдеров. Он объединяет более 20 полезных индикаторов в одном, комбинируя передовые торговые идеи, такие как анализ Inner Circle Trader и стратегии торговли концеп
Trend Hunter  - трендовый индикатор для работы на рынке Forex, криптовалют, CFD. Особенностью индикатора является то, что он уверенно двигается за трендом, не изменяя сигнал при незначительном прокалывании ценой трендовой линии. Индикатор не перерисовывается, сигнал на вход в рынок появляется после закрытия бара. При движении по тренду индикатор показывает дополнительные точки для входа в направлении тренда. По данным сигналам можно торговать с небольшим StopLoss . Trend Hunter   - честный индик
Индикатор Supply Demand использует предыдущее ценовое действие для выявления потенциального дисбаланса между покупателями и продавцами. Ключевым является определение зон с лучшими возможностями, а не просто вероятностей. Индикатор Blahtech Supply Demand обеспечивает функционал, не доступный ни в одной платформе. Этот индикатор 4 в 1 не только выделяет зоны с более высокой вероятностью на основе механизма оценки силы по множественным критериям, но также комбинирует его с мульти-таймфреймовым ана
MetaBands M5
Vahidreza Heidar Gholami
4.5 (2)
MetaBands использует мощные и уникальные алгоритмы для построения каналов и обнаружения тенденций, чтобы предоставлять трейдерам потенциальные точки для входа и выхода из сделок. Это индикатор канала плюс мощный индикатор тенденций. Он включает различные типы каналов, которые могут быть объединены для создания новых каналов, просто используя параметры ввода. MetaBands использует все типы оповещений, чтобы уведомлять пользователей о событиях на рынке. Особенности Поддерживает большинство алгоритм
- Real price is 80$ - 40% Discount (It is 49$ now) - Lifetime update free Contact me for instruction, any questions! Related Product:  Gold Trade Expert MT5 - Non-repaint - I just sell my products in Elif Kaya Profile, any other websites are stolen old versions, So no any new updates or support. Introduction The breakout and retest strategy is traded support and resistance levels. it involves price breaking through a previous level.  The break and retest strategy is designed to help traders do
Другие продукты этого автора
Индикатор KT Asian Breakout анализирует ключевую часть азиатской сессии для генерации двусторонних сигналов на покупку и продажу в направлении пробоя цены. Сигнал на покупку возникает, когда цена пробивает максимум сессии, а сигнал на продажу — когда цена пробивает минимум сессии. Что важно учитывать Если диапазон сессии слишком широкий, следует избегать открытия новых сделок, так как большая часть ценового движения уже произошла внутри этого диапазона. Если пробойная свеча слишком большая, цен
KT MA Crossover MT5
KEENBASE SOFTWARE SOLUTIONS
KT MA Crossover отображает стрелки покупки и продажи на основе пересечения выбранных скользящих средних. Кроме того, индикатор генерирует соответствующие оповещения и показывает значение MFE (наиболее благоприятное отклонение) для каждого нового сигнала. Стратегия пересечения скользящих средних является одной из самых популярных среди трейдеров по всему миру. Обычно она включает быструю и медленную скользящую среднюю, чтобы находить сигналы на покупку и продажу в зависимости от направления пере
KT Momentum Arrows MT5
KEENBASE SOFTWARE SOLUTIONS
5 (2)
Индикатор KT Momentum Arrows основан на кратковременном пробое, который рассчитывается с использованием отклонения полос и возникающей волатильности в определенном направлении. Сигнал на покупку появляется, когда цена закрывается выше верхней полосы, а сигнал на продажу — когда цена закрывается ниже нижней полосы. Используется коэффициент величины, который влияет как на отклонение полос, так и на измерение волатильности. Значение коэффициента следует тщательно подбирать и анализировать в зависим
ACB Breakout Arrows MT5
KEENBASE SOFTWARE SOLUTIONS
5 (1)
Индикатор ACB Breakout Arrows формирует важные сигналы на вход в рынок, определяя специальные паттерны пробоя. Индикатор постоянно сканирует график, ожидая появления импульса в одном направлении, и генерирует точный сигнал входа прямо перед большим движением. Основные возможности: Не перерисовывается! Показывает уровни стоп-лосс и тейк-профит. Подходит для внутридневых трейдеров, свинг-трейдеров и скальперов. Оптимизированный алгоритм для повышения точности сигналов. Предварительно рассчитываем
This is a 100% automated expert advisor based on our custom indicator named  "ACB Breakout Arrows" . The entries are based on a breakout pattern that constantly occurs in a bi-directional manner. The intensity of entry signals can be manipulated using the external input called "Signal Sensitivity". MT4 Version is available here  https://www.mql5.com/en/market/product/35769 Trades Confirmation ACB Breakout Arrows EA provides an ability to filter the entries using our another custom indicator nam
KT RSI Divergence robot is a 100% automated expert advisor that trades regular and hidden divergence built between the price and Relative Strength Index (RSI) oscillator. The divergence signals are fetched from our freely available RSI divergence indicator. Not every divergence ends up in a successful price reversal, that's why this ea combines the raw divergences signals with its inbuilt technical analysis module to exploit the price inefficiency that occurs after some selected divergence sig
Use of support and resistance in systematic trading is very subjective. Every trader has their own idea and way to plotting the support and resistance levels on the chart. KT Support and Resistance indicator take out this ambiguity out of the situation and automatically draws support and resistance levels following an algorithmic approach using a unique multi-timeframe analysis. When launched on the chart, It immediately scan the most significant extreme points across all the available timefra
KT Trend Magic MT5
KEENBASE SOFTWARE SOLUTIONS
KT Trend Magic shows the trend depiction on chart using the combination of market momentum and volatility. A smoothing coefficient is used to smooth out the noise from the signal.It can be used to find out the new entries or confirm the trades produced by other EA or indicator. Features Drag n drop MTF scanner which scans for the new signals across multiple time-frames. Find new entries in the trend direction. Improve the accuracy of other indicators when used in conjunction. Can be used as a d
KT Trend Magic
KEENBASE SOFTWARE SOLUTIONS
KT Trend Magic shows the trend depiction on chart using the combination of market momentum and volatility. A smoothing coefficient is used to smooth out the noise from the signal.It can be used to find out the new entries or confirm the trades produced by other EA/Indicators. Usage Drag n drop MTF scanner which scans for the new signals across multiple time-frames. Find new entries in the trend direction. Improve the accuracy of other indicators when used in conjunction. Can be used as a dynami
KT COG Advanced MT4
KEENBASE SOFTWARE SOLUTIONS
1 (1)
KT COG is an advanced implementation of the center of gravity indicator presented by John F. Ehlers in the May 2002 edition of Technical Analysis of Stocks & Commodities magazine. It's a leading indicator which can be used to identify the potential reversal points with the minimum lag. The COG oscillator catches the price swings quite effectively. MT5 version of the same indicator is available here KT COG Advanced MT5 Calculation of COG The COG indicator is consist of the two lines. The main l
KT CCI Divergence MT4
KEENBASE SOFTWARE SOLUTIONS
KT CCI Divergence shows the regular and hidden divergence created between the price and CCI oscillator. Divergence is one of the vital signals that depicts the upcoming price reversal in the market. Manually spotting the divergence between price and CCI can be a hectic and ambiguous task. Limitations of KT CCI Divergence   Using the CCI divergence as a standalone entry signal can be risky. Every divergence can't be interpreted as a strong reversal signal. For better results, try to combine it w
ACB Breakout Arrows
KEENBASE SOFTWARE SOLUTIONS
4.15 (34)
The ACB Breakout Arrows indicator provides a crucial entry signal in the market by detecting a special breakout pattern. The indicator constantly scans the chart for a settling momentum in one direction and provide the accurate entry signal right before the major move.  Get multi-symbol and multi-timeframe scanner from here - Scanner for ACB Breakout Arrows MT4 Key features Stoploss and Take Profit levels are provided by the indicator. Comes with a MTF Scanner dashboard which tracks the breako
ACB Trade Filter MT4
KEENBASE SOFTWARE SOLUTIONS
5 (1)
Индикатор ACB Trade Filter отфильтровывает маловероятные торговые сигналы в торговой стратегии. Продукт использует сложный алгоритм фильтрации на основе рыночных настроений и трендов. Заявки Хорошо сочетается с другим нашим индикатором ACB Breakout Arrows . Отфильтровывает маловероятные сигналы любого индикатора. Избегает слишком частых сделок и минимизирует убытки. Торгует в направлении рыночных настроений. Хорошо справляется с волатильностью. Инструкция по применению Покупайте, если гистогра
KT Momentum Arrows
KEENBASE SOFTWARE SOLUTIONS
Индикатор KT Momentum Arrows основан на кратковременном пробое, который рассчитывается с использованием отклонения полос и возникающей волатильности в определенном направлении. Сигнал на покупку появляется, когда цена закрывается выше верхней полосы, а сигнал на продажу — когда цена закрывается ниже нижней полосы. Используется коэффициент величины, который влияет как на отклонение полос, так и на измерение волатильности. Значение коэффициента следует тщательно подбирать и анализировать в зависим
KT Pin Bar
KEENBASE SOFTWARE SOLUTIONS
KT Pin Bar identifies the pin bar formation which is a type of price action pattern which depicts a sign of reversal or rejection of the trend. When combined with support and resistance, BRN and other significant levels, Pin Bar pattern proved to be a very strong sign of reversal. Basically, a pin bar is characterized by a small body relative to the bar length which is closed either in upper or lower 50% part of its length. They have very large wicks and small candle body. A pin bar candlestic
KT Auto Fibo
KEENBASE SOFTWARE SOLUTIONS
KT Auto Fibo draws Fibonacci retracement levels based on the ongoing trend direction. The Highs and Lows are automatically selected using the Maximum and Minimum points available on the chart. You can zoom in/out and scroll to adjust the Fibonacci levels accordingly. Modes Auto:  It draws the Fibonacci levels automatically based on the chart area. Manual: It draws the Fibonacci levels only one time. After that, you can change the anchor points manually. Usage: Helps to predict the future profi
KT Psar Arrows
KEENBASE SOFTWARE SOLUTIONS
KT Psar Arrows plots the arrows on chart using the standard Parabolic SAR indicator. A bullish arrow is plotted when the candle's high touch the SAR. A bearish arrow is plotted when the candle's low touch the SAR. The signals are generated in the real-time without waiting for the bar close.  Features A beneficial tool for traders who want to experiment with the trading strategies that include the use of Parabolic Sar indicator.  Can be used to find turning points in the market. Use custom PSAR
KT Ichimoku Trader
KEENBASE SOFTWARE SOLUTIONS
1 (1)
KT Ichimoku Trader is a fully automated expert advisor that offers five popular trading strategies based on the Ichimoku indicator. Each strategy has it's own entry and exit method without any interference to other strategies. The Ichimoku system can be applied to all major currency pairs and metals. However, we found that it performs reasonably well mainly on two pairs.   MT5 Version is available here  https://www.mql5.com/en/market/product/35043 Features Trade up to 5 famous trading strategi
KT Volatility oscillator analyze the past and current market data with a mathematical formula to display the result in a form of an oscillator. The growing and deteriorating waves are equivalent to high and low volatility in the asset.  In a nutshell, volatility is simply a measurement of the price fluctuation of an asset over a certain period of time. Without volatility, there would not much movement in the market and traders would not be able to profit from the price movements. Use of Volatil
KT COG Robot
KEENBASE SOFTWARE SOLUTIONS
KT COG Robot is a fully automated Expert Advisor based on the KT COG Indicator . The COG indicator was originally presented by John F. Ehlers in the May 2002 edition of Technical Analysis of Stocks & Commodities magazine. The EA fires a long trade when COG line cross above the signal line and a short trade is fired when the COG line cross below the signal line.  Adaptive Filtration Our adaptive filtration algorithm combines the original COG formula with the major trend direction and market acce
ACB Breakout Arrows EA
KEENBASE SOFTWARE SOLUTIONS
This is a 100% automated expert advisor based on our custom indicator named "ACB Breakout Arrows" . The entries are based on a breakout pattern that constantly occurs in a bi-directional manner. The intensity of entry signals can be manipulated using the external input called "Signal Sensitivity". MT5 Version is available here  https://www.mql5.com/en/market/product/35785 Trades Confirmation ACB Breakout Arrows EA provides an ability to filter the entries using our another custom indicator nam
KT Asian Breakout
KEENBASE SOFTWARE SOLUTIONS
4 (1)
KT Asian Breakout carefully analyzes the range-bound market during the Asian session and then fires a long or short trade after doing some preassessment based on its inbuilt technical analysis module. The executed orders are closed within a day before the completion of the next day session. The inbuilt technical analysis module checks for the session range and compares it with the last 20 days price movement. If it finds any erratic price movement within the session, the orders are not executed
KT London Breakout
KEENBASE SOFTWARE SOLUTIONS
First thirty minutes are essential for a trading session. The early reaction of traders and market players sets a path for the rest of the day. KT London Breakout EA takes advantage of this phenomenon, and after analyzing the first thirty minutes of London session, it places two bidirectional pending orders. One of pending order is eventually canceled after realizing the market direction with certainty. It has been strictly tested and developed for EUR/JPY using 30-Min Time Frame. You can expe
If you trade Forex, having detailed information about the currency strength and currency pairs correlation can take your trading to new heights. The correlation will help to cut your risk in half, and strength analysis will help to maximize the profits. This indicator provides a hybrid approach for selecting the most appropriate currency pairs using the strength analysis and currency pairs correlation. How to use the Currency Strength Analysis Suppose your trading strategy provides a buying opp
MACD Divergence Seeker
KEENBASE SOFTWARE SOLUTIONS
KT MACD Divergence Seeker trades the regular and hidden divergence signals generated by our free indicator named KT MACD Divergence indicator. Trading the standalone divergences can be a risky affair that's why the KT MACD Divergence Seeker combines the standard divergence signals with an advanced analysis module to exploit the price inefficiencies on some FX pairs. What is the Divergence exactly? As a general conception if the price is making higher highs, then macd should also be making hig
MACD Divergence MT4
KEENBASE SOFTWARE SOLUTIONS
KT MACD Divergence shows the regular and hidden divergences build between the price and oscillator. If your trading strategy anticipates the trend reversal, you can include the MACD regular divergence to speculate the potential turning points. And if your trading strategy based on the trend continuation, MACD hidden divergence would be a good fit. Limitations of KT MACD Divergence Using the macd divergence as a standalone entry signal can be a risky affair. Every divergence can't be interprete
KT Bollinger Bands Trader is a 100% automated expert advisor that's incorporated a mean reversion trading strategy using the Bollinger bands during the period of low volatility. Price often reacts at the upper or lower line of Bollinger bands, but a reversal not always occurs. However, there is more chance of price reversal during the time of low volatility. Entries A buy trade is activated when price correctly aligns below the bottom line of Bollinger bands. A sell trade is activated when pric
KT Heiken Ashi Smoothed is a smoothed version of the standard Heiken Ashi. Moreover, it also plots buy/sell arrows on a trend change. A buy arrow is plotted when it change to a bullish state from bearish state. A sell arrow is plotted when it change to a bearish state from bullish state. Mobile notifications, Email, Sound and Pop-up alerts included. What exactly is Heiken Ashi Smoothed? It filters out the false signals and noise in the standard Heiken Ashi. It applies the set of two moving ave
KT MA Crossover MT4
KEENBASE SOFTWARE SOLUTIONS
KT MA Crossover отображает стрелки покупки и продажи на основе пересечения выбранных скользящих средних. Кроме того, индикатор генерирует соответствующие оповещения и показывает значение MFE (наиболее благоприятное отклонение) для каждого нового сигнала. Стратегия пересечения скользящих средних является одной из самых популярных среди трейдеров по всему миру. Обычно она включает быструю и медленную скользящую среднюю, чтобы находить сигналы на покупку и продажу в зависимости от направления пере
Фильтр:
Нет отзывов
Ответ на отзыв
Версия 1.1 2022.03.24
- recompiled.