• Обзор
  • Отзывы (1)
  • Обсуждение (6)
  • Что нового

Quantum Currency Matrix Indicator

Рекомендуем также
Профиль Рынка (Market Profile) определяет ряд типов дней, которые помогают трейдеру распознать поведение рынка. Ключевая особенность - это область значений (Value Area), представляющая диапазон ценового действия, в котором произошло 70% торговли. Понимание области значений может помочь трейдерам вникнуть в направление рынка и установить торговлю с более высокими шансами на успех. Это отличное дополнение к любой системе, которую вы возможно используете. Blahtech Limited представляет сообществу Me
Daily Candle Predictor - это индикатор, который предсказывает цену закрытия свечи. Прежде всего индикатор предназначен для использования на графиках D1. Данный индикатор подходит как для традиционной форекс торговли, так и для торговли бинарными опционами. Индикатор может использоваться как самостоятельная торговая система, так может выступать в качестве дополнения к вашей уже имеющейся торговой системе. Данный индикатор производит анализ текущей свечи, рассчитывая определенные факторы силы внут
Gioteen Volatility Index (GVI)   - your ultimate solution to overcoming market unpredictability and maximizing trading opportunities. This revolutionary indicator helps you in lowering your losing trades due to choppy market movements. The GVI is designed to measure market volatility, providing you with valuable insights to identify the most favorable trading prospects. Its intuitive interface consists of a dynamic red line representing the volatility index, accompanied by blue line that indicat
This is an indicator with real-time reminder function, which can realize real-time monitoring of four harmonic patterns of multiple cycles (30 minute chart, 1 hour chart, 4 hour chart, 1 day chart), and help traders to have insight into market reversal opportunities. Gartly Bat Butterfly Cypher Before loading into the chart, you need to manually input the switch parameters, which are the harmonic patterns   and time period you want to monitor: M30 / H1 / H4 / D1. It is on  when the corresponding
Black series MT4 - Индикатор предназначен для торговли на бинарных опционах с Tаймфреймом М1-M5-M15 Мультивалютный (Работает на криптовалюте и на валютных парах) Сигнал появляется при открытии свечи До 90% верных сигналов Полностью отсутствует перерисовка сигналов  Можно использовать с другими индикаторами. Хороший для скальпинга! В Настройках есть: -Методы работы индикатора -И Аллерт Цвет стрелок Красный сигнал вниз Синий сигнал вверх Так же смотрите видео как работает индикатор и появляются си
Introduction to Chart Pattern MT Chart Pattern MT is a chart pattern scanner to detect the triangle pattern, falling wedge pattern, rising wedge pattern, channel pattern and so on. Chart Pattern MT uses highly sophisticated chart pattern detection algorithm. However, we have designed it in the easy to use with intuitive user interface. Chart Pattern MT will show all the patterns in your chart in the most efficient format for your trading. You do not have to do tedious manual pattern detection an
PipFinite Exit EDGE
Karlo Wilson Vendiola
4.88 (161)
Должна была состояться прибыльная сделка и вдруг отменилась? При наличии надежной стратегии выход из сделки также важен, как и вход. Exit EDGE помогает максимально увеличить доход от текущей сделки и не потерять выигрышные сделки. Всегда будьте внимательны к сигналу на выход из сделки Отслеживайте все пары и тайм-фреймы в одном графике www.mql5.com/en/blogs/post/726558 Торговля Вы можете закрыть уже открытые сделки, как только получите сигнал Закрывайте заявку на покупку, если вы получил
Особенности Поддержка создания месячных, недельных, дневных, четырехчасовых, часовых и тридцатиминутных профилей. Дневной профиль имеет настраиваемое время запуска. Слияние и разделение рыночных профилей. Точка привязки профиля может быть экспортирована в формат CSV для последующего анализа. Параметры индикатора Indicator Update Interval - период расчета индикатора, от 250 милисекунд до 2,5 секунд Indicator Setting ID - Идентификатор для текущих настроек индикатора. Profile Number - Количество
BoxChart MT4
Evgeny Shevtsov
4.57 (7)
Рынок несправедлив, хотя бы потому, что всего лишь 10% игроков управляют 90% капитала. У рядового трейдера мало шансов, чтобы противостоять этим «хищникам». Но выход есть, необходимо всего лишь перейти на другую сторону, необходимо находиться в числе этих 10% «акул», научиться распознавать их намерения и двигаться вместе с ними. Объем - это единственный опережающий фактор, который безупречно работает на любом периоде и любом торговом инструменте. Сначала зарождается и накапливается объем, и толь
Strong Retracement Points Pro demo edition! SRP (Strong Retracement/Reversal Points) is a powerful and unique support and resistance indicator. It displays the closest important levels which we expect the price retracement/reversal! If all level are broken from one side, it recalculates and draws new support and resistance levels, so the levels might be valid for several days depending on the market! If you are still hesitating to start using this wonderful tool, you can check this link to see h
Индикатор поддержки и сопротивления для бинарных опционов Этот индикатор разработан специально для торговли бинарными опционами и отлично показывает откаты от уровней поддержки и сопротивления. Сигналы появляются на текущей свече. Красная стрелка, направленная вниз, указывает на потенциальную возможность продажи, а синяя стрелка, направленная вверх, предлагает возможности для покупки. Все, что вам нужно настроить, это цвет сигнальных стрелок. Рекомендуется использовать его на таймфреймах M1-M5,
Индикатор Supply Demand использует предыдущее ценовое действие для выявления потенциального дисбаланса между покупателями и продавцами. Ключевым является определение зон с лучшими возможностями, а не просто вероятностей. Индикатор Blahtech Supply Demand обеспечивает функционал, не доступный ни в одной платформе. Этот индикатор 4 в 1 не только выделяет зоны с более высокой вероятностью на основе механизма оценки силы по множественным критериям, но также комбинирует его с мульти-таймфреймовым анал
VR Cub
Vladimir Pastushak
VR Cub это индикатор что бы получать качественные точки входа. Индикатор разрабатывался с целью облегчить математические расчеты и упростить поиск точек входа в позицию. Торговая стратегия, для которой писался индикатор, уже много лет доказывает свою эффективность. Простота торговой стратегии является ее большим преимуществом, что позволяет успешно торговать по ней даже начинающим трейдерам. VR Cub рассчитывает точки открытия позиций и целевые уровни Take Profit и Stop Loss, что значительно повы
Trading the currency markets is a complex business, not least since we are dealing with pairs of currencies, and by inference, pairs of economies. All economies around the world are interlinked, and reflected in the constant ebb and flow of currency strength and weakness. The problem for us as traders is monitoring so many pairs simultaneously, since every pair does not move independently, but reflects the interrelated nature of this market. The Quantum Currency Heatmap delivers the informatio
This is the complete REX package. It consists of the lite, pro and ULTRA version.  Perfect for beginners and intermediates. REX complete is 100% non repaint. The strategy is based on a mix of different strategies, statistics, including pivot points, oscillators and patterns.  As the trading idea consists of a variety of some classic indicators like Momentum, Williams Percent Range, CCI, Force Index, WPR, DeMarker, CCI, RSI and Stochastic, it is clear that the fundamental indicators have being
Индикатор строит текущие котировки, которые можно сравнить с историческими и на этом основании сделать прогноз ценового движения. Индикатор имеет текстовое поле для быстрой навигации к нужной дате. Параметры : Symbol - выбор символа, который будет отображать индикатор; SymbolPeriod - выбор периода, с которого индикатор будет брать данные; IndicatorColor - цвет индикатора; Inverse - true переворачивает котировки, false - исходный вид; Далее идут настройки текстового поля, в которое можн
Please feel free to contact me if you need any further information. Please let me know if you have any questions. I hope the above is useful to you. MT MERIT OBOS (Over Bought and Over Sold zone) : It is an indicator created to find reverse signals of over bought and over sold zone. It is a very difficult task because no one knows when the graph will reverse. manage risk management by yourself (Stop Loss,TP, Risk Reward, Martingale technique, ...)  and fundamental analysis help to choose an
Индикатор отображает в отдельном окне разность между количеством пунктов, которые увеличили цену, и количеством пунктов, которые уменьшили цену за заданный в настройках интервал времени. Временной интервал, за который проводится расчет, выражается в количестве баров графика, на который индикатор прикреплен. Данный подход позволяет оценить в какую сторону (рост или падение) движется цена инструмента, силу движения и величину движения в пунктах. В работе индикатор использует только тики поступающи
Индикатор относится к средствам вероятностного анализа. Прогнозирование выполняется методом Монте Карло совместно с математической моделью нейрона. Но, моделирование образцов для метода производится не искусственно, а поставляется из оригинальной "натуры", то есть из истории. Количество образцов и детальность их моделирования достигается использованием младшего (относительного текущего) таймфрейма. Алгоритм работы индикатора : В общих чертах алгоритм сводится к тому, что индикатор обучает
M W Pattern Pro
Nesimeye Oswald
4.14 (7)
M & W Pattern Pro is an advanced scanner for M and W patters , it uses extra filters to ensure scanned patterns are profitable. The indicator can be used with all symbols and time frames. The indicator is a non repaint indicator with accurate statistics calculations. To use , simply scan the most profitable pair using the statistics dashboard accuracy , then enter trades on signal arrow and exit at the TP and SL levels. STATISTICS : Accuracy 1 : This is the percentage of the times price hit
The Chaikin Oscillator is a technical indicator developed by Marc Chaikin that combines price and volume data to measure the accumulation and distribution of a financial instrument. It aims to identify potential buying and selling opportunities in the market. The Chaikin Oscillator is calculated by subtracting a 10-day exponential moving average of the Accumulation Distribution Line (ADL) from a 3-day exponential moving average of the ADL. Here's how to use the Chaikin Oscillator indicator in tr
It will be the best tool for you to make a profit! Through unique algorithms You're going to see an amazing amount of right trading signals Make huge profits every day and realize more possibilities!   Like the car no money to buy it, the love of the girls dare not to pursue?Or the credit card bill is not paid, the rent does not have the extra money to settle?Or are you fed up with being bossed around by your boss and Hope to get more people's respect?Can't afford to buy the things you want ? wa
Индикатор R Show Ticks для Metatrader 4 показывает тики вверх/вниз в режиме реального времени в главном торговом окне. Ключевые выводы Белая стрелка — это рост. Красная стрелка — нисходящая галочка. Индикатор работает для любой валютной пары и таймфрейма по вашему выбору. Характеристики индикатора Торговая платформа: разработана для Metatrader 4 (MT4) Валютные пары: работает для любой пары Таймфреймы: Работает для любого таймфрейма Входные параметры: Входной символ, стиль, цвет. Тип
The Volumebyprice.com technical indicator for MetaTrader 4 features Volume Profile and Market Profile TPO (Time Price Opportunity). Volume and TPO histogram bar and line charts. Volume Footprint charts. TPO letter and block marker collapsed and split structure charts. Session filtering and grouping. Static, dynamic and flexible range segmentation and compositing methods with relative and absolute visualizations. Graphical layering, positioning and styling options to suit the user's analytic and
Ночной Призрак - Стрелочный индикатор для Бинарных опционов. Это надежный помощник вам в будущем! -Отсутствует перерисовка на графике -Работает отлично на валютных парах EUR/USD! -Точность индикатора до 90% (Особенно ночью) -Не нужно долго настраивать (Настроено идеально для Бинарных Опционов) -Не опаздывающие сигналы -Появление сигнала на текущей свече -Идеально подходит для периода М1 (Не Больше!) -Удобный для глаз цвет свечей (Красный и Синий) -Установлен Алерт  Работа с ним: -Синяя стрелка
True SnD
Indra Lukmana
5 (1)
Этот индикатор спроса и предложения использует уникальный метод определения ценового действия для расчета и измерения зоны спроса и предложения. Индикатор обеспечивает актуальность зон, а также наличие значительных зон низкого риска. Данный индикатор обеспечивает функционал, не доступный ни в одной платформе. Торговая идея Устанавливайте отложенные ордера вдоль зон спроса и предложения. Открывайте сделку, когда цена касается определенной области (после подтверждения отката). Входные параметр
For sure, this indicator has become very popular amongst traders. Through coding this indicator will give you the most accurate levels possible for your trading analysis. We have also added in the ability for you to receive alerts when the price breaks above or below a Support or Resistance lines! HOW TO USE The red rectangles represent your resistance/supply zone. The green rectangles represent your support/demand zone.  BONUS FEATURES We coded this indicator with the ability to switch between
Fibonacci retracement and extension line drawing tool Fibonacci retracement and extended line drawing tool for MT4 platform is suitable for traders who use  golden section trading Advantages: There is no extra line, no too long line, and it is easy to observe and find trading opportunities Trial version: https://www.mql5.com/zh/market/product/35884 Main functions: 1. Multiple groups of Fibonacci turns can be drawn directly, and the relationship between important turning points
Прежде всего стоит подчеркнуть, что этот торговый индикатор не перерисовывается, не перерисовывает и не отставает, что делает его идеальным как для ручной, так и для роботизированной торговли. Руководство пользователя: настройки, вводы и стратегия. Атомный аналитик - это индикатор ценового действия PA, который использует силу и импульс цены, чтобы найти лучший край на рынке. Оборудованный расширенными фильтрами, которые помогают убирать шумы и ложные сигналы, и повышают торговый потенциал. Испо
The Market Profile Indicator for MT4 displays the price levels and zones where increased trading activity happens. These zones with substantial forex trading activity provide the forex traders with the best entry levels, support, and resistance levels. Moreover, price levels indicate the best reversal zones. As a result, forex traders can identify BULLISH and BEARISH market trends and BUY and SELL entry points as well as the best reversal points. The indicator works well in all intraday timefram
С этим продуктом покупают
В настоящее время скидка 20%! Лучшее решение для новичка или трейдера-эксперта! Эта приборная панель работает на 28 валютных парах. Он основан на 2 наших основных индикаторах (Advanced Currency Strength 28 и Advanced Currency Impulse). Он дает отличный обзор всего рынка Forex. Он показывает значения Advanced Currency Strength, скорость движения валюты и сигналы для 28 пар Forex на всех (9) таймфреймах. Представьте, как улучшится ваша торговля, когда вы сможете наблюдать за всем рынком с пом
The AT Forex Indicator MT4 is a sophisticated trading tool designed to provide traders with a comprehensive analysis of multiple currency pairs. This   powerful indicator   simplifies the complex nature of the forex market, making it accessible for both novice and experienced traders. AT Forex Indicator uses   advanced algorithms   to detect trends, patterns and is an essential tool for traders aiming to enhance their forex trading performance. With its robust features, ease of use, and reliabl
Indicator : RealValueIndicator Description : RealValueIndicator is a powerful tool designed specifically for trading on the EURUSD pair. This indicator analyzes all EUR and USD pairs, calculates their real currency strength values, and displays them as a single realistic value to give you a head start on price. This indicator will tell you moves before they happen if you use it right. RealValueIndicator allows you to get a quick and accurate overview of the EURUSD currency pair tops and bottoms,
TrendMaestro
Stefano Frisetti
5 (3)
note: this indicator is for METATRADER4, if you want the version for METATRADER5 this is the link:  https://www.mql5.com/it/market/product/108106 TRENDMAESTRO ver 2.4 TRENDMAESTRO recognizes a new TREND in the bud, he never makes mistakes. The certainty of identifying a new TREND is priceless. DESCRIPTION TRENDMAESTRO identifies a new TREND in the bud, this indicator examines the volatility, volumes and momentum to identify the moment in which there is an explosion of one or more of these data a
JULY OFFER 80% OFF next price for unlimited version will be 17000$. This is the only time you can get this institutional and professional indicator at this price for unlimited version. Don't dare to miss this. The tool I am about to introduce to you you can't compare it with other tools due to its strategy and accuracy level in predicting the next price directional movement . This tool is designed for serious traders who have decided to make a difference through trading. Be the next person to wi
Enigmera
Ivan Stefanov
5 (4)
ЭНИГМЕРА: ядро рынка https://www.enigmera.com Введение Этот индикатор и торговая система представляют собой удивительный подход к финансовым рынкам. ENIGMERA использует фрактальные циклы для точного расчета уровней поддержки и сопротивления. Он показывает подлинную фазу накопления и дает направление и цели.  Система, которая работает независимо от того, находимся ли мы в тренде или в коррекции.  Как она работает? ENIGMERA состоит из трех линий: линии поддержки/сопротивления, линии цели и ли
Cycle Sniper
Elmira Memish
4.41 (37)
NEW YEAR SALE PRICE FOR LIMITED TIME!!! Please contact us after your purchase and we will send you the complimentary indicators to complete the system Cycle Sniper is not a holy grail but when you use it in a system which is explained in the videos, you will feel the difference. If you are not willing to focus on the charts designed with Cycle Sniper and other free tools we provide, we recommend not buying this indicator. We recommend watching the videos about the indiactor and system before pu
Welcome to the world of SMC (Smart Money Concepts) Trading, where we empower traders with the tools and knowledge to make smarter trading decisions. Our latest addition to our suite of trading tools is the SMC Trading Pro indicator, version 1.0. Key Features: Major Market Structure Identification with BODY break. Order Block must be in Major Swing ( not Small Swing ). Order Block with Fair Value Gap Detection. Order Block in Discount | Premium zone. Filter for only Bullish, Bearish or All Order
ZeusArrow Smart Liquidity Finder  Smart Liquidity Finder is Ai controlled indicator based on the Idea of Your SL is My Entry. It scan and draws the major Liquidity areas on chart partitioning them with Premium and Discount Zone and allows you find the best possible trading setups and help you decide the perfect entry price to avoid getting your Stop Loss hunted . Now no more confusion about when to enter and where to enter. Benefit from this one of it's kind trading tool powered by Ai an trade
А. Что такое A2SR?   * Это опережающий технический индикатор (без перерисовки, без запаздывания) . -- Учебники : -- на https://www.mql5.com/ru/blogs/post/734748/page4#comment_16532516   -- и https://www.mql5.com/ru/users/yohana/blog A2SR имеет особую технику определения уровней Поддержки (спроса) и Сопротивления (предложения). В отличие от обычного способа, который мы видели в сети, A2SR имеет оригинальную концепцию определения фактических уровней SR. Оригинальная техника не была взята из Инт
FxBears Powers работает со всеми валютными парами, металлами, товарами, фьючерсами, индексами, энергоносителями, криптовалютой и всем ... и на всех таймфреймах от M1 до MN. Он основан на спросе и предложении и некоторых внутренних индикаторах, он дает вам очень сильную точку входа с нулевым проскальзыванием большую часть времени, вы можете проверить это в тесте. Он мгновенно отправляет вам сигналы на платформу вашего телефона, где бы вы ни находились, он содержит название пары, время, таймф
NAM Order Blocks
NAM TECH GROUP, CORP.
5 (1)
Индикатор обнаружения блоков ордеров мультитаймфреймов MT4. Функции - Полностью настраиваемая панель управления графиком, обеспечивает полное взаимодействие. - Скрыть и показать панель управления где угодно. - Обнаружение OB на нескольких таймфреймах. - Выберите количество OB для отображения. - Различные пользовательские интерфейсы OB. - Различные фильтры по OB. - Оповещение о близости OB. - Линии ADR High и Low. - Служба уведомлений (Экранные оповещения | Push-уведомления).
Представляем индикатор астрономии для MT4: Ваш незаменимый небесный товарищ в торговле Готовы ли вы поднять свой опыт торговли до небесных высот? Не ищите дальше, чем наш революционный индикатор астрономии для MT4. Этот инновационный инструмент выходит за рамки традиционных торговых индикаторов, используя сложные алгоритмы для предоставления вам беспрецедентных астрономических понимания и точных расчетов. Вселенская информация под рукой: Взгляните на обширную панель, раскрывающую сокровищницу ас
Gold Channel is a volatility-based indicator, developed with a specific timing algorithm for the XAUUSD pair, which consists of finding possible corrections in the market. This indicator shows two outer lines, an inner line (retracement line) and an arrow sign, where the theory of the channel is to help identify overbought and oversold conditions in the market. The market price will generally fall between the boundaries of the channel. If prices touch or move outside the channel it is a tra
Please send me Direct message on MQL5 CHAT after purchasing the Indicator for Training and Installation Support There are some additional files that is important to use with the Indicator . So be sure to contact me after purchasing the Indicator So that I can add you for training and support . If you find any difficulty with installation then send me Direct message here So that I can connect with you via Anydesk or Teamview for the product installation. " Smart Order Block Indicator " to find
Индикатор " ZigZag on Trend " представляет из себя помощника в определении направления движения цены, а так же калькулятора баров и пунктов. Состоит из трендового индикатора, следящей за направлением цены трендовой линией представленной в виде зигзага и счетчика вычисляющего число баров пройденных в направлении тренда и количество пунктов по вертикальной шкале.(расчеты ведутся по открытию бара) Индикатор не перерисовывается. Для удобства исполнен в виде окрашенных баров или в виде линий. Можно и
ECM Elite Channel is a volatility-based indicator, developed with a specific time algorithm, which consists of finding possible corrections in the market. This indicator shows two outer lines, an inner line (retracement line) and an arrow sign, where the channel theory is to help identify overbought and oversold conditions in the market. The market price will generally fall between the boundaries of the channel. If prices touch or move outside the channel, it's a trading opportunity. The
Способ применения Pair Trading Station Рекомендуется использовать Pair Trading Station на таймфрейме H1 с любой валютной парой. Чтобы получить сигналы на покупку и продажу, следуйте указанным ниже инструкциям по применению Pair Trading Station в терминале MetaTrader. При загрузке Pair Trading Station на график индикатор оценит доступные исторические данные на вашей платформе MetaTrader для каждой валютной пары. В самой начале на графике отобразятся исторические данные, доступные для каждой валют
Gann Signal - очень простой на первый взгляд индикатор, но внутри скрыт многолетний опыт изучения методов W.D.Ganna. Индикатор дает точные BUY/SELL сигналы, без перерисовки. Индикатор очень прост в применении. Вам нужно лишь прикрепить его на график и следовать его рекомендациям. Индикатор постоянно ведет анализ рынка на предмет возможностей для входа. Когда такая возможность появляется, индикатор дает сигнал в виде стрелки. Повторяюсь, все сигналы НЕ ПЕРЕРИСОВЫВАЮТСЯ! Индикатор предназначен для
Представляем удивительный форекс-индикатор "Miraculous": раскройте силу точного трейдинга Вы устали от бесконечного поиска лучшего форекс-индикатора, который действительно доставляет исключительные результаты на всех таймфреймах? Не ищите дальше! Представляем вам форекс-индикатор "Miraculous", который пришел, чтобы изменить ваш опыт трейдинга и поднять ваши прибыли на новый уровень. Основанный на передовых технологиях и годам тщательной разработки, форекс-индикатор "Miraculous" является вершиной
Этот индикатор представляет собой метод анализа рынка, основанный на статье «Математическая формула для прогнозов рынка», написанной У.Д. Ганном, в зависимости от метода квадрата девяти и квадрата 144. Руководство пользователя: Add Your review And contact us to get the user manual Вы можете купить полную версию MT5 у: https://www.mql5.com/ru/market/product/28669 Вы можете бесплатно протестировать на МТ4: https://www.mql5.com/en/market/product/15320?source=Site +Profile+Seller#!tab
3 Indicators in 1 indicator Strategy based on price action Made specifically for the best forex currency pairs Can be used in the best time frame of the market at a very reasonable price This indicator is basically 3 different indicatos . But we have combined these 3 indicators in 1 indicator so that you can use 3 indicators at the lowest price. All three strategies are based on price action. But based on different trends. Long term, medium term and short term Attributes : No repaintin
В настоящее время скидка 20%! Эта приборная панель - очень мощное программное обеспечение, работающее на нескольких символах и до 9 таймфреймов. Он основан на нашем основном индикаторе (Лучшие отзывы: Advanced Supply Demand ).   Приборная панель дает отличный обзор. Она показывает:  Отфильтрованные значения спроса и предложения, включая рейтинг силы зон, расстояния между пунктами в зонах и внутри зон, Выделяются вложенные зоны, Выдает 4 вида предупреждений для выбранных символов на всех (9)
Introduction to X3 Chart Pattern Scanner X3 Cherart Pattern Scanner is the non-repainting and non-lagging indicator detecting X3 chart patterns including Harmonic pattern, Elliott Wave pattern, X3 patterns, and Japanese Candlestick patterns. Historical patterns match with signal patterns. Hence, you can readily develop the solid trading strategy in your chart. More importantly, this superb pattern scanner can detect the optimal pattern of its kind. In addition, you can switch on and off individu
Max Payne - это индикатор сигналов разворота/тренда, который подает сигналы в виде стрелки. Этот индикатор подает сигнал при закрытии одного и того же бара. Этот индикатор можно опускать на график несколько раз с разными периодами, чтобы получить двойное или тройное подтверждение сигналов. Индикатор легко настраивается, чтобы соответствовать любому стилю торговли, при этом он никогда не перерисовывается и не перерисовывается. После покупки вы получите полную систему, показанную на скриншотах, в
SNR LEVEL INDICATOR Accurate Snr level indicator will only display Fresh Levels that are close to the Current Market Price. This indicator is very accurate in mapping Support & resistance levels. there is an alert feature when the price TOUCHES the SNR LEVEL, WHEN CLOSE CANDLE BREAK/REJECT SNR LEVEL. INDICATOR MARKING : - SUPPORT LEVEL = V SHAPE - RESISTANCE LEVEL = APEX LEVEL - GAP RESISTANCE & GAP SUPPORT = OPEN CLOSE CANDLE - SUPPORT BECAME RESISTANCE & RESISTANCE BECAME SUPPORT INDICATOR
Представляем ON Trade Waves Patterns Harmonic Elliot Wolfe, передовой индикатор, разработанный для обнаружения разнообразных рыночных паттернов с использованием как ручных, так и автоматизированных методов. Вот как это работает: Гармонические паттерны: Этот индикатор может определять гармонические паттерны, появляющиеся на вашем графике. Эти паттерны важны для трейдеров, практикующих теорию гармонической торговли, как это описано в книге Скотта Карни "Гармоническая Торговля том 1 и 2". Независи
Excessive Momentum Indicator – один из немногих индикаторов, измеряющий чрезмерный импульс на финансовом рынке с использованием ценового поведения. Индикатор полностью разработан Янгом Хо Сео (Young Ho Seo). Этот показатель демонстрирует концепцию и практическое применение Равновесной фрактальной волны (Equilibrium Fractal Wave). Чрезмерный импульс на рынке может рассказать о психологии толпы и помочь спрогнозировать направление цены. Таким образом, вы можете основывать свои торговые решения на
Цикличный индикатор для торговли и прогнозирования направления рынка. Показывает цикличное поведение цены в виде осциллятора. Дает сигналы открытия сделок при отбое от верхних и нижних границ осциллятора. В виде гистограммы показывает сглаженную силу тренда. Дополнит любую стратегию торговли, от скальпинга до внутри-дневной. Индикатор не перерисовывается. Подходит для использования на всех символах/инструментах. Подходящие тайм-фреймы для краткосрочного трейдинга M5, M15, M30. Для дневной и бо
Limitless MT4    - это универсальный индикатор который подойдет каждому как начинающему так и опытному трейдеру работает на всех валютных парах криптовалютах сыре акциях Limitless MT4 - уже настроен и не требует дополнительной настройки   А теперь главное Почему    Limitless MT4 ? 1 полное отсутствие перерисовки  2 два года тестирования лучшими специалистами в трейдинге 3 точность правильных сигналов превышает 80% 4 хорошо показал себя в торговле во время выхода новостей Правила торговли  1 сигн
Другие продукты этого автора
Renko is a well-known Japanese charting technique that removes time from the chart. Instead of drawing bars in constant intervals (time) as a normal chart would, a Renko chart does so only when price moves beyond a predefined amount. In a Renko chart, a bar is created when price exceeds the previous bar’s high or low by a predefined amount or what we call the Box Size. The result is a chart with equally sized bars running up or down in 45 degree angles. Such a chart offers the following advant
Trading the currency markets is a complex business, not least since we are dealing with pairs of currencies, and by inference, pairs of economies. All economies around the world are interlinked, and reflected in the constant ebb and flow of currency strength and weakness. The problem for us as traders is monitoring so many pairs simultaneously, since every pair does not move independently, but reflects the interrelated nature of this market. The Quantum Currency Heatmap delivers the informatio
Задумывались ли вы когда-нибудь, почему столько трейдеров остаются один на один со слабыми позициями не на той стороне рынка? Одна из причин этому - волатильность. Валютная пара неожиданно начинает движение на новостях или выходе экономических данных. Предвкушая быструю и легкую прибыль, на рынок сразу устремляются трейдеры. И вдруг цена разворачивается. Происходит это на всех таймфреймах и на всех символах. Закрытие свечи или бара с широким спредом сменяется резким разворотом цены, оставляя тре
Ваш успех как трейдера зависит от умения определять состояния перекупленности и перепроданности валюты или символа. То есть их силу или слабость. Именно этот подход и лежит в основе торговли на рынке Forex. Сделать это быстро и просто самому было бы практически невозможно, не будь индикатора Quantum Currency Strength - слишком много валют и символов. Вам определенно понадобится помощь! Индикатор Quantum Currency Strength был создан с единственной целью: дать вам глобальную картину по восьми осно
Валютные пары никогда не растут и не падают по прямой. Их подъемы и падения перемежаются откатами и разворотами. Каждый рост и каждое падение отражается и на вашем эмоциональном состоянии: надежда сменяется страхом, а когда он проходит, снова появляется надежда. Рынок использует ваш страх для того, чтобы не дать вам воспользоваться сильной позицией. В такие моменты вы наиболее уязвимы. Все изменится, если вы будете использовать индикатор Quantum Trend Monitor. Кроме того, в данном случае вы полу
Quantum Trends Indicator
QUANTUM TRADING SOFTWARE LIMITED
1 (1)
Один из старейших принципов торговли гласит "сделай тренд своим другом". Наверняка, вам встречалось это выражение. Однако на деле не все так просто! Во-первых, тренд сначала нужно определить, а потом еще и постараться удержаться в нем, а это не легко. Более того, максимально увеличить свою прибыль за счет этого чрезвычайно трудно. И вообще, как определить начало тренда? Если оглянуться назад, то это не составит никакого труда. Но в условиях живого рынка сделать это будет уже не так просто. Индик
Quantum Tick Volumes Indicator
QUANTUM TRADING SOFTWARE LIMITED
5 (2)
Многие Forex-трейдеры предполагают, что такого понятия как объем на валютном рынке не существует. И будут по-своему правы. Центральной биржевой площадки еще никто не создал. А даже если бы она и была, какие данные об объме она могла бы предоставить? Мы имеем дело с торговой активностью, которая выражается в тиковом объеме. Ведь в конечном итоге объем - это просто проявление активности покупателей и продавцов на рынке. То есть, для получения данных об объеме требуется анализ активности и наоборот
Quantum Dynamic Price Pivots Indicator
QUANTUM TRADING SOFTWARE LIMITED
1 (1)
Несмотря на то, что научиться интерпретировать свечной график может любой амбициозный трейдер на ценовом действии, на овладение этим навыком в совершенстве уйдут годы. Простым же смертным без помощи не обойтись. Вот где будет полезен индикатор Quantum Dynamic Price Pivots. Как ведущий индикатор, основанный исключительно на ценовом действии, он генерирует достаточное количество простых и ясных сигналов, с клинической эффективностью отмечая потенциальные точки разворота. Так же как объем и цена, п
Доллар США находится в центре всех финансовых рынков. Это основная резервная валюта и надежная гавань для инвестиций. В долларах США оцениваются все сырьевые товары. Более того, это валюта, цены на которую в самую первую очередь должен учитывать каждый трейдер! Знание ситуации по USD на валютном рынке имеет первостепенную важность при оценке рыночных настроений, рисков и денежных потоков в определенные рынки и инструменты. Зная, в каком направлении движется USD, все остальное - просто. Индикатор
Не хотелось бы констатировать очевидное, но американский доллар - это важнейшая валюта для трейдеров, и не только на рынке Forex. Без четкого представления о USD торговый процесс будет напоминать вождения автомобиля в условиях тумана. Когда произойдет авария - это лишь вопрос времени. Именно поэтому мы разработали два индекса USD. Первый называется Quantum DXY, а второй - Quantum USDX. В чем же их отличие? Толчком к созданию Quantum USDX послужил тот факт, что, по мнению многих Forex трейдеров,
Многие Forex трейдеры наслышаны и даже имели возможность убедиться на собственном горьком опыте в том, насколько опасной и нестабильной может быть торговля иеной. GBP/JPY - это, наверно, самая печально известная и непостоянная из всех пар. И неудивительно, что большинство трейдеров предпочитает не связываться с валютными парами, в состав которых входит иена. При этом они, скорее всего, не имеют четкого представления о направлении движения иены. Иначе торговля парами с иеной была бы более простой
Индикатор Quantum VPOC был разработан для расширения двумерного изучения объема и цены до трехмерного, включающего время. Соотношение объем/цена/время предоставляет реальное понимание внутренней работы рынка и сердцебиение настроения и риска, который соответственно движет ценовым действием. Индикатор Quantum VPOC отображает несколько ключевых элементов информации на графике следующим образом: Volume Profile - показывается в виде гистограммы по объему на вертикальной оси цены на правой стороне гр
Quantum Euro Index Indicator
QUANTUM TRADING SOFTWARE LIMITED
The Euro Currency Index or EURX , quantifies and displays strength and weakness of the single currency. As the index rises it signals strength in the single currency against a basket of currencies. As the index falls this signals weakness in the euro. The Quantum EURX is calculated from a basket of four currencies with each currency having an equal weighting of 25%. US Dollar Japanese Yen British Pound Australian Dollar The indicator can be used in one of three ways: First, to identify and con
This indicator has been developed to identify and display these trends quickly and easily, allowing you to see instantly, those currency pairs which are trending, and those which are not – and in all timeframes, with just one click. The 28 currency pairs are displayed as a fan as they sweep from strong to weak and back again, and this is why we call it the ‘currency array’. All 28 pairs are arrayed before you, giving an instant visual description of those pairs that are trending strongly, those
Trading the currency markets is a complex business, not least since we are dealing with pairs of currencies, and by inference, pairs of economies. All economies around the world are interlinked, and reflected in the constant ebb and flow of currency strength and weakness. The problem for us as traders is monitoring so many pairs simultaneously, since every pair does not move independently, but reflects the interrelated nature of this market. The Quantum Currency Heatmap delivers the informatio
The words powerful, unique and game changing are ones that are often over used when applied to trading indicators, but for the MT4/MT5 Quantum Camarilla levels indicator, they truly describe this new and exciting indicator completely. Why? Because the indicator has something to offer every trader, from the systematic to the discretionary and from swing trading to breakout trading. And it’s not an indicator which is simply used for entries. The Camarilla indicator delivers in all areas, from ge
The Quantum GBPX is the latest addition to our suite of currency indices, and one which we have been asked for many times, and even more so since Brexit. It is an index which has taken us some time to develop, and through a series of complex calculations draws its primary data from a basket of currencies based on the old style dollar index, the Dixie. This is converted to a chart for the British pound. The result is an accurate index which describes strength and weakness for the GBP currency in
If there is only one MT5 indicator you ever buy for trading forex – this has to be it. Your success as a forex trader depends on being able to identify when a currency or currency pair is oversold or overbought. If it is strong or weak. It is this concept which lies at the heart of forex trading. Without the Quantum Currency Strength indicator, it is almost impossible. There are simply too many currencies and too many pairs to do this quickly and easily yourself. You need help! The Quantum C
The Euro Currency Index or EURX , quantifies and displays strength and weakness of the single currency. As the index rises it signals strength in the single currency against a basket of currencies. As the index falls this signals weakness in the euro. The Quantum EURX is calculated from a basket of four currencies with each currency having an equal weighting of 25%. US Dollar Japanese Yen British Pound Australian Dollar The indicator can be used in one of three ways: First, to identify and con
Have you ever wondered why so many Forex traders get trapped in weak positions on the wrong side of the market? One of the easiest ways the market makers do this, is by using volatility. A currency pair moves suddenly, often on a news release or economic data. Traders jump in, expecting some quick and easy profits, but the move suddenly moves in the opposite direction. This happens in all timeframes, and in all currency pairs. The candle or bar closes, with a wide spread, but then reverses sharp
If you've been trading for any time, you will almost certainly have come across the concept of support and resistance. This powerful and simple concept lies at the heart of technical analysis. It forms the cornerstone of price action trading. Strange to consider therefore, that such a key component of the traders chart has largely been ignored. Most Forex traders still draw their lines manually, leading to a crude interpretation of these key levels. Even those companies who have developed a trad
One of the oldest maxims in trading is ‘let the trend be your friend’. You must have come across it! This is easier said than done! First, you have to identify one, then you have to stay in – not easy. Staying in a trend to maximise your profits is extremely difficult. In addition, how do you know when a trend has started? It’s very easy to look back and identify the trend. Not so easy at the live edge of the market. The Quantum Trends indicator is the ‘sister’ indicator to the Quantum Trend Mon
Of all the four principle capital markets, the world of foreign exchange trading is the most complex and most difficult to master, unless of course you have the right tools! The reason for this complexity is not hard to understand. First currencies are traded in pairs. Each position is a judgment of the forces driving two independent markets. If the GBP/USD for example is bullish, is this being driven by strength in the pound, or weakness in the US dollar. Imagine if we had to do the same thing
We don’t want to become boring, but the US dollar is the most important currency for all traders, and not just in Forex. Trading without a clear view of the US dollar is like driving in fog. Sooner or later you are going to crash – it’s just a question of when. That’s why at Quantum we have developed two US dollar indices. The first is the Quantum DXY, and the second is the Quantum USDX. So what’s the difference? Well, the reason we created the Quantum USDX is that many Forex traders believe tha
Many Forex traders have either been told, or have learnt from painful experience, that the Yen currency pairs can be both dangerous and volatile to trade. The GBP/JPY is perhaps the most infamous and volatile of all. No wonder then, that many Forex traders simply stay away from the Yen currency pairs. But then they probably don’t have a very clear idea of where the Yen itself is heading. If they did, then trading the Yen pairs would be much more straightforward. And this is where the Quantum JPY
For aspiring price action traders, reading a candle chart at speed can be learnt, but is a skill which takes years to perfect. For lesser mortals, help is required, and this is where the Quantum Dynamic Price Pivots indicator steps in to help. As a leading indicator based purely on price action, the indicator delivers simple clear signals in abundance, highlighting potential reversals with clinical efficiency. Just like volume and price, pivots are another ‘predictive’ indicator, and a leading i
Quantum Tick Volumes Indicator for MT5
QUANTUM TRADING SOFTWARE LIMITED
5 (1)
Many Forex traders assume there is no volume in the foreign exchange market. And they would be correct. There is no central exchange, not yet anyway. And even if there were, what would it report? What there is however is activity, and this is captured as tick volume. After all, volume is simply displaying activity, the buyers and sellers in the market. So for volume read activity, and for activity read volume – simple. The MT5 platform delivers tick data which the Quantum Tick Volumes indicator
Currency pairs never go up or down in a straight line. They rise and fall constantly, creating pullbacks and reversals. And with each rise and fall, so your emotions rise and fall. Hope, then fear, then hope. This is when the market will try to frighten you out of a strong position. It is when you are most vulnerable. But not if you have the Quantum Trend Monitor. And here, you even get two indicators for the price of one! The Quantum Trend Monitor has been designed to absorb these temporary pau
The Quantum VPOC indicator has been developed to expand the two dimensional study of volume and price, to a three dimensional one which embraces time. The volume/price/time relationship then provides real insight to the inner workings of the market and the heartbeat of sentiment and risk which drives the price action accordingly. The Quantum VPOC indicator displays several key pieces of information on the chart as follows: Volume Profile - this appears as a histogram of volume on the vertical pr
Фильтр:
[Удален] 2015.03.27 22:21 
 

Пользователь не оставил комментарий к оценке

Ответ на отзыв
Версия 4.0 2018.08.16
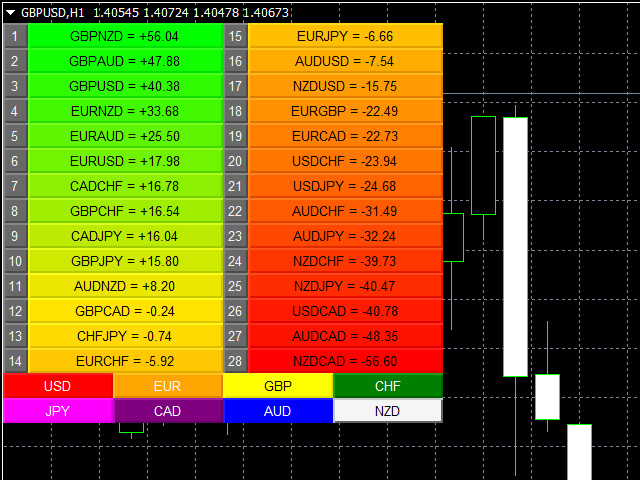
- Switched the colors of the AUD and JPY buttons to match that of Quantum Currency Strength Indicator's
- Button colors can be changed through the Inputs tab.
- The color of each currency pair transitions from green (positive), to yellow (neutral), to red (negative) depending on its performance score
- New input: Bookmarked Currency Pairs - This is a new feature we added to the Currency Matrix which helps you keep track of currency pairs you’re interested in wherever they are in the list.
- New input: Button Size - You can change the size of the toggle buttons and the table by changing this setting. This is especially useful for screens with very low or very high resolutions. Its default value is 1 but you can enter negative values to decrease their size further.
- New input: Font Size - You can change the size of the text by changing this setting.
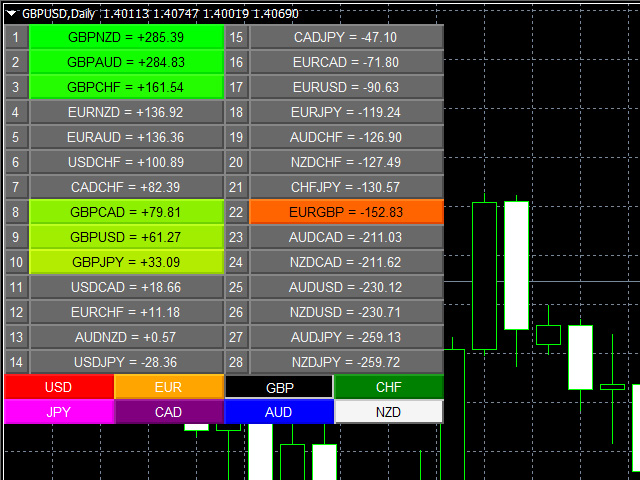
- New input: Use Classic Colors - Instead of using a Green-Red gradient, the indicator switches to a dual color scheme when this setting is true. When using classic colors, all currency pairs with a performance score above 0 are blue and those below it are red.