• Обзор
  • Отзывы
  • Обсуждение
  • Что нового

PSI Position Smart Indicator

NEW check the FULL Version Including the private ICT tools limited so far until the release of the full 2016 Mentorship Core Content to the public.

Indicator type: Money Management Calculator; Forex Position Size Calculator; Fixed or ATR value for Stop Loss and Take Profit levels; Average Position Size Indicator (True Average Price); Account Information; Stop-out Level, Margin and Risk Exposure Warning, Forex Sessions; Institutional Levels Grid; Major Highs and Lows, Detailed Account Report and much more useful tools applicable both for Price Action or Algo Systems Strategies.

The tool is highly recommended if you participate in a Forex challenge or trade for a funded account as you can observe closely to not exceed your lot size exposure or daily draw-down requirements.

Some of the concepts provided by this tool are inspired by the Free YouTube Content of NNFX (No Nonsense Forex) and ICT (The Inner Circle Trader) Channels as well as some of the most popular funded programs and their requirements thus making it very useful and flexible for wide variety of users.

Be Smart! Calculate your position before you apply your strategy. Know where you are standing, what you are risking, what you put on the table and what you expect to gain. Do you know all that? Well don’t make wild guesses. Just know and be relentless!

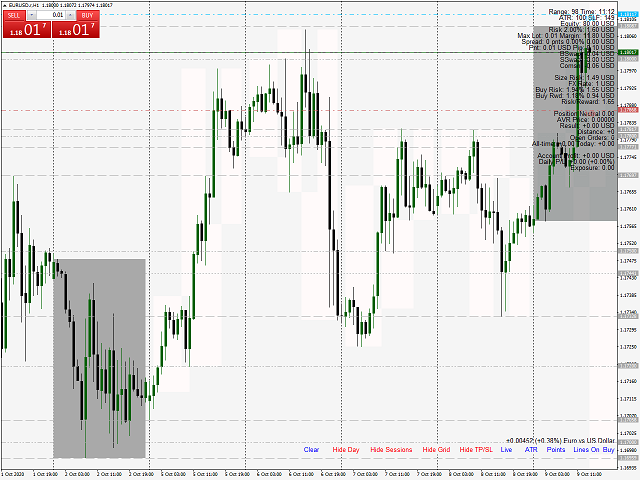
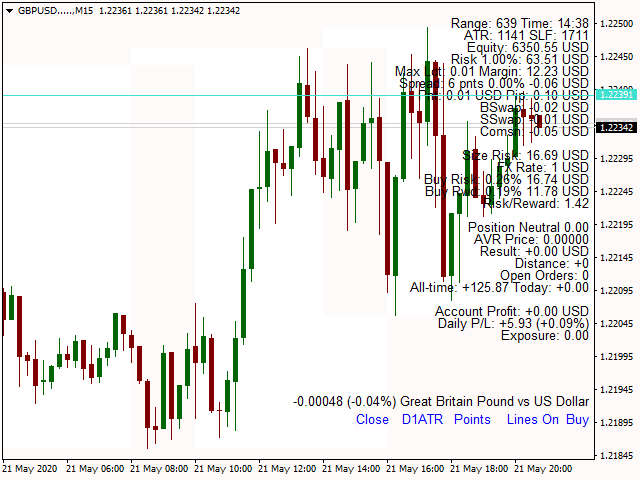
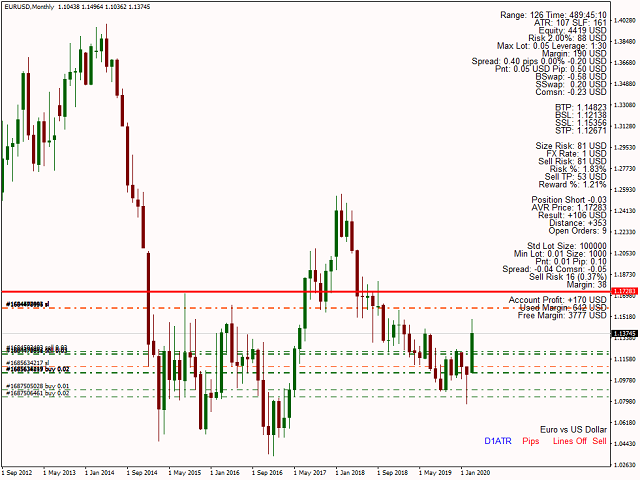
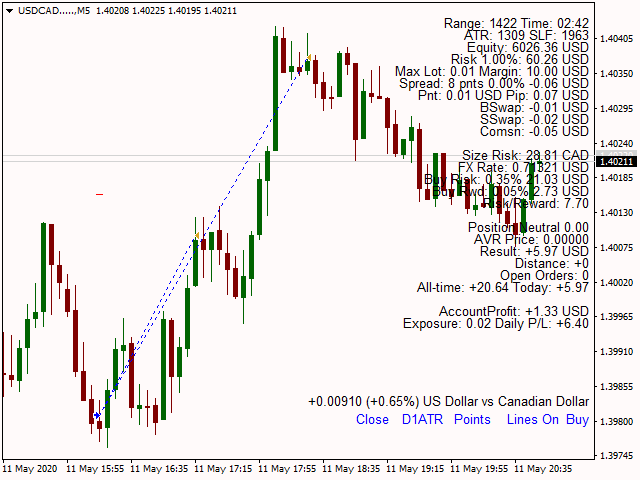
The Position Smart Indicator indicator lets you chose risk parameters and calculates the maximum lot size you have to put in the trade plus many additional information panels with commission, swap, pip and point value, real risk taken, spread in points, value and % of the equity, the real average price of the position (accounts for commissions, swap and hedged trades), net result in deposit currency, pips or points and much more.

Among some of the features you can get from this indicator are:

  • The range and remaining time of the last candle.
  • Stop loss factor. Standard 1.5 times the ATR.
  • Take profit factor. Standard 1.0 times the ATR.
  • The current equity and allowed risk.
  • The maximum allowed lot size.
  • The pip and point value.
  • Spread in points, percentage from the equity and real value in deposit currency.
  • Swap and Commissions.
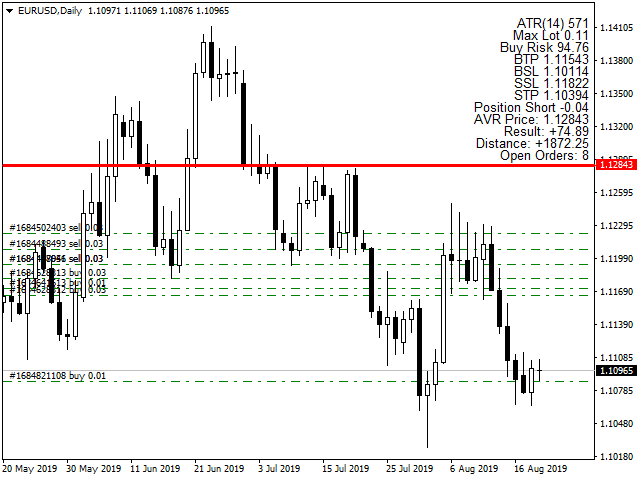
  • Buy Stop Loss, Buy Take Profit, Sell Stop Loss and Sell Take Profit.
  • It also presents commission, swap, the real risk and projected gain based on all hidden costs and maximum allowed lots.
  • The margin requirement for the trade.
  • You can add comments or motivational quotes to your screen or see the instrument description.
  • You can change the font face and size.
  • You can see your overall account equity, free and used margin.
  • You can choose which information panels to show and which to hide. It also lets you use a light version with only the most important information on the screen.
  • You can even use this indicator for trailing stop strategies and scaling out.
  • Average price line with the net position, the size, the net profit and the net distance to break-even.
  • All-time and Daily results, applicable also to Average price if needed.
  • Stop-out Level.
  • Size exposure.
  • Integrated risk and positional warnings.
  • Manual entry and Stop Loss, Take Profit, Risk to Reward calculations.
  • NY Open line and potential London High, Low target.
  • Forex Sessions.
  • Focus on Day of Week Price action.
  • Interactive buttons.
  • Multiple preset brokers and views.
  • ATR Strategies (NNFX).
  • ICT Killzones, Swings, etc. from the free ICT content.
  • Sophisticated Account Report.

Money management is the first and the most important skill you must learn in trading, especially in Forex. Don’t make the mistake anyone else does and learn it the hard way. Use your time and money wisely to acquire this skill.

With this indicator you will have anything you need to precisely position yourself and make smart decisions. If this is not very useful, detailed and pedantic then what is?

Important Note: If you want to test the Demo due to the fact that the MT4 Strategy Tester focus only on the current pair test on pair having your account currency as part of it. For instance open a Demo account in USD and test on EURUSD, GBPUSD, USDJPY, Gold, Silver, etc.

Рекомендуем также
Noize Absorption Index - is the manual trading system that measures the difference of pressure between bears forces and bulls forces. Green line - is a noize free index that showing curent situation. Zero value of index shows totally choppy/flat market.Values above zero level shows how powerfull bullish wave is and values below zero measures bearish forces.Up arrow appears on bearish market when it's ready to reverse, dn arrow appears on weak bullish market, as a result of reverse expectation. S
Super Reversal Pattern Indicator Unlock the power of advanced pattern recognition with our Super Reversal Pattern Indicator. Designed for traders seeking precision and reliability, this indicator identifies one of the most effective reversal patterns in technical analysis, offering a significant edge in your trading strategy. Key Features: Non-Repainting Accuracy: Enjoy the confidence of non-repainting technology. Once a Super Reversal Pattern is detected, it remains static, providing consis
Laguerre SuperTrend Clouds добавляет алгоритм адаптивного усреднения Лагерра (Adaptive Laguerre averaging) и оповещения к широко известному индикатору SuperTrend. Как следует из названия, Laguerre SuperTrend Clouds (LSC) - это трендовый индикатор, который лучше всего работает на трендовых (не переменчивых) рынках. Индикатор SuperTrend чрезвычайно популярен для внутридневной и ежедневной торговли и может быть использован на любом таймфрейме. Внедрение уравнения Лагерра в этот индикатор может спос
TWO PAIRS SQUARE HEDGE METER INDICATOR Try this brilliant 2 pairs square indicator It draws a square wave of the relation between your two inputs symbols when square wave indicates -1 then it is very great opportunity to SELL pair1 and BUY Pair2 when square wave indicates +1 then it is very great opportunity to BUY pair1 and SELL Pair2 the inputs are : 2 pairs of symbols         then index value : i use 20 for M30 charts ( you can try other values : 40/50 for M15 , : 30 for M30 , : 10 for H1 ,
Owl smart levels
Sergey Ermolov
4.34 (35)
Версия MT5  | Как установить?  | FAQ Индикатор Owl Smart Levels   – это полноценная торговая система внутри одного индикатора, которая включает в себя такие популярные инструменты анализа рынка как усовершенствованные   фракталы Билла Вильямса , Valable ZigZag, который строит   правильную волновую структуру   рынка, а также  уровни Фибоначчи,   которые   отмечают точные уровни входа в рынок и места взятия прибыли. Подробное описание стратегии Инструкция по работе с индикатором Советник-помошник
Daily Candle Predictor - это индикатор, который предсказывает цену закрытия свечи. Прежде всего индикатор предназначен для использования на графиках D1. Данный индикатор подходит как для традиционной форекс торговли, так и для торговли бинарными опционами. Индикатор может использоваться как самостоятельная торговая система, так может выступать в качестве дополнения к вашей уже имеющейся торговой системе. Данный индикатор производит анализ текущей свечи, рассчитывая определенные факторы силы внут
Представляем       Графики   Quantum Heiken Ashi PRO Свечи Heiken Ashi, разработанные для обеспечения четкого понимания рыночных тенденций, известны своей способностью отфильтровывать шум и устранять ложные сигналы. Попрощайтесь со сбивающими с толку колебаниями цен и познакомьтесь с более плавным и надежным представлением графиков. Что делает Quantum Heiken Ashi PRO действительно уникальным, так это его инновационная формула, которая преобразует данные традиционных свечей в легко читаемые цветн
Представляем вашему вниманию индикатор "Счётчик закрытия свечи", который станет вашим незаменимым помощником в мире трейдинга. Вот почему знание того, когда свеча закроется, может помочь: Если вы любите торговать, используя свечные паттерны, то вы будете знать, когда свеча будет закрыта. Этот индикатор позволит вам проверить, сформировался ли известный шаблон и есть ли возможность торговли. Индикатор поможет вам подготовиться к открытию рынка и закрытию рынка. Вы можете установить таймер, чтобы
Индикатор отображает на графике данные стохастик-осцилятора более старшего временного интервала. Основная и сигнальная линии отображаются в дополнительном окне. Ступенчатая характеристика не сглажена. Индикатор удобен для отработки "ручных" стратегий форекс-торговли, использующих данные от нескольких экранов с различными временными интервалами одного инструмента. В индикаторе используются настройки, аналогичные стандартному и выпадающий список для выбора тайм-фрейма. Параметры индикатора TimeF
This indicator scans and displays currency pairs that have recently aligned moving averages on a given timeframe. You can configure which pairs the indicator will scan. It also includes all types of alert options. Bullish MA Alignment =  MA1>MA2>MA3>MA4>MA5 Bearish MA Alignment =  MA1<MA2<MA3<MA4<MA5 Features Attach to one chart and scans all the currency pairs configured and visible in the Market Watch Window It can monitor all the available timeframes from M1 to MN1 and sends alerts on ever
Fibonacci retracement and extension line drawing tool Fibonacci retracement and extended line drawing tool for MT4 platform is suitable for traders who use  golden section trading Advantages: There is no extra line, no too long line, and it is easy to observe and find trading opportunities Trial version: https://www.mql5.com/zh/market/product/35884 Main functions: 1. Multiple groups of Fibonacci turns can be drawn directly, and the relationship between important turning points
Title : Market Bias Indicator - Oscillator-Based Trading Tool Introduction : Discover the potential of the "Market Bias Indicator," a revolutionary oscillator-based trading tool designed for precise market analysis. If you're in search of a robust alternative to traditional bias indicators, your quest ends here. Market Bias Indicator offers unparalleled accuracy in identifying market sentiment and is your gateway to confident trading decisions. Recommended Trading Pairs : Market Bias Indicator i
VR Cub
Vladimir Pastushak
VR Cub это индикатор что бы получать качественные точки входа. Индикатор разрабатывался с целью облегчить математические расчеты и упростить поиск точек входа в позицию. Торговая стратегия, для которой писался индикатор, уже много лет доказывает свою эффективность. Простота торговой стратегии является ее большим преимуществом, что позволяет успешно торговать по ней даже начинающим трейдерам. VR Cub рассчитывает точки открытия позиций и целевые уровни Take Profit и Stop Loss, что значительно повы
To get access to MT5 version please click here . - This is the exact conversion from TradingView: "Stochastic Momentum Index" By "UCSgears". - This is a popular version of stochastic oscillator on tradingview. - This is a light-load processing and non-repaint indicator. - Buffers are available for the lines on chart. - You can message in private chat for further changes you need. Thanks for downloading
The Th3Eng PipFinite indicator is based on a very excellent analysis of the right trend direction with perfect custom algorithms. It show the true direction and the best point to start trading. With StopLoss point and Three Take Profit points. Also it show the right pivot of the price and small points to order to replace the dynamic support and resistance channel, Which surrounds the price. And Finally it draws a very helpful Box on the left side on the chart includes (take profits and Stop loss
The Penta-O is a 6-point retracement harmonacci pattern which usually precedes big market movements. Penta-O patterns can expand and repaint quite a bit. To make things easier this indicator implements a twist: it waits for a donchian breakout in the right direction before signaling the trade. The end result is an otherwise repainting indicator with a very reliable trading signal. The donchian breakout period is entered as an input. [ Installation Guide | Update Guide | Troubleshooting | FAQ | A
Heiken Ashi candle chart is an improved version of The Japanese candle chart, which can effectively filter the market "noise" of the Japanese candle chart. It is favored by many traders for its simplicity and intuition. For trend traders, the HA candle chart is a magic tool. Unlike the traditional Japanese candle chart, Heikenashi does not reflect the opening price, high price, low price and closing price of the market. Instead, Heikenashi calculates the value of a single K line in the dominant
Усовершенствованная версия бесплатного индикатора HMA Trend (для MetaTrader 4) , с возможностью статистического анализа. HMA Trend - трендовый индикатор, базирующийся на скользящей средней Хала (Hull Moving Average - HMA) с двумя периодами. HMA с медленным периодом определяет тренд, HMA с быстрым периодом - краткосрочные движения и сигналы в сторону тренда. Главные отличия от бесплатного варианта: Возможность предсказать вероятность разворота тренда с помощью анализа исторических данных; Постр
Уникальная мультивалютная авторская стратегия, одновременно определяющая силу трендов и точки входа в рынок, визуализируя это с помощью гистограмм на графике. Индикатор оптимально адаптирован для торговли на временных периодах М5, М15, М30, Н1. При этом для удобства пользователя по определенной точке всегда появляется точка входа (в виде стрелки), рекомендуемые уровни получения прибыли (TP1, TP2 с текстовыми метками) и рекомендация по установке Стоп Лосс. Уровни получения прибыли (TP1, TP2) авто
Наш индикатор Basic Support and Resistance - это решение, необходимое для повышения технического анализа.Этот индикатор позволяет вам проектировать уровни поддержки и сопротивления на диаграмме/ версия MT5 Особенности Интеграция уровней Fibonacci: с возможностью отображения уровней Fibonacci наряду с уровнями поддержки и сопротивления, наш показатель дает вам еще более глубокое представление о поведении рынка и возможных областях обращения. Оптимизация производительности: При возможности о
ROYAL DUTCH SKUNK USES THE TREND WAVE INDICATOR AND IT CAN IDENTIFY THE BEGINNING AND THE END OF A NEW WAVE TREND MOVEMENT. AS AN OSCILLATOR, THE INDICATOR IDENTIFIES THE OVERBOUGHT AND OVERSOLD ZONES. IT WORKS GREAT TO CATCH THE SHORT TERM PRICE REVERSALS AND USES A MARTINGALE STRATEGY TO CLOSE ALL TRADES IN PROFIT. USE DEFAULT SETTINGS ON H1 OR HIGHER TIME FRAME ON ANY PAIR FOR MORE ACCURATE TRADES WHY THIS EA : Smart entries calculated by 6 great strategies The EA can be run on even a $20000
"Тренд - друг трейдера" . Это одна из самых известных пословиц в трейдинге, потому что правильное определение тренда может помочь заработать. Однако проще сказать о торговле по тренду, чем сделать, потому что многие индикаторы основаны на развороте цены, а не на анализе тренда. Они не очень эффективны при определении периодов тренда или в определении того, сохранится ли этот тренд. Мы разработали индикатор Trendiness Index , чтобы попытаться решить эту проблему. Индикатор определяет силу и напра
This is a new strategy for SUPPLY DEMAND areas It is based on a calculation using the tick volume to detect the big price action in market for both bear /bull actions this smart volume action candles are used to determine the supply and demand areas prices in between main supply and demand lines indicate sideway market  up arrows will be shown when prices moves above the main supply and the secondary supply lines Down arrows will be shown when prices moves below the main demand and the secondary
Master scalping M1 -инновационный индикатор, использующий алгоритм для быстрого и точного определения тренда.Индикатор рассчитывает время открытия и закрытия позиций, алгоритмы индикатора позволяют находить идеальные моменты для входа в сделку (покупки или продажи актива), повышающие успешность сделок у большинства трейдеров. Преимущества индикатора: Прост в использовании, не перегружает график не нужной информацией. Возможность использования  как фильтр для любой стратегии. Работает на рынке
Прежде всего стоит подчеркнуть, что этот Торговый Инструмент является Неперерисовывающимся Нерепейнтинговым Индикатором, что делает его идеальным для профессиональной торговли. Онлайн-курс, руководство пользователя и демонстрация. Индикатор Концепций Умного Действия Цены - очень мощный инструмент как для новичков, так и для опытных трейдеров. Он объединяет более 20 полезных индикаторов в одном, комбинируя передовые торговые идеи, такие как анализ Inner Circle Trader и стратегии торговли конц
Индикатор для бинарных опцыонов стрелочный прост в использовании и не требует настройки работает на всех валютных парах акцыях крипто валюте сигнал на покупку синяя стрелка вверх  сигнал на продажу красная стрелка в низ  советы не стоит торговать во время новостей и за 15-30 минут перед их выходом так как рынок слишком волотилен и очень много шума  входить в сделки стоит на одну или две свечи от текущего периода ( рекомендуется на 1 свечу ) таймфрейм до м 15 рекомендуемый мани менеджмент фиксир
Gold Bricks FX USES THE TREND WAVE INDICATOR AND IT CAN IDENTIFY THE BEGINNING AND THE END OF A NEW WAVE TREND MOVEMENT. AS AN OSCILLATOR, THE INDICATOR IDENTIFIES THE OVERBOUGHT AND OVERSOLD ZONES. IT WORKS GREAT TO CATCH THE SHORT TERM PRICE REVERSALS AND USES A MARTINGALE STRATEGY TO CLOSE ALL TRADES IN PROFIT. USE DEFAULT SETTINGS ON H1 OR HIGHER TIME FRAME ON ANY PAIR FOR MORE ACCURATE TRADES WHY THIS EA : Smart entries calculated by 4 great strategies The EA can be run on even a
Это трендовый индикатор без перерисовки Разработан вместо стратегии бля бинарках опционов (по цвету свечи мартингейл) Так же хорошо работает в торговле на рынке форекс Когда открывать сделки ( бинарные опционы ) Сигнал появится в месте с свечой сигналит на текущую свечу  Открывать сделку стоит на одну свечу текущего таймфрейма рекомендуется м1 и М5 При появлении синей точки открываем сделку вверх При появлении красной точки открываем сделку в низ. Как открывать сделки на Форекс. При полу
Одна из числовых последовательностей носит название - "Последовательность лесного пожара". Она была признана одной из самых красивых новых последовательностей. Её главная особенность заключается в том, что эта последовательность избегает линейных трендов, даже самых кратковременных. Именно это свойство легло в основу этого индикатора. При анализе финансового временного ряда этот индикатор старается отбросить все возможные варианты тренда. И только если это ему не удается, то он признает наличие
Профиль Рынка (Market Profile) определяет ряд типов дней, которые помогают трейдеру распознать поведение рынка. Ключевая особенность - это область значений (Value Area), представляющая диапазон ценового действия, в котором произошло 70% торговли. Понимание области значений может помочь трейдерам вникнуть в направление рынка и установить торговлю с более высокими шансами на успех. Это отличное дополнение к любой системе, которую вы возможно используете. Blahtech Limited представляет сообществу Me
С этим продуктом покупают
Gann Made Easy - это профессиональная, но при этом очень простая в применении Форекс система, основанная на лучших принципах торговли по методам господина У.Д. Ганна. Индикатор дает точные BUY/SELL сигналы, включающие в себя уровни Stop Loss и Take Profit. Пожалуйста, напишите мне после покупки! Я поделюсь своими рекомендациями по использованию индикатора. Также вас ждет отличный бонусный индикатор в подарок! Вероятно вы уже не раз слышали о торговли по методам Ганна. Как правило теория Ганна от
Official Release price of $65 for the first 27 /3 0  copies (3 copies left). Next price is $120 !  Send us a message after your purchase to receive more information on how to get your  BONUS  for FREE  that works in great combination with Bull vs Bear ! Bull versus Bear is an easy-to-use Forex indicator that gives traders clear and accurate signals based on clear trend retests . Forget about lagging indicators or staring at charts for hours because  Bull vs Bear provides real-time entries w
- Real price is 80$ - 40% Discount ( It is 49$ now ) Contact me for instruction, add group and any questions! Related Products:  Bitcoin Expert , Gold Expert Introduction The breakout and retest strategy is traded support and resistance levels. it involves price breaking through a previous level.  The break and retest strategy is designed to help traders do two main things, the first is to avoid false breakouts. Many false breakouts start with a candlestick that breaks out of a level but ends w
FX Volume
Daniel Stein
4.58 (33)
Получайте ежедневную информацию о рынке с подробностями и скриншотами в нашем утреннем брифинге здесь, на mql5 , и в Telegram ! FX Volume - это ПЕРВЫЙ и ЕДИНСТВЕННЫЙ индикатор объема, который дает РЕАЛЬНОЕ представление о настроении рынка с точки зрения брокера. Он дает потрясающее представление о том, как институциональные участники рынка, такие как брокеры, позиционируют себя на рынке Forex, гораздо быстрее, чем отчеты COT. Видеть эту информацию прямо на своем графике - это настоящий геймчей
Прежде всего стоит подчеркнуть, что этот торговый индикатор не перерисовывается, не перерисовывает и не отставает, что делает его идеальным как для ручной, так и для роботизированной торговли. Руководство пользователя: настройки, вводы и стратегия. Атомный аналитик - это индикатор ценового действия PA, который использует силу и импульс цены, чтобы найти лучший край на рынке. Оборудованный расширенными фильтрами, которые помогают убирать шумы и ложные сигналы, и повышают торговый потенциал. Испо
Gold Stuff
Vasiliy Strukov
4.89 (241)
Gold Stuff - трендовый индикатор, разработанный специально для золота, также может использоваться на любых финансовых инструментах. Индикатор не перерисовывается и не запаздывает. Рекомендуемый тайм-фрейм H1.  По данному индикатору написан советник EA Gold Stuff, Вы можете найти его в моем профиле. Свяжитесь со мной сразу после покупки для получения   персонального бонуса!  Вы можете получить бесплатную копию нашего индикатора Strong Support and Trend Scanner, пожалуйста, в личку. мне! Настройки
Инновационный индикатор, использующий эксклюзивный алгоритм для быстрого и точного определения тренда. Индикатор автоматически рассчитывает время открытия и закрытия позиций, а также подробную статистику работы индикатора на заданном отрезке истории, что позволяет выбрать наилучший торговый инструмент для торговли. Вы также можете подключить свои пользовательские стрелочные индикаторы к Scalper Inside Pro для проверки и расчета их статистики и прибыльности. Scalper Inside PRO (версии 6.5 и выше)
Получайте ежедневную информацию о рынке с подробностями и скриншотами через наш утренний брифинг здесь, на mql5 , и в Telegram ! FX Power MT4 NG - это новое поколение нашего популярного измерителя силы валют FX Power. Что же предлагает этот измеритель силы нового поколения? Все, что вы любили в оригинальном FX Power ПЛЮС Анализ силы GOLD/XAU Еще более точные результаты расчетов Индивидуально настраиваемые периоды анализа Настраиваемый предел расчета для еще более высокой производительности Спец
FX Levels - это исключительно точный индикатор поддержки и сопротивления, объединяющий традиционный метод Lighthouse с инновационным динамическим подходом и безупречно работающий на всех торговых инструментах. Это касается и валютных пар, и индексов, и акций, и сырьевых товаров. FX Levels определяет точки разворота и отображает их на графике, которые могут быть идеально использованы в качестве целей прибыли в вашей торговой деятельности. При разработке FX Levels мы использовали наш богатый опыт
The Stochastic Basket Currency Strenght  brings the Stochastic indicator to a new level.  Expanding the boundaries of TimeFrames and mono-currency analysis, the SBCS take the movements of each currency that composes the cross and confront them in the whole basket of 7 crosses.  The indicator works with any combination of AUD, CAD, CHF, EUR, GBP, JPY, NZD, USD pairs and with full automation takes in account every stochastic value (main line) for the selected Time Frame.  After that, the indicator
Trend Pulse
Mohamed Hassan
5 (4)
Halloween Promotion   for   24 hours only   with a   40%   discount on the original price!  $̶6̶5̶  $39 ONLY!  Please contact me after purchase to immediately get your PDF strategy + documentation for Trend Pulse !  Introducing Trend Pulse , a unique and robust indicator capable of detecting bullish, bearish, and even ranging trends! Trend Pulse uses a special algorithm to filter out market noise with real precision. If the current symbol is moving sideways, Trend Pulse will send you a
TPSproTREND PrO
Roman Podpora
4.79 (19)
TPSpro TREND PRO   —  трендовый индикатор, который автоматически анализирует рынок и предоставляет информацию о тренде и каждой его смене а также дающий сигналы для входа в сделки без перерисовки! Индикатор использует каждую свечу, анализируя их отдельно. относя к разным импульсам – импульс вверх или вниз. Точные точки входа в сделки  для  валют, крипты, металлов, акций, индексов! Version MT5           ПОЛНОЕ ОПИСАНИЕ ИНДИКАТОРА           Рекомендуем использовать с  индикатором -  RFI LEVELS
Stratos Pali Indicator   is a revolutionary tool designed to enhance your trading strategy by accurately identifying market trends. This sophisticated indicator uses a unique algorithm to generate a complete histogram, which records when the trend is Long or Short. When a trend reversal occurs, an arrow appears, indicating the new direction of the trend. Important Information Revealed Leave a review and contact me via mql5 message to receive My Top 5 set files for Stratos Pali at no cost! D
Trend Screener
STE S.S.COMPANY
4.81 (88)
Индикатор тренда, революционное уникальное решение для торговли и фильтрации тренда со всеми важными функциями тренда, встроенными в один инструмент! Это 100% неперерисовывающийся мультитаймфреймный и мультивалютный индикатор, который можно использовать на всех инструментах/инструментах: форекс, товары, криптовалюты, индексы, акции. ПРЕДЛОЖЕНИЕ ОГРАНИЧЕННОГО ВРЕМЕНИ: Индикатор скринера поддержки и сопротивления доступен всего за 50$ и бессрочно. (Изначальная цена 250$) (предложение продлено) Tre
Reversal-Arrow: Определите точки разворота с точностью и надежностью Reversal-Arrow — это продвинутый индикатор, созданный для помощи трейдерам всех уровней в определении потенциальных точек разворота тренда. Индикатор предоставляет четкие и визуальные сигналы, чтобы помочь вам лучше понимать рыночный контекст, снижая неопределенность и облегчая процесс принятия решений. Reversal-Arrow оптимизирован специально для пар XAUUSD и XAUEUR на таймфреймах 1 минута, 5 минут и 15 минут, где он показывает
Важным ключевым элементом в трейдинге являются зоны или уровни, от которых принимаются решения о покупке или продаже торгового инструмента. Несмотря на попытки крупных игроков скрыть свое присутствие на рынке, они неизбежно оставляют следы. Наша задача заключалась в том, чтобы научиться находить эти следы и правильно их интерпретировать. INSTRUCTIONS     RUS   -    ENG                    Рекомендуем использовать с индикатором -   TPSpro  TREND PRO -  Version MT5 Основные функции: Отображения ак
Dynamic Forex28 Navigator — инструмент для торговли на рынке Форекс нового поколения. В НАСТОЯЩЕЕ ВРЕМЯ СКИДКА 49%. Dynamic Forex28 Navigator — это эволюция наших популярных индикаторов, объединяющая мощь трех в одном: Advanced Currency Strength28 Indicator (695 отзывов) + Advanced Currency IMPULSE with ALERT (520 отзывов) + CS28 Combo Signals (бонус). Подробности об индикаторе https://www.mql5.com/en/blogs/post/758844 Что предлагает индикатор Strength нового поколения?  Все, что вам нрав
Эта панель показывает последние доступные гармонические паттерны для выбранных символов, так что вы сэкономите время и будете более эффективны / MT5 версия . Бесплатный индикатор: Basic Harmonic Pattern Колонки индикатора Symbol: отображаются выбранные символы Trend : бычий или медвежий Pattern : тип паттерна (Гартли, бабочка, летучая мышь, краб, акула, шифр или ABCD) Entry : цена входа SL: цена стоп-лосса TP1: цена первого тейк-профита TP2: цена второго тейк-профита TP3: цена 3-го тейк-про
Scalper Vault — это профессиональная торговая система, которая дает вам все необходимое для успешного скальпинга. Этот индикатор представляет собой полную торговую систему, которую могут использовать трейдеры форекс и бинарных опционов. Рекомендуемый тайм фрейм М5. Система дает точные стрелочные сигналы в направлении тренда. Она также предоставляет вам сигналы выхода и рассчитывает рыночные уровни Ганна. Индикатор дает все типы оповещений, включая PUSH-уведомления. Пожалуйста, напишите мне после
Gold Channel is a volatility-based indicator, developed with a specific timing algorithm for the XAUUSD pair, which consists of finding possible corrections in the market. This indicator shows two outer lines, an inner line (retracement line) and an arrow sign, where the theory of the channel is to help identify overbought and oversold conditions in the market. The market price will generally fall between the boundaries of the channel. If prices touch or move outside the channel it is a tra
В настоящее время скидка 20%! Лучшее решение для новичка или трейдера-эксперта! Эта приборная панель работает на 28 валютных парах. Он основан на 2 наших основных индикаторах (Advanced Currency Strength 28 и Advanced Currency Impulse). Он дает отличный обзор всего рынка Forex. Он показывает значения Advanced Currency Strength, скорость движения валюты и сигналы для 28 пар Forex на всех (9) таймфреймах. Представьте, как улучшится ваша торговля, когда вы сможете наблюдать за всем рынком с пом
Currency Strength Wizard — очень мощный индикатор, предоставляющий вам комплексное решение для успешной торговли. Индикатор рассчитывает силу той или иной форекс-пары, используя данные всех валют на нескольких тайм фреймах. Эти данные представлены в виде простых в использовании индексов валют и линий силы валют, которые вы можете использовать, чтобы увидеть силу той или иной валюты. Все, что вам нужно, это прикрепить индикатор к графику, на котором вы хотите торговать, и индикатор покажет вам ре
В НАСТОЯЩЕЕ ВРЕМЯ СКИДКА 26% Лучшее решение для новичка или трейдера-эксперта! Этот индикатор является уникальным, высококачественным и доступным торговым инструментом, поскольку мы включили в него ряд собственных функций и новую формулу. С помощью всего лишь ОДНОГО графика вы можете определить силу валюты для 28 пар Форекс! Представьте, как улучшится ваша торговля, потому что вы сможете точно определить точку запуска нового тренда или возможность скальпирования? Руководство пользователя:
Ultimate Gold Advisor для MetaTrader 4 Ultimate Gold Advisor — это продвинутый технологический инструмент, созданный для оптимизации торгового процесса на MetaTrader 4. Разработанный для удовлетворения потребностей опытных трейдеров, этот индикатор сочетает точность, сложный анализ и многофункциональность, предоставляя поддержку для принятия обоснованных торговых решений. Идеально подходит для торговли золотом, но также применим к широкому спектру активов. Ultimate Gold Advisor может помочь вам
Данный индикатор основан на математике великого трейдера W.D.Ganna.  С помощью его мы с легкостью найдете сильные уровни анализируя свинг для поиска оптимальной точки входа. Индикатор работает на всех инструментах и всех тайм фреймах. Индикатор полностью ручной и оснащен кнопками управления. Все что вам нужно это нажать на кнопку NEW, появится отрезок, данный отрезок вы размещаете на любое движение, свинг или даже 1 свечу, которую хотите проанализировать. Разместив отрезок нажимаете кнопку ОК. П
Представляем ON Trade Waves Patterns Harmonic Elliot Wolfe, передовой индикатор, разработанный для обнаружения разнообразных рыночных паттернов с использованием как ручных, так и автоматизированных методов. Вот как это работает: Гармонические паттерны: Этот индикатор может определять гармонические паттерны, появляющиеся на вашем графике. Эти паттерны важны для трейдеров, практикующих теорию гармонической торговли, как это описано в книге Скотта Карни "Гармоническая Торговля том 1 и 2". Независи
Market Structure Patterns   is an indicator based on   smart money concepts   that displays   SMC/ICT   elements that can take your trading decisions to the next level. Take advantage of the   alerts ,   push notifications   and   email messages   to keep informed from when an element is formed on the chart, the price crosses a level and/or enters in a box/zone. Developers can access the values of the elements of the indicator using the   global variables  what allows the automation of trading
IX Power MT4
Daniel Stein
4.67 (6)
IX Power , наконец, предлагает непревзойденную точность FX Power для нефорексных символов. Он точно определяет интенсивность краткосрочных, среднесрочных и долгосрочных трендов в ваших любимых индексах, акциях, товарах, ETF и даже криптовалютах. Вы можете анализировать все, что может предложить ваш терминал. Попробуйте и почувствуйте, как значительно улучшается ваш тайминг при торговле. Ключевые особенности IX Power 100% точные результаты расчетов без перерисовки - для всех торговых сим
Advanced Supply Demand
Bernhard Schweigert
4.91 (295)
Этот индикатор является уникальным, качественным и доступным инструментом для торговли, включающим в себя наши собственные разработки и новую формулу. В обновленной версии появилась возможность отображать зоны двух таймфреймов. Это означает, что вам будут доступны зоны не только на старшем ТФ, а сразу с двух таймфреймов - таймфрейма графика и старшего: отображение вложенных зон. Обновление обязательно понравится всем трейдерам, торгующим по зонам спроса и предложения. Важная информация Для мак
В настоящее время скидка 20%! Эта приборная панель - очень мощное программное обеспечение, работающее на нескольких символах и до 9 таймфреймов. Он основан на нашем основном индикаторе (Лучшие отзывы: Advanced Supply Demand ).   Приборная панель дает отличный обзор. Она показывает:  Отфильтрованные значения спроса и предложения, включая рейтинг силы зон, расстояния между пунктами в зонах и внутри зон, Выделяются вложенные зоны, Выдает 4 вида предупреждений для выбранных символов на всех (9)
Другие продукты этого автора
PSI  Cancel Pending script deletes pending positions. Check out also other free PSI scripts and indicators like adding Stop Loss , Take Profit Levels , closing Hedged Orders , Average Price , etc. Check out also the   Position Smart Indicator   - a powerful Money Management tool (and much more) both useful for Price Action and Algo traders . NEW check the FULL Version Including the private ICT tools limited so far until the release of the full 2016 Mentorship Core Content to the public. It has
FREE
PSI  Close by Hedge script closes out balanced trades. It is much more easier and cost efficient to use hedges (limit order by the One Click Trading) to partially exit at better prices. As you get filled and control you break even price and net position with PSI Average Price  the script will close the positions from oldest to newest. It also prints valuable information in the Expert tab about the overall position before and after the script. You can chose to cancel automatically any remaining
FREE
PSI  SL/TP script adds preset Stop Loss or Take Profit levels on all naked positions with just one click. It is easier then to modify and drag the levels with the One Click Trading. Additional settings and warnings especially if you put too tight Stop Loss in comparison to the spread. Check out also the   Position Smart Indicator  - a powerful Money Management tool (and much more) both useful for Price Action and Algo traders . NEW check the FULL Version Including the private ICT tools limited
FREE
PSI  SL/TP script (defaulted to points and Print MSG) adds preset Stop Loss or Take Profit levels on all naked positions with just one click. It is easier then to modify and drag the levels with the One Click Trading. Additional settings and warnings especially if you put too tight Stop Loss in comparison to the spread. Check out also the   Position Smart Indicator  - a powerful Money Management tool (and much more) both useful for Price Action and Algo traders . NEW check the FULL Version Incl
FREE
PSI tools delivers new special look aimed to bring Detailed Account Statement for all important statistics. The integrated MT4 is not accurate. It does not account correctly for Deposits, Withdrawals and completely ignores cases like hedged trades, break-even trades, other broker related credits, bonuses and so on events and as a result all statistics like draw-down, total trades, average win size, rate and so on are totally skewed. PSI corrects these mistakes. In the example below a demo accou
ICT Core Content Concepts turned into indicator plus all previous tools known from the  Position Smart Indicator . This makes it the Full PSI Private Version ( read more ) restricted up to now but available only after the Mentorship Core Content was made public on   YouTube. You will find many price action study tools like: Central Bank Dealing Range - CBDR Asian Range FLOUT Profiles and SD targets on the CBRD, Asian Range and Flout both on the   wicks   and on the   bodies Seek & Destroy Profil
PSI tools   delivers new special look aimed to bring Detailed Account Statement for all important statistics. The integrated MT4 is not accurate. It does not account correctly for Deposits, Withdrawals and completely ignores cases like hedged trades, break-even trades, other broker related credits, bonuses and so on events and as a result all statistics like draw-down, total trades, average win size, rate and so on are totally skewed. PSI corrects these mistakes. In the example below a demo acc
This is the MT5 version of the absolute OCD tool that delivers Position Size Calculator and many more other options of the matured  PSI Position Smart Indicator NEW check the FULL Version Including the private ICT tools limited so far until the release of the full 2016 Mentorship Core Content to the public. Indicator type: Money Management Calculator; Forex Position Size Calculator; Fixed or ATR value for Stop Loss and Take Profit levels; Average Position Size Indicator (True Average Price); Acc
ICT Core Content Concepts turned into indicator plus all previous tools known from the  Position Smart Indicator . This makes it the Full PSI Private Version ( read more ) restricted up to now but available only after the Mentorship Core Content was made public on   YouTube. You will find many price action study tools like: Central Bank Dealing Range - CBDR Asian Range FLOUT Profiles and SD targets on the CBRD, Asian Range and Flout both on the   wicks   and on the   bodies Seek & Destroy   Prof
Фильтр:
Нет отзывов
Ответ на отзыв
Версия 8.1 2023.10.02
Error comments typo fix for No Trades Yet.
Версия 8.0 2023.01.28
Added the Current or the Last created (Mutable) Fractal.
Версия 7.9 2023.01.28
Better Intermediate Highs and Lows fractals representation.
Версия 7.8 2023.01.26
Sessions update.
Версия 7.7 2023.01.26
Session's duration tooltip check improvement.
Версия 7.6 2023.01.26
Added three more versions V7,V8,V9 (same as V1 for labels) but are used for quick AVR Price settings control:
- AVR Price on Open Positions including Add All Past Trades
- AVR Price on Open Positions including Current Day's Closed Trades
- AVR Price on Open Positions including only Manual Past Closed P/L (if any submitted)
Версия 7.5 2023.01.08
Added another quick change version between full extended report and light version with just core report statistics plus other improvements.
Версия 7.4 2022.12.28
Fixed and rearrange sections in Report.
Версия 7.3 2022.12.28
Added ability to change AVR Holding time in Hours, Minutes or Seconds and calculate it based on the selected aggregation method by Position, Daily Sessions, Weekly and so on into the Detailed Report Tool.
Версия 7.2 2022.12.26
Typos correct in parameters and explanations. Renamed Partials to Positions.
Версия 7.1 2022.12.18
Discover a new powerful Accounting Tool that gives you ability to consolidate the trades correctly and the way you want them to be presented as a singular trade idea. You could do such consolidations based on Daily, Weekly, Monthly and so on. Total of 8 unique consolidation options. Each of them helps the traded to focus on his style rather than a single complimentary partials or hedge trades that clutters the report and make able to see his total and meaningful Daily performance or Monthly, etc.
Additionally this version gives choice to hide sensitive information for the account from the main view.
Версия 7.0 2022.12.14
Few tweaks including buttons' click skip when certain range or session selection is not applicable due to higher time frame. Typical overlays are targeted for H1 or lesser timeframes.
Версия 6.9 2022.12.08
Indicator Facelift. Newer settings explanations sections, no lag response on buttons control plus many more functionalities for the Account Report function on top of the extract report like customizable Risk dial up or dial down suggestions, etc.
Версия 6.8 2022.11.22
Reduced Alarm frequencies when parameters are wrong and need to be fixed.
Версия 6.7 2022.11.16
Renamed ICT Swing Fractals.
Версия 6.6 2022.02.08
Day of Week update on M1.
Версия 6.5 2022.02.07
Account with no trades Average Holding Time fix.
Версия 6.4 2022.01.08
Font change.
Версия 6.3 2022.01.08
Few improvements on lines like the NY Midnight and London Judas Swing ICT lines.

Few more stats and improvements on the Detail Report most important of them is new capability of addressing partial closes.

Let say you entered a trade and you took 5 partial profits until you close it. In the end the MetaTrader 4 will report that as 5 small wins but in reality that is one larger win and thus MetaTrader 4 skews the results of your actual win to lose statistics. It makes your profit percentage unrealistically much higher and our profit to loss ration much worse.

The PSI Detail Report fixes that as much as possible. Since closed orders in the MetaTrader 4 are followed not by entry point but by ID when opening and closing multiple partials of different positions at the same time if the order is not followed ideally it will stack most of the partials together but not all. To help whit that you can use the focus on particular pair Report.

Ideally focusing only on one trade idea at the same time and especially using the PSI Close By Hedge script and using the PSI Detail Report capability fixes all of these problems.

Let say you open a trade and it goes against you so you close 50% partial to reduce risk. Then it turns positive and you close 25% partial on profit and let the rest run. You close the rest on higher profit and making break even, smaller loss or a profit for the day in the end MetaTrader 4 will report that in the statement as if you had 1 loss and 2 smaller wins for the day when in realty this is just one single trade idea. It is just 1 win or just 1 break even or just 1 small loss trade which is a combination of 3 partial closes - 1 partial loss and 2 partial wins.
Версия 6.2 2021.09.21
Additional distance multipliers to chose from when your screen resolution makes rows and buttons too stacked together on the default settings.
Версия 6.1 2021.09.10
Added alert if you enter a Simulated Amount which less than the actual Absolute Drawdown for the Reporting tools.
Версия 6.0 2021.09.10
Added Alert on section XV if wrong Symbol is entered for the focused on particular symbol Account Report.
Added also to the Report Average Consecutive Profit or Loss statistic.
Версия 5.9 2021.09.05
Added more color auto-fixes if it happens to plot the indicator on a chart with a matching background.
Версия 5.8 2021.09.05
Edit the Error Message regarding Symbol Suffix when applicable.
Версия 5.7 2021.09.05
Added Error Alerts for wrong Parameter Input.
Версия 5.6 2021.09.02
Added option for Offline Money Balance which affects the Account Report as well as the Risk.

Essentially you can deposit let say 40% of your money at the broker but evaluate your risk and your performance as if you have deposited all your dedicated money at the broker.

However the risk is still limited to the free margin available (and the safety margin option). So Performance is calculated based on the Total Balance. Risk is also calculated based on the Total Balance but also limited on the accrual broker plus self-imposed margin restrictions as per the Account Equity available at the broker.
Версия 5.5 2021.08.29
Improvement on the Swing Fractals. Focus more on the Intermediate Swings. Option for all Swings remains.
Intermediate Swing High has a Lower High to the left and a Lower High to the right.
Intermediate Swing Low has Higher Low tho the left and Higher Low to the right.
Версия 5.4 2021.08.27
In addition to the Account Report there is an option to totally ignore any Transfers (Deposits, Withdrawals, Broker related funds) and just focus on the statistics with Simulated Starting Amount.
It works also in conjunction with focusing option on a particular pair only.
Версия 5.3 2021.08.26
Latest version of the PSI tool delivers new special look aimed to bring you Detailed Account Statement for all important statistics. The integrated MT4 is not accurate. It does not account correctly for Deposits, Withdrawals and completely ignores cases like hedged trades, break-even trades, other broker related credits, bonuses and so on events and as a result all statistics like draw-down, total trades, average win size, rate and so on are totally skewed. PSI corrects these mistakes. In the example below a demo account was aimed to represent such case. The Maximal and Relative Draw-down according to MT4 were whooping 44% while the majority of this draw-down was achieved at time when the account was more then 10 times bigger after a huge deposit. So in a effect all trades were partitioned by their contribution at the account current state. So in reality the draw-down was much smaller in % terms at all times. In addition there are other tools and statistics. Like holding time, consecutive trades, two nearest Peaks and latest recovery against them. This is useful if you follow ICT recommended MM tactics to dial down risk after a loss and dial up only if you recover at least 50% of the latest drop in equity. You can also target the Report for only one specific instrument and ignore others or add or subtract amounts from the balance to fit your specific needs. Let say you deposited only 20% of your dedicated money at the broker and leave the rest at your account but you trade as if you deposited them fully. So with this indicator your account statistics will be based on the full dedicated amount not what is shown in MT4.
Версия 5.2 2021.08.11
New cool features and more options for customizations. Now the tool can plot fractals based on the ICT inspired swings on 3 consecutive candles study.
Версия 5.1 2021.08.04
Версия 5.0 2021.07.30
Another cool update. Now with just one button you can scroll through Off mode, favorite Version 1 and Version 2 plus two more special versions that focus more on open positions management rather than risk parameters on new ones.
Версия 4.9 2021.07.28
Small fix on short orders not showing exposure when a stop loss is not applied.
Версия 4.8 2021.07.28
Improvement on the Forex Sessions and the Day on Focus ranges.
Версия 4.7 2021.07.27
Added ability to plot the Forex Session range on the candle bodies instead of wicks.
Версия 4.6 2021.07.27
Added more custom sessions. ICT inspired Killzones.
Added range labels for all sessions as well as other tool-tip descriptions for each plotted line or tool.
Added special button layout with minimum names and space taken.
Divided the tool different options in categories with most frequently changed options on top for better use and customization.
Each category has basic explanation and credits the popular and original source for its inspiration. Research on these is recommended.
Версия 4.5 2021.07.19
Added button for easy switch between primary and secondary favorite display options.
Added On/Off button to hide and to display the selected options. Useful if for a moment the user wants to hide the labels for more chart area.
Added additional days for the Vertical Line on a custom delineating period. Usually the analysis is done on the New York midnight open (default).
Версия 4.4 2021.07.15
Added Vertical Line for the NY Midnight Open or any custom period.
Версия 4.3 2021.02.06
Corrected typo in text.
Версия 4.2 2021.02.06
New abilities like:
- add dividends for past performance results;
- new other options for Allowed Margin tolerance on new trades;
- display spread as percentage from the current candle range;
Версия 4.1 2020.10.09
Added buttons for ON/OFF Forex Sessions as well as Focus ON/OFF on a specific Day of the Week.

Let say you want to visually compare and highlight the price action for the last few Friday sessions. On D1 time-frame candles are pointed with arrows.
Версия 4.0 2020.10.08
Optimization.
Версия 3.9 2020.10.08
Added ability add more then one Previous Day's High and Low Lines.

Added Day of week to charge 3 days swap rollover.

Версия 3.8 2020.10.07
Added auto map of major Highs and Lows for the past and current month and week.

Grid line on common institutional levels Zero, 50 plus 20 and 80 level.

New York Open Price (price during Midnight hour of NY Time) and Potential 33 pip target for a London High on a Bearish Bias Day or vice versa.

Manual Stop Loss, Take Profit targets and Manual Entry price for Money Management simulation on the outcome.

Added Clear Button to clear the Chart from manually drawn objects (or by changing the time frame). In order to keep your objects rename them after creating (maybe just add some prefix).

PSI is not only just an MM tool but has lot's of options to work with from a Price Action stand point of view or an Algo trading.

Added additional preset Brokers.
Версия 3.7 2020.06.04
Added FTMO.
Версия 3.6 2020.05.21
Added optional Previous Day High and Low lines as possible guidance about liquidity targets.
Версия 3.5 2020.05.21
Added Forex Sessions. You can enable Asian, London and New York Session or some custom session you want to watch out for patterns or time of day you want to focus in trading. Adjust the open and close hours depending on local and server time, DST and so on. You can add or subtracts hours depending which you are interested the most.
Версия 3.4 2020.05.03
Added two more optional and more optimal views and warning about exposure limits. Especially useful for proprietary accounts.
Версия 3.3 2020.04.29
In some OS and MT4 resolutions the rows and buttons are too stacked together and ruin the visualization. To address that a fix adds font and buttons distance multiplier to separate them nicely.
Версия 3.2 2020.04.25
Added buffer for the ATR so you can hover over candles and see the ATR value in the Data Window without the need of external ATR indicator.

Also note that the Break-even Stop Loss to be considered eligible to free protected lots from the total exposure has to be at least 1 point positive. Not exactly as the Entry price.
Версия 3.1 2020.04.24
Added current Exposure in Lots. Orders that are protected with at least Break-Even Stop Loss are not counted to the total exposure. This is useful if you have set exposure limits that you shouldn't exceed. Very needed if you trade for propriety account with risk parameters.

Also added the Daily P/L for all instruments.

The average price can be affected by the all-time result in the current instrument, only by today's result and also adding additional custom result.

Added additional broker to the mix.
Версия 3.0 2020.04.16
Fix for the Stop-Out price when the Average Price Level is altered through usage of result achieved by today's closed trades or by the manually entered mount (or sum of both).
Версия 2.9 2020.04.14
Added information with All Time results on the current instrument and only closed trades from today - Today's Profit or Loss. Ability to automatically include today's results into the Average Price and Average Result. Still the Average Price can be adjusted with custom amount instead of that.

All that is great for Hedging positions.
Версия 2.8 2020.04.14
Added daily gains for the instrument within the symbol description.
Версия 2.7 2020.04.07
Now you can add custom Profit or Loss amount of previous close trades for instance to adjust the AVR Price Level and AVR Result.

This is useful if you hold a position but you have already closed few hedges and you want to know the real AVR Level based on the relative trades you want to include not only by the current open orders.
Версия 2.6 2020.04.06
Now you can set a Maximum Allowed Lot Size when your Risk Profile allows you more than you actually want at the moment. This way you can limit your size without the need of reducing your Risk Profile just to do that.
Версия 2.5 2020.04.01
Small fix on the maximum allowed lot size on NGAS allowing less than the minimum lot size (for rare instruments with size step 1).
Версия 2.4 2020.03.31
Simple color change.
Версия 2.3 2020.03.30
Added warning if the current entry based on last candle closed prices or Manual ATR entry is not valid due the fact priced moved so much that it already hit Stop Loss or Take Profit levels.
Версия 2.2 2020.03.29
Added new functionalities.

Among them warnings if Margin Requirements are exceeded or when preset Margin Level is Reach for new position. This means the Risk should be lower to lower the Position Size. Either by lowering the Risk or manually prefer lower ATR.

Added new button for ATR Stop Loss and Take Profits calculated based on the Live Prices or much better on the last candle Closed price.

Close means that the referential price for entry is the last candle close. This gives advantage to enter in much better risk to reward ratios (if you delay your entry for some reason) and the targets are calculated on the time of the signal. This is due to the fact the majority of indicator signals or price action patterns are confirmed only after the candle is closed not during its shaping.

If you are much closer to the candle's closing (something you can also check in the indicator under in the candle remaining time) you may switch to Live prices as they will be much more closer to the next referential price as the previous one could be already way off.
Версия 2.1 2020.03.26
Added support also for swap calculated in USD base.
Версия 2.0 2020.03.25
Added support also for swap calculated in percentage terms (by interest).
Версия 1.9 2020.03.24
Rearranged labels in Custom Lot panel - added swap.
Версия 1.8 2020.03.23
Improvement of the labels and the visualization of the new cool Stop-out Level feature.

Stop-out Level helps you make better decisions when opening positions with higher risk tolerance - especially on smaller accounts or when you aim to build a long term position on a trading instrument with multiple aggregate entries.
Версия 1.7 2020.03.23
Added list of brokers to chose from with most of the ECN instruments fully optional on the fly instead of manually set some non-generic parameters that might rarely occur in some instruments.

This concerns mostly margin requirements and tick value on some instruments that differ for each broker.

Fix for some brokers that may have additional string value for the currency pairs. For example instead of AUDCAD to be AUDCAD-ECN.

Added Stop-out Level and lot's of other features like the ability to switch between different view options with single click and so on.

NB! With the Generic Broker function and all available options you can fix the calculator to work even on the strangest instruments and conditions that your broker provides. If such instrument occurs on your broker just follow the instructions and hit the correct indicator settings to match it. Do that while testing on Demo and save the template.

More brokers will be added in the feature to extend preset coverage of such cases. Upon purchase of the indicator you can request you broker and instrument of choice to be added to the list.
Версия 1.6 2020.03.17
Added some new functionalities mostly concerning commissions and margin requirements.

You are able to chose between flat commission in deposit currency per standard lot size according to the broker's specification for the instrument or use a commission calculated on a dollar amount traded as some brokers do.

Also you can opt out for a standard margin requirements suitable for most instruments and brokers or if this list doesn't work for a particular case you still can use the Multiplier Fix to align the calculator with that.

As always test on a Demo account to be sure about the inputs you will need if they are required as some special cases can be presented as each broker may have different specifications for indices, commodities, non-major currencies, etc.
Версия 1.5 2020.03.10
Added new features including ability to switch between round account numbers or the normal view with 2 decimal points.
Версия 1.4 2019.10.01
Added button to use Daily ATR for all timeframes or use the ATR of the current timeframe. Also ability to hide buttons if there are not needed.
Версия 1.3 2019.08.31
Better labels.
Версия 1.2 2019.08.30
Added Chart Buttons for PSI:

- Switch directly from the chart from Buy to Sell risk calculations.
- Show or hide Stop Loss and Take Profit Lines.
- Last but not least ability to switch from points to pips and vice versa.
Версия 1.1 2019.08.24
Changed Font Color to White if the user Background color is Black.