• Обзор
  • Отзывы (5)
  • Обсуждение (20)
  • Что нового

Ace Supply Demand Zone MT4

4

Ace Supply Demand Zone Indicator

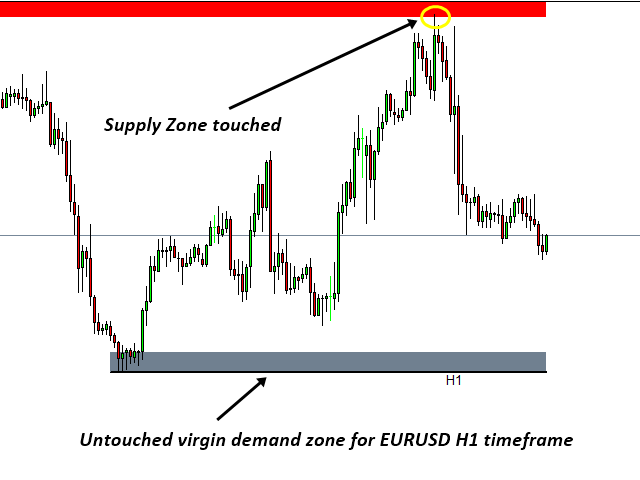
The concept of supply demand relies on the quantity mismatching between buying and selling volumes in the financial market. Supply and demand zone can provide the good entry and exit. A zone is easier to trade than a line. The supply demand zone can provide the detailed trading plan and the risk management. Its ability to predict market direction is high. There are two distinctive points about Ace Supply Demand Zone Indicator. Ace Supply Demand Zone indicator was built on the non-repainting and non-lagging principle. If you have a choice, choose non-repainting and non-lagging system always.

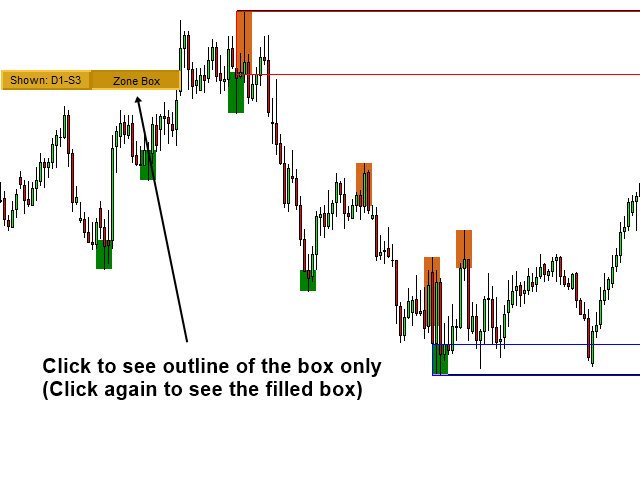
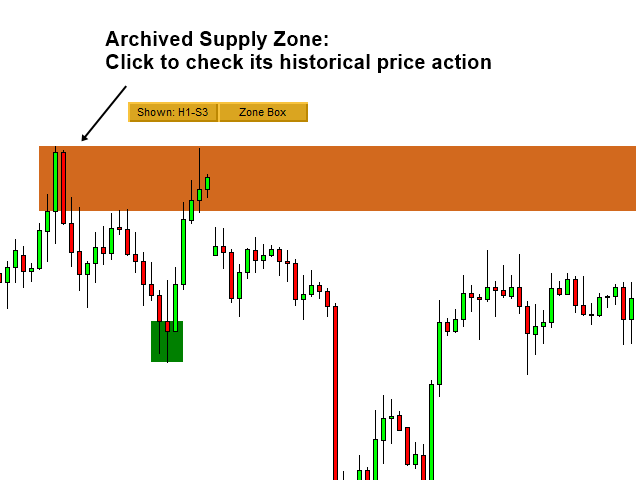
Since this is non repainting supply demand zone indicator, you can use the historical supply and demand zone as the horizontal support and resistance. For example, at some point, any supply and demand zone will be penetrated. Once they are penetrated, the indicator automatically achieves these supply and demand zones. The historical zone will be displayed with short box instead of the extended box in your chart. You can always extend the box again by clicking them if you wish. Even after their life ended, they can serve you to draw the great breakout or reversal zone in your chart. With the historical supply and demand zone, you can use them to improve the trading performance on top of the original supply and demand zone strategy. You can consider it as the automatic horizontal support and resistance indicator in this end. Hence, Ace Supply and Demand indicator is highly valuable comparing to any other supply and demand indicator on the internet.


Main Features

  • Multiple timeframe scanning for the important supply demand zone

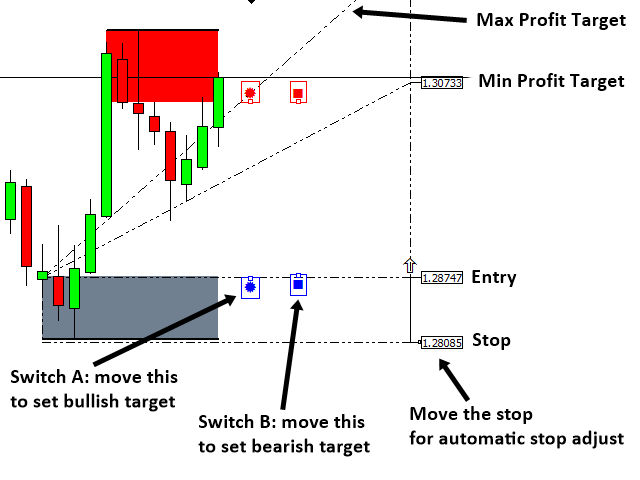
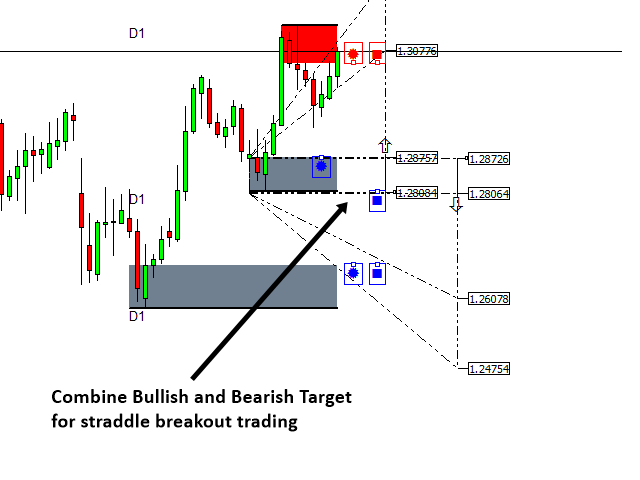
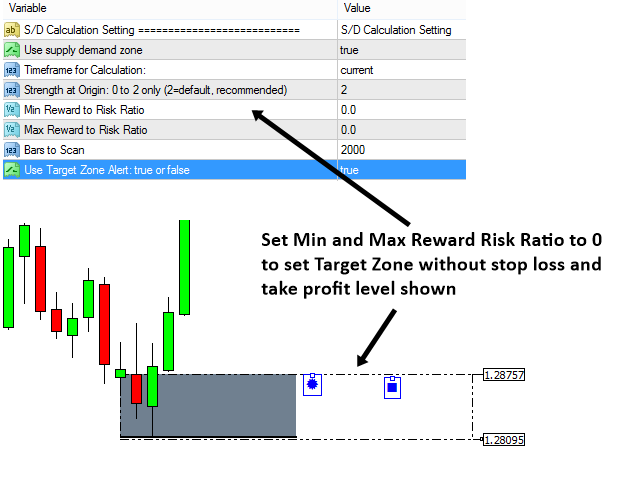
  • Automatic profit target and stop loss detection for any supply demand zone

  • Daily, Weekly and Monthly Market Profile Analysis to further gauge the mean reversion characteristics of market (Value area and point of control calculation included.)

  • Daily, Weekly, Monthly Pivot Analysis to improve your mean reversion analysis

  • Capability to do multiple time frame analysis on the same chart (Recommended to use no more than two zones per chart)

  • Automatic Retouch detection of each supply demand zone. (Easy to identify which zone is virgin and which are not.)

  • Sound, Email, Push notification is possible when any supply demand zone is touched or detected


Trading Direction

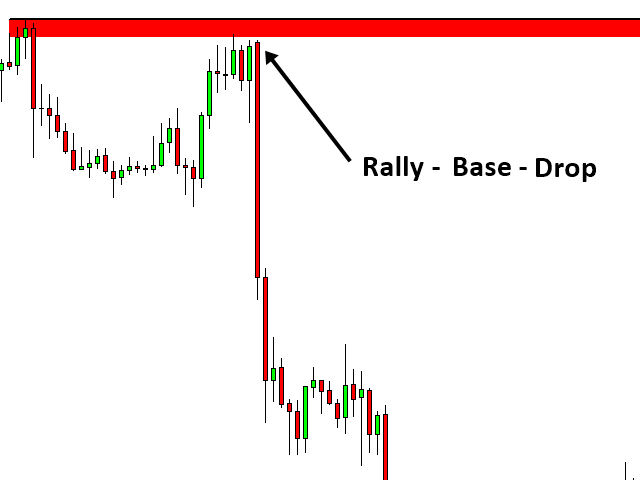
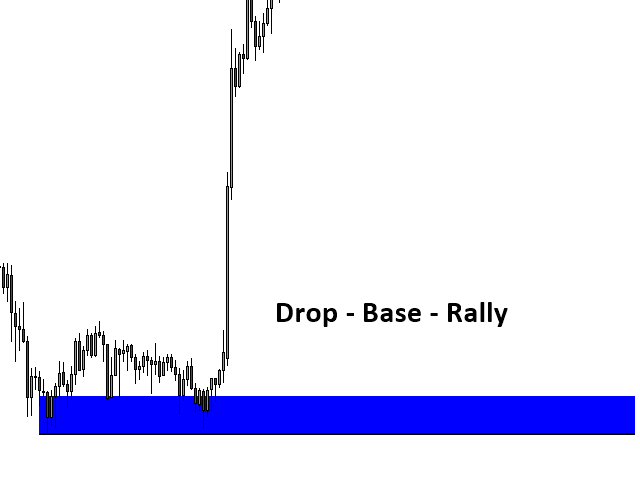
You can perform the typical supply and demand zone trading. For example, you can use Supply and Demand Zone to predict market direction (Drop Base Rally pattern, Rally Base Drop pattern, Rally Base Rally pattern, Drop Base Drop pattern). Secondly, you can also use the supply demand zone as the horizontal support and resistance. On top of that, you can use Market Profile as an additional decision making tool.


About Market Profile

This indicator offers daily, weekly and monthly Market Profile to gauge the odds of the mean reversion for the market. To construct the market profile, the timeframe for chart must be carefully chosen for the proper calculation of Market Profile. Normally it is important to recognize the price movement outside the value area.

    • Daily Market Profile: M5 to H1 timeframe can be used. M30 is recommended.

    • Weekly Market Profile: M30 to H4 timeframe can be used. H1 is recommended.

    • Monthly Market Profile: H1 to D1 timeframe can be used. H4 is recommended.


    Trading Strategy Guide

    The good trading strategy guide for the supply demand trading can be fround from Technical Analysis in Forex and Stock Market (Supply Demand Analysis and Support Resistance, 2021). In addition, you can also use the book: Science Of Support, Resistance, Fibonacci Analysis, Harmonic Pattern, Elliott Wave and X3 Chart Pattern (In Forex and Stock Market Trading, 2021) to find out the explanation for support and resistance as well as other advanced technical anaysis. Please visit the link below for more details about the trading strategy guide with supply demand zone trading.

    Supply Demand Zone Trading Guide: https://www.mql5.com/en/blogs/post/750386


    Important Note

    This is the off the shelf product. Therefore, we do not accept any modification or customization request on this product. In addition, we do not provide any code library or any support for your coding for this product.

    Отзывы 5
    lauro1956
    4476
    lauro1956 2022.08.24 09:56 
     

    The cleanliness and clarity that this indicator provides is greatly appreciated, unlike others that fill your screen without offering any solutions.... The best supply and demand indicator... 5 stars

    turky7713
    466
    turky7713 2021.05.13 00:55 
     

    hi Ace Supply Demand Zone MT4 Indicator has been rented for a month

    cassanonicholas
    141
    cassanonicholas 2021.04.04 10:41 
     

    The best indicator of the market, supply and demand zones are always respected. Since I use this indicator I see profits. If you use the indicator targets for entry, you will make a real sniper entry. I asked the author if it would be possible to create a dashboard that analyzes all pairs, but I was told that the algorithm is already too complicated, too bad I would have liked it.

    Рекомендуем также
    Концепция спроса и предложения с возвратом к среднему значению Концепция торговли по спросу и предложению полагается на несовпадение объемов покупок и продаж на финансовых рынках. Для обычных трейдеров зоны спроса и предложения служат точками разворота. При рассмотрении первоначальной концепции было обнаружено, что первоначальная торговля по спросу и предложению может выполняться лучше на периоде возврата к среднему значению, а не на периоде тренда. Для демонстрации этой концепции, чтобы какая-л
    Технический индикатор рассчитывающий свои показания на объемах торгов. В виде гистограммы показывает накопление силы движения торгового инструмента. Имеет независимые системы расчета для бычьего и медвежьего направления. Работает на любых торговых инструментах и тайм-фреймах. Может дополнить любую торговую систему. Индикатор не перерисовывает своих значений, сигналы появляются на текущей свече. Прост в использовании и не загружает график, не  требует производить дополнительные расчеты параметр
    Индикатор Supply and Demand Zones - один из лучших инструментов, которые мы когда-либо создавали. Этот замечательный инструмент автоматически рисует зоны спроса и предложения - лучшие места для открытия и закрытия позиций. Он имеет множество дополнительных функций, таких как поддержка зон на нескольких таймфреймах, отображение ширины зон, уведомления об измененных зонах и многое другое. Благодаря фрактальности рынка, этот индикатор можно использовать для любого вида торговли. Не имеет значения,
    CadenceFX MT4
    Miss Supatcha Pigulkaw
    Key Features: Dual Indicator Strategy:   The EA utilizes Bollinger Bands and Stochastic Oscillator to identify reversal points, ensuring precise entry and exit signals for profitable trades. Trend Filtering System:   CadenceFX incorporates a trend filtering system to prevent trading in strong trend conditions, enhancing trading accuracy and reducing potential losses. Patience in Trading:   The EA waits for the market to retrace before entering trades, ensuring a strategic approach to trade exec
    Monster Harmonics - индикатор гармонических моделей (harmonic patterns). Он распознает следующие модели: Гартли (Gartley), Летучая мышь (Bat), Краб (Crab), Бабочка (Butterfly), Монограмма (Cypher), Черный лебедь (Black Swan), Белый лебедь (White Swan), Акула (Shark) и AB=CD. Незаконченные модели также распознаются. Monster даже показывает потенциальную зону разворота (Potential Reversal Zone, PRZ). Пользователи могут добавлять свои паттерны. Кроме текущей модели, Monster также показывает все мод
    Master scalping M1 -инновационный индикатор, использующий алгоритм для быстрого и точного определения тренда.Индикатор рассчитывает время открытия и закрытия позиций, алгоритмы индикатора позволяют находить идеальные моменты для входа в сделку (покупки или продажи актива), повышающие успешность сделок у большинства трейдеров. Преимущества индикатора: Прост в использовании, не перегружает график не нужной информацией. Возможность использования  как фильтр для любой стратегии. Работает на рынке
    Баланс спроса и предложения – простой и достаточно эффективный метод анализа рынка. Заблаговременно, ещё до разворота тренда, диаграмма спроса и предложения подскажет нам – где закончилось предложение и уже зарождается спрос, где закончился спрос и уже зарождается предложение – существенно увеличивая вероятность совершения сделки с высоким профит фактором и в правильном направлении. Сигналы индикатора По сочетанию значений цена/объём индикатор генерирует сигналы: ED (Excess demand) – избыточны
    To get access to MT5 version please click here . This is the exact conversion from TradingView: "[SHK] Schaff Trend Cycle (STC)" by "shayankm". This is a light-load processing indicator. This is a non-repaint indicator. Buffers are available for processing in EAs. All input fields are available. You can message in private chat for further changes you need. Thanks for downloading
    Профиль Рынка (Market Profile) определяет ряд типов дней, которые помогают трейдеру распознать поведение рынка. Ключевая особенность - это область значений (Value Area), представляющая диапазон ценового действия, в котором произошло 70% торговли. Понимание области значений может помочь трейдерам вникнуть в направление рынка и установить торговлю с более высокими шансами на успех. Это отличное дополнение к любой системе, которую вы возможно используете. Blahtech Limited представляет сообществу Me
    The Chaikin Oscillator is a technical indicator developed by Marc Chaikin that combines price and volume data to measure the accumulation and distribution of a financial instrument. It aims to identify potential buying and selling opportunities in the market. The Chaikin Oscillator is calculated by subtracting a 10-day exponential moving average of the Accumulation Distribution Line (ADL) from a 3-day exponential moving average of the ADL. Here's how to use the Chaikin Oscillator indicator in tr
    Если вы хотите добавить индикатор паттернов для подтверждения рыночного движения, вы обратились по адресу. Этот индикатор позволяет обнаружить некоторые известные свечные паттерны: Hammer, Inverted Hammer, Shooting Star, Hanging Man и Engulfing. Они отображаются на вашем графике по мере возникновения. Стрелки вверх и вниз отрисовываются в начале нового бара каждый раз, когда обнаружен паттерн. Параметры Body to Bar Fraction (%) : Размер тела свечи по отношению к размеру свечи (по умолчанию 20%
    Индикатор Volume Volatility анализирует валютные пары, индексы, товары и т.д. в условиях крайне высокого и крайне низкого соотношения накопления к распределению по сравнению с прошлыми значениями. Самый главный параметр – Volume_Volatility_Factor . Грубо говоря, он определяет, насколько далекое прошлое будет анализироваться. Чем ниже значение параметра, тем меньше данных из прошлого анализирует индикатор. Рекомендую установить и протестировать значения 3, 5, 15, 35 и 48 на разных таймфреймах и в
    A tall upper shadow occurs when the price moves during the period, but goes back down, which is a bearish signal. A tall lower shadow forms when bears push the price down, but bulls pull it back up, which leaves a long line or shadow. This is considered a bullish signal. Some technical analysts believe a tall or long shadow means the stock will turn or reverse. Some believe a short or lower shadow means a price rise is coming. In other words, a tall upper shadow means a downturn is coming, whil
    VR Cub
    Vladimir Pastushak
    VR Cub это индикатор что бы получать качественные точки входа. Индикатор разрабатывался с целью облегчить математические расчеты и упростить поиск точек входа в позицию. Торговая стратегия, для которой писался индикатор, уже много лет доказывает свою эффективность. Простота торговой стратегии является ее большим преимуществом, что позволяет успешно торговать по ней даже начинающим трейдерам. VR Cub рассчитывает точки открытия позиций и целевые уровни Take Profit и Stop Loss, что значительно повы
    Volume Profile Indicator for MT4 Gain a trading edge with the "Volume Profile" indicator for MetaTrader 4 (MT4). This advanced technical analysis tool allows you to precisely identify key support and resistance levels based on transaction volume. Easily visualize market areas of high interest, where trading volumes are highest, and use this information to make more informed trading decisions. Key Features: Clear and detailed visualization : The indicator displays volume histograms directly on th
    Matrix - стрелочный индикатор Форекс. Отображает сигналы просто и наглядно! Стрелки показывают направление заключения сделки, и окрашиваются соответственно что видно на скриншотах. Как видите торговать с таким индикатором легко. Дождался появления стрелки в нужном направлении – открыл сделку. Сформировалась стрелка в обратную сторону – закрыл сделку. Также индикатор отображает линии с помощью которых формируются сигналы стрелок, с учетом внутренних вильтров.
    The indicator allows you to trade binary options. The recommended time frame is М1 and the expiration time is 1,2,3 minutes. The indicator suitable for auto and manual trading. A possible signal is specified as a arrows above/under a candle. You should wait until the candle closes! Arrows are not re-painted Trade sessions: TOKYO section (Half-end) Currency pairs: USD/JPY Working time frame: M1 Expiration time: 1,2,3 minutes. The indicator also shows good results when using the martingale strateg
    FREE
    The Volume by Price Indicator for MetaTrader 4 features Volume Profile and Market Profile TPO (Time Price Opportunity). Volume and TPO histogram bar and line charts. Volume Footprint charts. TPO letter and block marker collapsed and split structure charts. Session filtering and grouping. Static, dynamic and flexible range segmentation and compositing methods with relative and absolute visualizations. Graphical layering, positioning and styling options to suit the user's analytic and aesthetic n
    Представленный индикатор является развитием идей заложенных в индикаторе  Bulls or Bears AM . Данный индикатор отображает разность максимальной и минимальной цен за текущий период времени и значений канала, построенного по максимальным и минимальным ценам за больший период. Рост значений индикатора выше нуля говорит о том, что максимальная цена за текущий период больше среднего значения максимальных цен за период, выбранный в качестве параметра индикатора. Такая ситуация в большинстве случаев го
    FREE
    Индикатор RTrends делает две вещи: во-первых, производит автоматическую (на лету) разметку графика цены путем нанесения линий трендов и, во-вторых, дает медвежьи и бычьи сигналы. Разметка отражает фрактальную природу рынка. На график одновременно наносятся тренды с разных временных горизонтов. Таким образом, трейдер, имея перед глазами только один график, может видеть линии трендов со старших таймфреймов. Линии, в зависимости от горизонта, различаются по цвету и толщине: чем старше горизонт, тем
    TWO PAIRS SQUARE HEDGE METER INDICATOR Try this brilliant 2 pairs square indicator It draws a square wave of the relation between your two inputs symbols when square wave indicates -1 then it is very great opportunity to SELL pair1 and BUY Pair2 when square wave indicates +1 then it is very great opportunity to BUY pair1 and SELL Pair2 the inputs are : 2 pairs of symbols         then index value : i use 20 for M30 charts ( you can try other values : 40/50 for M15 , : 30 for M30 , : 10 for H1 ,
    Инструмент для торговли скальпингом с использованием профиля рынка. Позволяет торговать по рынку, а так же оттачивать навыки торговли в тестере стратегий. При минимальном интерфейсе имеет высокую функциональность и пользу для торговли от уровня Point Of Control (POC). Как торговать с помощью советника - утилиты Market profile scalper, смотрите видео. Настройки - - - - - - Market profile - - - - - - Color rectangle range 1 - цвет прямоугольника 1 диапазона свечей Color rectangle range 2 - цвет пр
    First of all, it is worth highlighting here that this Trading Indicator is Non Repainting, Non Redrawing and Non Lagging, which makes it ideal for manual trading. Never repaint and recalculate Once an arrow appears it never disappears, the signal comes at the opening of the new candle You will now be more profitable with this indicator The indicator will alert you when an arrow appears You can do swing trading or scalping trading The indicator helps you identify the trend Can be optimized acros
    Индикатор строит текущие котировки, которые можно сравнить с историческими и на этом основании сделать прогноз ценового движения. Индикатор имеет текстовое поле для быстрой навигации к нужной дате. Параметры : Symbol - выбор символа, который будет отображать индикатор; SymbolPeriod - выбор периода, с которого индикатор будет брать данные; IndicatorColor - цвет индикатора; Inverse - true переворачивает котировки, false - исходный вид; Далее идут настройки текстового поля, в которое можн
    WaveMaster Pro : Advanced Market Analysis Indicator for MetaTrader 4 Overview WaveMaster Pro is an advanced MetaTrader 4 (MT4) indicator engineered to enhance trading strategies by offering a sophisticated analysis of market trends and price movements. By integrating sector analysis, micro wave detection, and price projection capabilities, WaveMaster Pro provides traders with actionable insights for better decision-making. Whether you are a novice trader or a seasoned professional, this tool is
    KT Renko Patterns MT4
    KEENBASE SOFTWARE SOLUTIONS
    2.33 (3)
    KT Renko Patterns scans the Renko chart brick by brick to find some famous chart patterns that are frequently used by traders across the various financial markets. Compared to the time-based charts, patterns based trading is easier and more evident on Renko charts due to their uncluttered appearance. KT Renko Patterns features multiple Renko patterns, and many of these patterns are extensively explained in the book titled Profitable Trading with Renko Charts by Prashant Shah. A 100% automate
    Старый, добрый "AP" в версии трендового осциллятора. Это простой индикатор, который использует максимум возможностей языка MQL4. Но при этом он работает достаточно быстро даже на процессорах 1 Гигагерц и менее. При анализе следует обращать внимание на пересечение уровня 50, если вы намеренны использовать его как трендовый индикатор. Индикатор не перерисовывает, и работает на всех типах графиков и таймфреймах. Сделаны основные возможности оповещения, оповещения работают в обоих направлениях
    Introduction It is common practice for professional trades to hide their stop loss / take profit from their brokers. Either from keeping their strategy to the themselves or from the fear that their broker works against them. Using this indicator, the stop loss / take profit points will be drawn on the product chart using the bid price. So, you can see exactly when the price is hit and close it manually.  Usage Once attached to the chart, the indicator scans the open orders to attach lines fo
    Descption: The Volume Profile displays detailed informations of historical trading activities at certain price levels (Market Profile). So you can locate the areas with the best prices in the market and get an advantage about other market participants. Features: Customizable Volume Profile / Market Profile Shows the "fair" Value Area with 70% of all Volume Shows critical low volume zones Shows VPOC, VAL and VAH Points Works on all timeframes Also available for MT5 ( https://www.mql5.com/en/m
    This indicator displays the histogram and arrows on chart. When Simple The Best Pro are placed on a chart, they identify the trend.  The color of may be blue or red. The blue color stands for upside moves and the red color stands for downside trends. The indicator offers to set Stop Loss (SL) and  Take Profit (TP)  setting. The default value is ATR. Indicator has automatic optimization. The STB is a unique indicator that shows the tendency (button Bars) of a particular signals. The STB tells us
    С этим продуктом покупают
    Инновационный индикатор, использующий эксклюзивный алгоритм для быстрого и точного определения тренда. Индикатор автоматически рассчитывает время открытия и закрытия позиций, а также подробную статистику работы индикатора на заданном отрезке истории, что позволяет выбрать наилучший торговый инструмент для торговли. Вы также можете подключить свои пользовательские стрелочные индикаторы к Scalper Inside Pro для проверки и расчета их статистики и прибыльности. Scalper Inside PRO инструкция и настро
    В настоящее время скидка 20%! Лучшее решение для новичка или трейдера-эксперта! Эта приборная панель работает на 28 валютных парах. Он основан на 2 наших основных индикаторах (Advanced Currency Strength 28 и Advanced Currency Impulse). Он дает отличный обзор всего рынка Forex. Он показывает значения Advanced Currency Strength, скорость движения валюты и сигналы для 28 пар Forex на всех (9) таймфреймах. Представьте, как улучшится ваша торговля, когда вы сможете наблюдать за всем рынком с пом
    Reversal First Impulse levels (RFI)        INSTRUCTIONS     RUS    -      ENG           Рекомендуем использовать с  индикатором -  TPSpro  TREND PRO -  Version MT5 Важным ключевым элементом в трейдинге являются зоны или уровни, от которых принимаются решения о покупке или продаже торгового инструмента. Несмотря на попытки крупных игроков скрыть свое присутствие на рынке, они неизбежно оставляют следы. Наша задача заключалась в том, чтобы научиться находить эти следы и правильно их интерпретирова
    The AT Forex Indicator MT4 is a sophisticated trading tool designed to provide traders with a comprehensive analysis of multiple currency pairs. This   powerful indicator   simplifies the complex nature of the forex market, making it accessible for both novice and experienced traders. AT Forex Indicator uses   advanced algorithms   to detect trends, patterns and is an essential tool for traders aiming to enhance their forex trading performance. With its robust features, ease of use, and reliabl
    TPSproTREND PrO
    Roman Podpora
    4.78 (18)
    TPSpro TRENDPRO   —  трендовый индикатор, который автоматически анализирует рынок и предоставляет информацию о тренде и каждой его смене а также дающий сигналы для входа в сделки без перерисовки! Индикатор использует каждую свечу, анализируя их отдельно. относя к разным импульсам – импульс вверх или вниз. Точные точки входа в сделки  для  валют, крипты, металлов, акций, индексов! -  Version MT5             ПОЛНОЕ ОПИСАНИЕ ИНДИКАТОРА           Рекомендуем использовать с  индикатором -  RFI LEVE
    Indicator : RealValueIndicator Description : RealValueIndicator is a powerful tool designed specifically for trading on the EURUSD pair. This indicator analyzes all EUR and USD pairs, calculates their real currency strength values, and displays them as a single realistic value to give you a head start on price. This indicator will tell you moves before they happen if you use it right. RealValueIndicator allows you to get a quick and accurate overview of the EURUSD currency pair tops and bottoms,
    Представляем       Индикатор Quantum Trend Sniper   , инновационный индикатор MQL5, который меняет способ определения разворотов тренда и торговли ими! Разработан командой опытных трейдеров со стажем торговли более 13 лет,       Снайперский индикатор Quantum Trend       разработан, чтобы вывести ваше торговое путешествие на новые высоты благодаря инновационному способу определения разворотов тренда с чрезвычайно высокой точностью. ***Купите индикатор Quantum Trend Sniper и получите индикатор
    TrendMaestro
    Stefano Frisetti
    5 (3)
    note: this indicator is for METATRADER4, if you want the version for METATRADER5 this is the link:  https://www.mql5.com/it/market/product/108106 TRENDMAESTRO ver 2.4 TRENDMAESTRO recognizes a new TREND in the bud, he never makes mistakes. The certainty of identifying a new TREND is priceless. DESCRIPTION TRENDMAESTRO identifies a new TREND in the bud, this indicator examines the volatility, volumes and momentum to identify the moment in which there is an explosion of one or more of these data a
    Прежде всего стоит подчеркнуть, что этот торговый индикатор не перерисовывается, не перерисовывает и не отставает, что делает его идеальным как для ручной, так и для роботизированной торговли. Руководство пользователя: настройки, вводы и стратегия. Атомный аналитик - это индикатор ценового действия PA, который использует силу и импульс цены, чтобы найти лучший край на рынке. Оборудованный расширенными фильтрами, которые помогают убирать шумы и ложные сигналы, и повышают торговый потенциал. Испо
    Представляем       Quantum Breakout PRO   , новаторский индикатор MQL5, который меняет ваш способ торговли в зонах прорыва! Разработанная командой опытных трейдеров с опытом торговли более 13 лет,   Quantum Breakout PRO   предназначена для того, чтобы вывести ваше торговое путешествие на новые высоты благодаря своей инновационной и динамичной стратегии зон прорыва. Quantum Breakout Indicator покажет вам сигнальные стрелки на зонах прорыва с 5 целевыми зонами прибыли и предложением стоп-лос
    NAM Order Blocks
    NAM TECH GROUP, CORP.
    5 (1)
    Индикатор обнаружения блоков ордеров мультитаймфреймов MT4. Функции - Полностью настраиваемая панель управления графиком, обеспечивает полное взаимодействие. - Скрыть и показать панель управления где угодно. - Обнаружение OB на нескольких таймфреймах. - Выберите количество OB для отображения. - Различные пользовательские интерфейсы OB. - Различные фильтры по OB. - Оповещение о близости OB. - Линии ADR High и Low. - Служба уведомлений (Экранные оповещения | Push-уведомления).
    FX Volume
    Daniel Stein
    4.61 (36)
    Получайте ежедневную информацию о рынке с подробностями и скриншотами в нашем утреннем брифинге здесь, на mql5 , и в Telegram ! FX Volume - это ПЕРВЫЙ и ЕДИНСТВЕННЫЙ индикатор объема, который дает РЕАЛЬНОЕ представление о настроении рынка с точки зрения брокера. Он дает потрясающее представление о том, как институциональные участники рынка, такие как брокеры, позиционируют себя на рынке Forex, гораздо быстрее, чем отчеты COT. Видеть эту информацию прямо на своем графике - это настоящий геймчей
    Enigmera
    Ivan Stefanov
    5 (4)
    ЭНИГМЕРА: ядро рынка https://www.enigmera.com Введение Этот индикатор и торговая система представляют собой удивительный подход к финансовым рынкам. ENIGMERA использует фрактальные циклы для точного расчета уровней поддержки и сопротивления. Он показывает подлинную фазу накопления и дает направление и цели.  Система, которая работает независимо от того, находимся ли мы в тренде или в коррекции.  Как она работает? ENIGMERA состоит из трех линий: линии поддержки/сопротивления, линии цели и ли
    Cycle Sniper
    Elmira Memish
    4.41 (37)
    NEW YEAR SALE PRICE FOR LIMITED TIME!!! Please contact us after your purchase and we will send you the complimentary indicators to complete the system Cycle Sniper is not a holy grail but when you use it in a system which is explained in the videos, you will feel the difference. If you are not willing to focus on the charts designed with Cycle Sniper and other free tools we provide, we recommend not buying this indicator. We recommend watching the videos about the indiactor and system before pu
    Индикатор All-in-One Trade (AOTI) определяет дневные цели для пар EURUSD, EURJPY, GBPUSD, USDCHF, EURGBP, EURCAD, EURAUD, AUDJPY, GBPAUD, GBPCAD, GBPCHF, GBPJPY, AUDUSD и USDJPY. Все остальные модули работают на любых финансовых инструментах. Индикатор включает в себя множество функций: двойной канал для определения тренда, ценовой канал, полосы МА, построение уровней Фибо, определение точки кульминации и др. Индикатор создан для упрощения анализа рынка и основан на нескольких торговых стратегия
    Топовый индикатор МТ4, дающий сигналы для входа в сделки без перерисовки! Идеальные точки входа в сделки   для  валют, крипты, металлов, акций, индексов !  Смотрите  видео  (6:22) с примером отработки всего одного сигнала, окупившего индикатор. Версия индикатора для MT5 Преимущества индикатора Сигналы на вход без перерисовки Если сигнал появился, он никуда НЕ исчезает! В отличие от индикаторов с перерисовкой, которые ведут к потере депозита, потому что могут показать сигнал, а потом убрать его.
    Прецизионный индикатор осциллятора (Pi-Osc) от Роджера Медкалфа из Precision Trading Systems Версия 2 была тщательно перекодирована для быстрой загрузки на вашем графике, а также внесены некоторые другие технические улучшения для улучшения опыта. Pi-Osc был создан для предоставления точных сигналов времени для совершения сделок, предназначенных для поиска экстремальных точек истощения - точек, к которым рынок вынужден идти, чтобы сработать стоп-заказы всех остальных. Этот продукт решает вековую
    Welcome to the world of SMC (Smart Money Concepts) Trading, where we empower traders with the tools and knowledge to make smarter trading decisions. Our latest addition to our suite of trading tools is the SMC Trading Pro indicator, version 1.0. Key Features: Major Market Structure Identification with BODY break. Order Block must be in Major Swing ( not Small Swing ). Order Block with Fair Value Gap Detection. Order Block in Discount | Premium zone. Filter for only Bullish, Bearish or All Order
    ZeusArrow Smart Liquidity Finder  Smart Liquidity Finder is Ai controlled indicator based on the Idea of Your SL is My Entry. It scan and draws the major Liquidity areas on chart partitioning them with Premium and Discount Zone and allows you find the best possible trading setups and help you decide the perfect entry price to avoid getting your Stop Loss hunted . Now no more confusion about when to enter and where to enter. Benefit from this one of it's kind trading tool powered by Ai an trade
    А. Что такое A2SR?   * Это опережающий технический индикатор (без перерисовки, без запаздывания) . -- Учебники : -- на https://www.mql5.com/ru/blogs/post/734748/page4#comment_16532516   -- и https://www.mql5.com/ru/users/yohana/blog A2SR имеет особую технику определения уровней Поддержки (спроса) и Сопротивления (предложения). В отличие от обычного способа, который мы видели в сети, A2SR имеет оригинальную концепцию определения фактических уровней SR. Оригинальная техника не была взята из Инт
    Ищете мощный индикатор для торговли на рынке Форекс, который поможет вам с легкостью определить прибыльные торговые возможности? Не ищите ничего, кроме Beast Super Signal. Этот простой в использовании индикатор, основанный на тренде, постоянно отслеживает рыночные условия, ищет новые развивающиеся тренды или отслеживает уже существующие. Beast Super Signal дает сигнал на покупку или продажу, когда все внутренние стратегии совпадают и на 100% совпадают друг с другом, что устраняет необходимость в
    GOLD Impulse with Alert
    Bernhard Schweigert
    4.56 (9)
    Этот индикатор является супер комбинацией двух наших продуктов Advanced Currency IMPULSE with ALERT  +   Currency Strength Exotics . Он работает на всех временных рамках и графически показывает импульс силы или слабости для 8 основных валют плюс один символ! Этот индикатор специализирован для отображения ускорения силы валюты для любых символов, таких как золото, экзотические пары, товары, индексы или фьючерсы. Первый в своем роде, любой символ может быть добавлен в 9-ю строку, чтобы пока
    FxBears Powers работает со всеми валютными парами, металлами, товарами, фьючерсами, индексами, энергоносителями, криптовалютой и всем ... и на всех таймфреймах от M1 до MN. Он основан на спросе и предложении и некоторых внутренних индикаторах, он дает вам очень сильную точку входа с нулевым проскальзыванием большую часть времени, вы можете проверить это в тесте. Он мгновенно отправляет вам сигналы на платформу вашего телефона, где бы вы ни находились, он содержит название пары, время, таймф
    В НАСТОЯЩЕЕ ВРЕМЯ СКИДКА 20%! Лучшее решение для новичка или трейдера-эксперта! Этот индикатор специализирован для отображения силы валюты для любых символов, таких как экзотические пары, товары, индексы или фьючерсы. Впервые в своем роде, любой символ может быть добавлен в 9-ю строку, чтобы показать истинную силу валюты золота, серебра, нефти, DAX, US30, MXN, TRY, CNH и т.д. Это уникальный, высококачественный и доступный торговый инструмент, потому что мы включили в него ряд собственных функци
    Представляем индикатор астрономии для MT4: Ваш незаменимый небесный товарищ в торговле Готовы ли вы поднять свой опыт торговли до небесных высот? Не ищите дальше, чем наш революционный индикатор астрономии для MT4. Этот инновационный инструмент выходит за рамки традиционных торговых индикаторов, используя сложные алгоритмы для предоставления вам беспрецедентных астрономических понимания и точных расчетов. Вселенская информация под рукой: Взгляните на обширную панель, раскрывающую сокровищницу ас
    REMINDER: Early buyers hot price discount: Price subject to rise after first 20 copies. Starting price $65 and final price will be $1275. Secure your discounted copy Now! Smart Money Analyser Indicator User Manual 1. Introduction Welcome to the   Smart Money Analyser Indicator This powerful tool provides traders with comprehensive market analysis by combining various technical indicators to generate actionable trading signals. Designed to be user-friendly, this indicator helps traders of a
    Gold Channel is a volatility-based indicator, developed with a specific timing algorithm for the XAUUSD pair, which consists of finding possible corrections in the market. This indicator shows two outer lines, an inner line (retracement line) and an arrow sign, where the theory of the channel is to help identify overbought and oversold conditions in the market. The market price will generally fall between the boundaries of the channel. If prices touch or move outside the channel it is a tra
    System Trend Pro - Это лучший индикатор торговли по тренду!!! Индикатор не перерисовывается и не изменяет свои данные! В индикаторе есть   MTF   режим, что добавляет нам уверенности торговли по тренду(сигналы тоже не перерисовываются) Как торговать? Всё очень просто, ждём первый сигнал ( большая стрелка), потом дожидаемся второго сигнала ( маленькая стрелка) и входим в рынок по направлению стрелки. (См. скрин 1 и 2.) Выход по обратному сигналу или взять 20-30  пунктов, половина закрыть, а ос
    Please send me Direct message on MQL5 CHAT after purchasing the Indicator for Training and Installation Support There are some additional files that is important to use with the Indicator . So be sure to contact me after purchasing the Indicator So that I can add you for training and support . If you find any difficulty with installation then send me Direct message here So that I can connect with you via Anydesk or Teamview for the product installation. " Smart Order Block Indicator " to find
    Индикатор " ZigZag on Trend " представляет из себя помощника в определении направления движения цены, а так же калькулятора баров и пунктов. Состоит из трендового индикатора, следящей за направлением цены трендовой линией представленной в виде зигзага и счетчика вычисляющего число баров пройденных в направлении тренда и количество пунктов по вертикальной шкале.(расчеты ведутся по открытию бара) Индикатор не перерисовывается. Для удобства исполнен в виде окрашенных баров или в виде линий. Можно и
    Другие продукты этого автора
    Концепция спроса и предложения с возвратом к среднему значению Концепция торговли по спросу и предложению полагается на несовпадение объемов покупок и продаж на финансовых рынках. Для обычных трейдеров зоны спроса и предложения служат точками разворота. При рассмотрении первоначальной концепции было обнаружено, что первоначальная торговля по спросу и предложению может выполняться лучше на периоде возврата к среднему значению, а не на периоде тренда. Для демонстрации этой концепции, чтобы какая-л
    Introduction to Fractal Pattern Scanner Fractal Indicator refers to the technical indicator that makes use of the fractal geometry found in the financial market. Fractal Pattern Scanner is the advanced Fractal Indicator that brings the latest trading technology after the extensive research and development work in the fractal geometry in the financial market. The most important feature in Fractal Pattern Scanner is the ability to measure the turning point probability as well as the trend probabi
    Способ применения Pair Trading Station Рекомендуется использовать Pair Trading Station на таймфрейме H1 с любой валютной парой. Чтобы получить сигналы на покупку и продажу, следуйте указанным ниже инструкциям по применению Pair Trading Station в терминале MetaTrader. При загрузке Pair Trading Station на график индикатор оценит доступные исторические данные на вашей платформе MetaTrader для каждой валютной пары. В самой начале на графике отобразятся исторические данные, доступные для каждой валют
    Introduction to X3 Chart Pattern Scanner X3 Cherart Pattern Scanner is the non-repainting and non-lagging indicator detecting X3 chart patterns including Harmonic pattern, Elliott Wave pattern, X3 patterns, and Japanese Candlestick patterns. Historical patterns match with signal patterns. Hence, you can readily develop the solid trading strategy in your chart. More importantly, this superb pattern scanner can detect the optimal pattern of its kind. In addition, you can switch on and off individu
    Excessive Momentum Indicator – один из немногих индикаторов, измеряющий чрезмерный импульс на финансовом рынке с использованием ценового поведения. Индикатор полностью разработан Янгом Хо Сео (Young Ho Seo). Этот показатель демонстрирует концепцию и практическое применение Равновесной фрактальной волны (Equilibrium Fractal Wave). Чрезмерный импульс на рынке может рассказать о психологии толпы и помочь спрогнозировать направление цены. Таким образом, вы можете основывать свои торговые решения на
    Introduction to Fibonacci Volatility Indicator Volatility indicator can help you to detect any statistical advantage for your trading. Especially, if you are trading with Price Action and Price Patterns, then we recommend to use the Volatility indicator together with your strategy. Especically, Fibonacci Volatility indicator combines the market volatiltiy with Fibonacci Analysis to provide you more advanced volatiltiy indicator. Main Features Fibonacci Volatility in Z score Configuration Mode Fi
    Peak Trough Analysis - отличный инструмент для обнаружения пиков и впадин на графике. Peak Trough Analysis может использовать три разных алгоритма обнаружения пиков и впадин. Эти три алгоритма включают в себя оригинальный индикатор Fractals Билла Вильямса, модифицированный индикатор Fractals и индикатор ZigZag. Вы можете использовать этот инструмент анализа пиков и впадин для обнаружения паттернов, составленных Равновесным Фрактально-Волновым процессом. Для дальнейшего использования имеется хоро
    FREE
    Introduction This indicator detects volume spread patterns for buy and sell opportunity. The patterns include demand and supply patterns. You might use each pattern for trading. However, these patterns are best used to detect the demand zone (=accumulation area) and supply zone (=distribution area). Demand pattern indicates generally potential buying opportunity. Supply pattern indicates generally potential selling opportunity. These are the underlying patterns rather than direct price action. T
    FREE
    Введение в Harmonic Pattern Plus Индикатор Harmonic Pattern Plus, предназначенный для работы в MetaTrader 4, ищет гармонические модели на графике. Программа Harmonic Pattern Plus предназначена для определения точек разворота текущего тренда - она находит гармонические модели с высокой силой прогнозирования. Гармонические модели состоят из нескольких линий, объединенных важными соотношениями Фибоначчи, такими как 0,618 и 0,382, которые часто используются профессиональными трейдерами для измерения
    Индикатор Elliott Wave Trend был разработан для научного подсчета волн на основе шаблонов и паттернов, впервые разработанных Чжон Хо Сео. Индикатор нацелен на максимальное устранение нечеткости классического подсчета волн Эллиотта с использованием шаблонов и паттернов. Таким образом индикатор Elliott Wave Trend в первую очередь предоставляет шаблон для подсчета волн. Во-вторых, он предлагает структурный подсчет волн Wave Structural Score, которые помогает определить точное формирование волны. Он
    Introduction To Time Box Indicator Time Box Indicator is a must have indicator for any trader. It will display daily, weekly and Monthly box according to your preferences. Yet, you can extend any important price levels in your chart automatically. You can use them as the significant support and resistance levels. It is very simple but effective tool for your trading. Graphic Setting Use White Chart Line Style for Current Open price Daily Setting Update Timeframe for daily box Number of days
    FREE
    Peak Trough Analysis - отличный инструмент для обнаружения пиков и впадин на графике. Peak Trough Analysis может использовать три разных алгоритма обнаружения пиков и впадин. Эти три алгоритма включают в себя оригинальный индикатор Fractals Билла Вильямса, модифицированный индикатор Fractals и индикатор ZigZag. Вы можете использовать этот инструмент анализа пиков и впадин для обнаружения паттернов, составленных Равновесным Фрактально-Волновым процессом. Для дальнейшего использования имеется хоро
    FREE
    Introduction to Fractal Moving Average Fractal Moving Average indicator was designed as part of Fractal Pattern Scanner. Inside Fractal Pattern Scanner, Fractal Moving Average Indicator was implemented as multiple of chart objects. With over thousands of chart object, we find that it was not the best and efficient ways to operate the indicator. It was computationally too heavy for the indicator. Hence, we decide to implement the indicator version of Fractal Moving Average indicator to benefit ou
    FREE
    Introduction Auto Chart Alert is a convenient tool to set alert for your trading in your chart. With Auto Chart Alert, you can set the alert line in one click in your desired location in your chart. You can even set alert over the sloped lines in your chart. Auto Chart Alert is a great tool when you have to watch out importnat support and resistance levels for your trading. You can receive the sound alert, email and push notification when the price hit the alert line at you desired location. A
    FREE
    Introduction This indicator detects volume spread patterns for buy and sell opportunity. The patterns include demand and supply patterns. You might use each pattern for trading. However, these patterns are best used to detect the demand zone (=accumulation area) and supply zone (=distribution area). Demand pattern indicates generally potential buying opportunity. Supply pattern indicates generally potential selling opportunity. These are the underlying patterns rather than direct price action. T
    FREE
    Введение Период низкой волатильности и нетрендового движения на финансовом рынке считается периодом бокового рынка (Sideways Market). Рано или поздно волатильность начинает расти и рынок переходит в трендовую фазу. Период бокового рынка (флет) может служить хорошим временем входа в рынок. Кроме того, боковой рынок часто означает накопление на рынке объемных ордеров крупных инвесторов. Информация о господстве на рынке флета может помочь вам определить хорошие моменты для входа в рынок и выхода из
    Период низкой волатильности и нетрендового движения на финансовом рынке считается периодом бокового рынка (Sideways Market). Рано или поздно волатильность начинает расти и рынок переходит в трендовую фазу. Период бокового рынка (флет) может служить хорошим временем входа в рынок. Кроме того, боковой рынок часто означает накопление на рынке объемных ордеров крупных инвесторов. Информация о господстве на рынке флета может помочь вам определить хорошие моменты для входа в рынок и выхода из него. Тр
    Ace Supply Demand Zone Indicator The concept of supply demand relies on the quantity mismatching between buying and selling volumes in the financial market. Supply and demand zone can provide the good entry and exit. A zone is easier to trade than a line. The supply demand zone can provide the detailed trading plan and the risk management. Its ability to predict market direction is high. There are two distinctive points about Ace Supply Demand Zone Indicator. Ace Supply Demand Zone indicator was
    Introduction This indicator detects volume spread patterns for buy and sell opportunity. The patterns include demand and supply patterns. You might use each pattern for trading. However, these patterns are best used to detect the demand zone (=accumulation area) and supply zone (=distribution area). Demand pattern indicates generally potential buying opportunity. Supply pattern indicates generally potential selling opportunity. These are the underlying patterns rather than direct price action. T
    Introduction to Fractal Moving Average Fractal Moving Average indicator was designed as part of Fractal Pattern Scanner. Inside Fractal Pattern Scanner, Fractal Moving Average Indicator was implemented as multiple of chart objects. With over thousands of chart object, we find that it was not the best and efficient ways to operate the indicator. It was computationally too heavy for the indicator. Hence, we decide to implement the indicator version of Fractal Moving Average indicator to benefit
    FREE
    Introduction to Fractal Pattern Scanner Fractal Indicator refers to the technical indicator that makes use of the fractal geometry found in the financial market. Fractal Pattern Scanner is the advanced Fractal Indicator that brings the latest trading technology after the extensive research and development work in the fractal geometry in the financial market. The most important feature in Fractal Pattern Scanner is the ability to measure the turning point probability as well as the trend probabil
    Об эксперте Order Risk Management Эксперт ORM разработан специально для быстрого и точного исполнения ордеров. Он предназначен для использования с нашими перечисленными ниже стратегиями Ценового действия и Эконометрической торговли. Эксперт ORM полностью автоматизирован и прост в применении. Эксперт ORM абсолютно бесплатный. Такой способ исполнения ордеров экспертом ORM подходит для любой иной торговой стратегии. Harmonic Pattern Plus MT5 Harmonic Pattern Scenario Planner MT5 Price breakout Patt
    FREE
    Introduction To Time Box Indicator Time Box Indicator is a must have indicator for any trader. It will display daily, weekly and Monthly box according to your preferences. Yet, you can extend any important price levels in your chart automatically. You can use them as the significant support and resistance levels. It is very simple but effective tool for your trading. Graphic Setting Use White Chart Line Style for Current Open price Daily Setting Update Timeframe for daily box Number of days
    FREE
    Introduction Auto Chart Alert is a convenient tool to set alert for your trading in your chart. With Auto Chart Alert, you can set the alert line in one click in your desired location in your chart. You can even set alert over the sloped lines in your chart. Auto Chart Alert is a great tool when you have to watch out importnat support and resistance levels for your trading. You can receive the sound alert, email and push notification when the price hit the alert line at you desired location. A
    FREE
    Введение в алгоритм GARCH Improved Nelder Mead GARCH - это сокращение от Generalized Autoregressive Conditional Heteroskedasticity (Обобщенная авторегрессионная условная гетероскедастичность). Представляет собой модель прогнозирования волатильности, обычно применяемую в финансовой сфере. Модель GARCH впервые появилась в работе датского экономиста Тима Петера Боллерслева (Tim Peter Bollerslev) в 1986 году. Лауреат Нобелевской премии 2003 года Роберт Ф. Энгл внес огромный вклад в усовершенствовани
    FREE
    Индикатор Elliott Wave Trend был разработан для научного подсчета волн на основе шаблонов и паттернов, впервые разработанных Чжон Хо Сео. Индикатор нацелен на максимальное устранение нечеткости классического подсчета волн Эллиотта с использованием шаблонов и паттернов. Таким образом индикатор Elliott Wave Trend в первую очередь предоставляет шаблон для подсчета волн. Во-вторых, он предлагает структурный подсчет волн Wave Structural Score, которые помогает определить точное формирование волны. Он
    Introduction to X3 Chart Pattern Scanner X3 Cherart Pattern Scanner is the non-repainting and non-lagging indicator detecting X3 chart patterns including Harmonic pattern, Elliott Wave pattern, X3 patterns, and Japanese Candlestick patterns. Historical patterns match with signal patterns. Hence, you can readily develop the solid trading strategy in your chart. More importantly, this superb pattern scanner can detect the optimal pattern of its kind. In addition, you can switch on and off individu
    Введение в алгоритм GARCH Improved Nelder Mead GARCH - это сокращение от Generalized Autoregressive Conditional Heteroskedasticity (Обобщенная авторегрессионная условная гетероскедастичность). Представляет собой модель прогнозирования волатильности, обычно применяемую в финансовой сфере. Модель GARCH впервые появилась в работе датского экономиста Тима Петера Боллерслева (Tim Peter Bollerslev) в 1986 году. Лауреат Нобелевской премии 2003 года Роберт Ф. Энгл внес огромный вклад в усовершенствовани
    FREE
    Price Breakout pattern Scanner - это полностью автоматический и мощный анализ для трейдеров и инвесторов. Он определяет следующие паттерны на графике. Голова и Плечи - Распространенный паттерн для торговли. Обратная Голова и Плечи - эта модель обратна паттерну Голова и плечи. Двойная вершина - когда цена дважды достигает уровня сопротивления и снизится к уровню поддержки, трейдер может ожидать внезапный медвежий прорыв уровня поддержки. Двойное дно - двойное дно является противоположностью формы
    Об эксперте Order Risk Management Эксперт ORM разработан специально для быстрого и точного исполнения ордеров. Он предназначен для использования с нашими перечисленными ниже стратегиями Ценового действия и Эконометрической торговли. Эксперт ORM полностью автоматизирован и прост в применении. Эксперт ORM абсолютно бесплатный. Такой способ исполнения ордеров экспертом ORM подходит для любой иной торговой стратегии. Harmonic Pattern Plus MT4 Harmonic Pattern Scenario Planner MT4 Price breakout Patt
    FREE
    Фильтр:
    Shaakgomo Johannes Shai
    165
    Shaakgomo Johannes Shai 2023.05.18 10:47 
     

    i rented this indicator is not selfudate all the time and it will refresh after you have selfrefresh the chart. It supposed to refresh its self after the zone has been hit. Please check the bug on the indicator.

    Young Ho Seo
    85795
    Ответ разработчика Young Ho Seo 2023.05.18 13:26
    Please do not use the indicator with template or any presetting. Template can mess up the functionality of the real time indicator. Simply attach the indicator manually to the fresh chart.
    lauro1956
    4476
    lauro1956 2022.08.24 09:56 
     

    The cleanliness and clarity that this indicator provides is greatly appreciated, unlike others that fill your screen without offering any solutions.... The best supply and demand indicator... 5 stars

    gumie74
    25
    gumie74 2021.06.07 12:29 
     

    hi Ace Supply Demand Zone MT4 Indicator has been rented for a month and not work :C

    Young Ho Seo
    85795
    Ответ разработчика Young Ho Seo 2021.06.07 12:58
    Follow instruction steps here. https://algotrading-investment.com/install-mt4mt5-products-purchased-mql5-com/ If you have any further problem regards to your license, then contact service desk on mql5.com
    turky7713
    466
    turky7713 2021.05.13 00:55 
     

    hi Ace Supply Demand Zone MT4 Indicator has been rented for a month

    cassanonicholas
    141
    cassanonicholas 2021.04.04 10:41 
     

    The best indicator of the market, supply and demand zones are always respected. Since I use this indicator I see profits. If you use the indicator targets for entry, you will make a real sniper entry. I asked the author if it would be possible to create a dashboard that analyzes all pairs, but I was told that the algorithm is already too complicated, too bad I would have liked it.

    Ответ на отзыв
    Версия 5.2 2022.02.10
    In version 5.2, we have improved the supply demand detection algorithm. Altough this is only minor update, we still recommend you to download this latest version 5.2 for Ace Supply Demand Zone Indicator. Then enjoy this powerful update for your forex trading. In default, the multiple timeframe pattern detection is off, so swtich them on from input if you wish to use.
    Версия 5.0 2021.11.27
    In version 5.0, we made some minor improvement on the Ace Supply Demand Zone indicator for the multiple timeframe scanning to detect supply and demand zone across all timeframe.
    Версия 3.9 2021.11.25
    In Version 3.9, we have added Multiple Timeframe Scanning Capability to detect the supply demand zone across all timeframe. Enjoy this powerful new update for your trading.
    Версия 2.3 2020.11.05
    In version 2.3, we made a minor update only.
    Версия 2.2 2019.10.21
    In version 2.2, we have improved Supply and Demand Zone Detection Algorithm. In terms of how to use, there is nothing changed.
    Версия 2.1 2019.08.03
    In version 2.1, you can remove archived supply and demand zone by using short cut key Z. To show the archives supply and demand zone again, just click Show/Hide button again. In fact, this will redraw entire supply and demand zone. Enjoy this powerful non repainting and non lagging supply and demand zone indicator.
    Версия 2.0 2019.07.03
    Minor change. We have changed some inputs.