• Обзор
  • Отзывы (5)
  • Обсуждение (4)
  • Что нового

VolumeProfile

3.8

Descption:

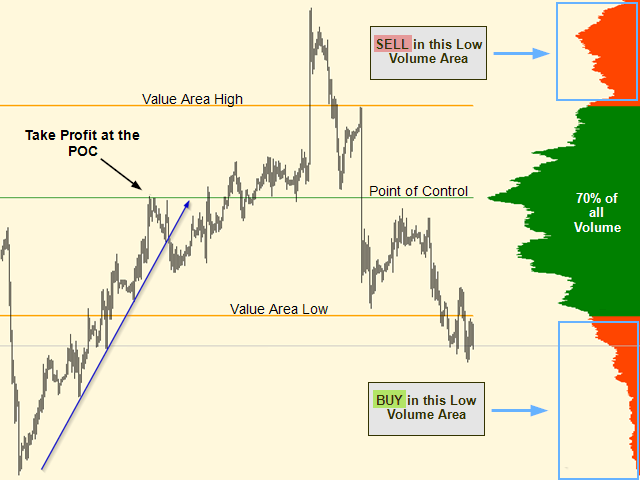
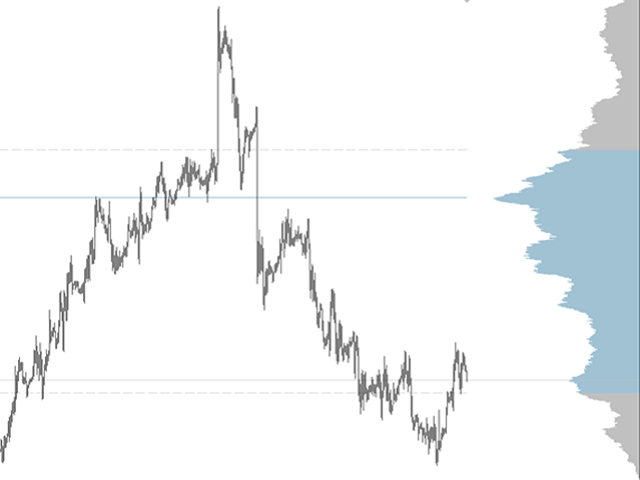
The Volume Profile displays detailed informations of historical trading activities at certain price levels (Market Profile).

So you can locate the areas with the best prices in the market and get an advantage about other market participants.


Features:

  • Customizable Volume Profile / Market Profile
  • Shows the "fair" Value Area with 70% of all Volume
  • Shows critical low volume zones
  • Shows VPOC, VAL and VAH Points
  • Works on all timeframes
  • Also available for MT5 (https://www.mql5.com/en/market/product/37391)

Settings:

Variable
 Standard Value Description
Bar History
1100
Number of historical Bars to calculate from
Level of Detail
1 Set the resolution for the profile. For protection purposes the level of detail will be automaticaly recalculated if you open a high volume chart such as GOLD or BTC.
Auto set X-Position
true
- Set this value to "true" to let the volume profile automaticaly align to your screen.
- Set this value to "false" to ajust the X-Position with the variable "X-Position"
X-Position
0
Set the X Position of the Indicator on the screen (recommended value is 30 to 60)
Scale
10 Adjust the size of the Indicator on the Chart (represents the % the Profile will cover of the Chart)
Profile_Color
Green
Color of the area with 70% of all volume (fair value area)
Profile_Color_VLow
OrangeRed
Color of the areas with low volume
Profile_Background
true
Set the profile to background
Value Area percentage  70 Set the percentage of the Value Area
Enable Point of Control true Enable/Disable POC Line
POC_Style
0
Set the Style of the Point of Control
POC_Color
Green
Set the Color of the POC
POC_Width
1
Set the Width of the POC
POC_Background
true
Set the POC to background
Enable Value Area Low Line  true Enable/Disable VAL Line
VAL_Style
0
Set the Style of the Value Area Low Line
VAL_Color
Orange
Set the Color of the VAL
VAL_Width
2
Set the Width of the VAL
VAL_Background
true
Set the VAL to the Background
Enable Value Area High Line  true Enable/Disable VAH Line
VAH_Style 0
Set the Style of the Volume Area High
VAH_Color Orange
Set the Color of the VAH
VAH_Width 2
Set the Width of the VAH
VAH_Background true
Set the VAH to the Background


Отзывы 5
Buai
132
Buai 2021.09.11 06:12 
 

I was looking for something exactly like this when I stumbled across it a short while ago. I don't use many indicators on my charts, but this one is one of the few that I do use. It gives a very clear broader picture of price action, an I take consideration of its input before every trade I take. I can adjust the colors so it's quite subtle & doesnt take over the chart. Because it gives indications of every time frame, it's absolutely fundamental and underpins all my trading. Well done Robert...

Frank Paetsch
7067
Frank Paetsch 2021.02.04 10:46 
 

danke

CSG CSG
1594
CSG CSG 2020.01.30 19:47 
 

Sehr gut gemacht! Ich handle schon recht lange und mag optische Klarheit und Instrumente, die in schnellen Marktsituationen nicht hängen bleiben (oder den ganzen Metatrader zum Einfrieren bringen), hier funktioniert auch bei großer Historie ALLES flüssig. Auch im Zusammenhang mit dem Stereotrader sehr gut anwendbar. Wer fragen hat, kann mir gern schreiben. Die meisten Volumen Tools analysieren max den aktuellen Monat, nicht einen definierten Zeitraum. Im MT5 Bereich hat jemand nur einen Stern gegeben, dabei aber nicht das Tool sondern, wie er selbst schreibt SEINE mangelnde Vorinformation bewertet und mal ehrlich, ob etwas 20 oder 120€ kostet, das holt man doch locker wieder rein mit guten Instrumenten und dieses VolumeProfile hier gehört alle mal dazu. Man sollte natürlich schon verstehen, was damit dargestellt wird und dann weiß man den Wert auch zu schätzen. Vielen Dank an den Entwickler!

Рекомендуем также
BoxChart MT4
Evgeny Shevtsov
4.57 (7)
Рынок несправедлив, хотя бы потому, что всего лишь 10% игроков управляют 90% капитала. У рядового трейдера мало шансов, чтобы противостоять этим «хищникам». Но выход есть, необходимо всего лишь перейти на другую сторону, необходимо находиться в числе этих 10% «акул», научиться распознавать их намерения и двигаться вместе с ними. Объем - это единственный опережающий фактор, который безупречно работает на любом периоде и любом торговом инструменте. Сначала зарождается и накапливается объем, и толь
Профиль Рынка (Market Profile) определяет ряд типов дней, которые помогают трейдеру распознать поведение рынка. Ключевая особенность - это область значений (Value Area), представляющая диапазон ценового действия, в котором произошло 70% торговли. Понимание области значений может помочь трейдерам вникнуть в направление рынка и установить торговлю с более высокими шансами на успех. Это отличное дополнение к любой системе, которую вы возможно используете. Blahtech Limited представляет сообществу Me
Market Profile 3
Hussien Abdeltwab Hussien Ryad
4 (4)
Market Profile 3 MetaTrader 4 indicator  — is a classic Market Profile implementation that can show the price density over time, outlining the most important price levels, value area, and control value of a given trading session. This indicator can be attached to timeframes between M1 and D1 and will show the Market Profile for daily, weekly, monthly, or even intraday sessions. Lower timeframes offer higher precision. Higher timeframes are recommended for better visibility. It is also possible t
FREE
Индикатор Supply Demand использует предыдущее ценовое действие для выявления потенциального дисбаланса между покупателями и продавцами. Ключевым является определение зон с лучшими возможностями, а не просто вероятностей. Индикатор Blahtech Supply Demand обеспечивает функционал, не доступный ни в одной платформе. Этот индикатор 4 в 1 не только выделяет зоны с более высокой вероятностью на основе механизма оценки силы по множественным критериям, но также комбинирует его с мульти-таймфреймовым анал
Индикатор строит текущие котировки, которые можно сравнить с историческими и на этом основании сделать прогноз ценового движения. Индикатор имеет текстовое поле для быстрой навигации к нужной дате. Параметры : Symbol - выбор символа, который будет отображать индикатор; SymbolPeriod - выбор периода, с которого индикатор будет брать данные; IndicatorColor - цвет индикатора; Inverse - true переворачивает котировки, false - исходный вид; Далее идут настройки текстового поля, в которое можн
Технический индикатор рассчитывающий свои показания на объемах торгов. В виде гистограммы показывает накопление силы движения торгового инструмента. Имеет независимые системы расчета для бычьего и медвежьего направления. Работает на любых торговых инструментах и тайм-фреймах. Может дополнить любую торговую систему. Индикатор не перерисовывает своих значений, сигналы появляются на текущей свече. Прост в использовании и не загружает график, не  требует производить дополнительные расчеты параметр
Volume Profile Indicator for MT4 Gain a trading edge with the "Volume Profile" indicator for MetaTrader 4 (MT4). This advanced technical analysis tool allows you to precisely identify key support and resistance levels based on transaction volume. Easily visualize market areas of high interest, where trading volumes are highest, and use this information to make more informed trading decisions. Key Features: Clear and detailed visualization : The indicator displays volume histograms directly on th
Daily Candle Predictor - это индикатор, который предсказывает цену закрытия свечи. Прежде всего индикатор предназначен для использования на графиках D1. Данный индикатор подходит как для традиционной форекс торговли, так и для торговли бинарными опционами. Индикатор может использоваться как самостоятельная торговая система, так может выступать в качестве дополнения к вашей уже имеющейся торговой системе. Данный индикатор производит анализ текущей свечи, рассчитывая определенные факторы силы внут
Market Profile Shows where the price has spent more time, highlighting important levels that can be used in trading. It is a powerful tool which is designed to take the fundamental components which comprise every market; price/volume/time, and visually display their relationship in real-time as the market develops for a pre-determined time period. Very powerful tool!
The Chaikin Oscillator is a technical indicator developed by Marc Chaikin that combines price and volume data to measure the accumulation and distribution of a financial instrument. It aims to identify potential buying and selling opportunities in the market. The Chaikin Oscillator is calculated by subtracting a 10-day exponential moving average of the Accumulation Distribution Line (ADL) from a 3-day exponential moving average of the ADL. Here's how to use the Chaikin Oscillator indicator in tr
The indicator allows you to trade binary options. The recommended time frame is М1 and the expiration time is 1,2,3 minutes. The indicator suitable for auto and manual trading. A possible signal is specified as a arrows above/under a candle. You should wait until the candle closes! Arrows are not re-painted Trade sessions: TOKYO section (Half-end) Currency pairs: USD/JPY Working time frame: M1 Expiration time: 1,2,3 minutes. The indicator also shows good results when using the martingale strateg
FREE
BoxInside MT4
Evgeny Shevtsov
4.55 (11)
Индикатор вычисляет профиль объёма и выставляет метки, соответствующие уровням VAL, VAH и POC, для каждой свечи индивидуально. Особенности работы индикатора Индикатор работает на периодах от M5 до MN, но для вычислений использует исторические данные меньших периодов: M1 - для периодов от M5 до H1, M5 - для периода H4, M30 - для периода D1, H4 - для периода W1, D1 - для периода MN. Цвет и положение меток VAL, VAH и POC на текущей свече считаются корректными только по времени близкому к закрытию
FREE
Уникальность данного индикатора заключается в алгоритме учёта объёмов: накопление происходит непосредственно за выбранный период  без привязки к началу дня. Последние бары можно исключить из расчёта, тогда текущие данные будут меньше влиять на  значимые уровни (объёмы), образованные ранее. Для более точного расчёта по умолчанию используются данные с графика М1. Шаг распределения ценовых объёмов регулируется. По умолчанию правая граница отображения установлена на бар, соответствующий началу испол
This indicator displays the histogram and arrows on chart. When Simple The Best Pro are placed on a chart, they identify the trend.  The color of may be blue or red. The blue color stands for upside moves and the red color stands for downside trends. The indicator offers to set Stop Loss (SL) and  Take Profit (TP)  setting. The default value is ATR. Indicator has automatic optimization. The STB is a unique indicator that shows the tendency (button Bars) of a particular signals. The STB tells us
Time Bubble ***Specialized for GBPJPY 1H time frame*** (tested for two years with success rates about 82%) Time Circle's smart algorithm detects the price circles with time . give strong signals at the right time as result of combine the price and time. our team spent months to develop this indicator specially for GBPJPY ..with high success rates about 82% win trades over two years .tested from December 2016 to November 2018. *** in last two years total signals 1012 with 829 Wins and
The Volumebyprice.com Indicator for MetaTrader 4 features Volume Profile and Market Profile TPO (Time Price Opportunity). Volume and TPO histogram bar and line charts. Volume Footprint charts. TPO letter and block marker collapsed and split structure charts. Static, dynamic and flexible range segmentation and compositing methods with relative and absolute visualizations. Session hours filtering and segment concatenation with Market Watch and custom user specifications. Graphical layering, posit
VR Grid
Vladimir Pastushak
4.57 (7)
Индикатор VR Grid разработан для создания графической сетки с настройками, определяемыми пользователем. В отличие от стандартной сетки VR Grid используется для построения круглых уровней . В зависимости от выбора пользователя, шаг между круглыми уровнями может быть произвольным. Кроме того, в отличие от других индикаторов и утилит, VR Grid сохраняет положение сетки даже при изменении временного периода или перезагрузке терминала. Настройки, set файлы, демо версии, инструкции, решение проблем, мо
FREE
VN Trade Panel II
Vyacheslav Nekipelov
4 (1)
Новый вариант торговой панели, в котором теперь имеется возможность раздельного закрытия ордеров Buy и Sell, показ на графике целей для всех ордеров, а также возможность использования панели для торговли с брокерами, работающими по правилу FIFO. Также в новой версии добавлены кнопки опций для раздельного управления открытыми ордерами. Имеет удобный визуализированный   интерфейс и интуитивно понятное управление без массы дополнительных вкладок, на которые трейдерам приходится отвлекаться и перекл
The Penta-O is a 6-point retracement harmonacci pattern which usually precedes big market movements. Penta-O patterns can expand and repaint quite a bit. To make things easier this indicator implements a twist: it waits for a donchian breakout in the right direction before signaling the trade. The end result is an otherwise repainting indicator with a very reliable trading signal. The donchian breakout period is entered as an input. [ Installation Guide | Update Guide | Troubleshooting | FAQ | A
VR Cub
Vladimir Pastushak
VR Cub это индикатор что бы получать качественные точки входа. Индикатор разрабатывался с целью облегчить математические расчеты и упростить поиск точек входа в позицию. Торговая стратегия, для которой писался индикатор, уже много лет доказывает свою эффективность. Простота торговой стратегии является ее большим преимуществом, что позволяет успешно торговать по ней даже начинающим трейдерам. VR Cub рассчитывает точки открытия позиций и целевые уровни Take Profit и Stop Loss, что значительно повы
Master scalping M1 -инновационный индикатор, использующий алгоритм для быстрого и точного определения тренда.Индикатор рассчитывает время открытия и закрытия позиций, алгоритмы индикатора позволяют находить идеальные моменты для входа в сделку (покупки или продажи актива), повышающие успешность сделок у большинства трейдеров. Преимущества индикатора: Прост в использовании, не перегружает график не нужной информацией. Возможность использования  как фильтр для любой стратегии. Работает на рынке
Индикатор анализирует изменение минимальных и максимальных цен предыдущих баров фиксируя вход больших игроков. В случае роста изменения (дельты) на график выводится сигнал в виде стрелки. При этом осуществляется виртуальная торговля на истории. В случае повторения сигнала осуществляется наращивание позиций (доливка). При этом лот позиций может отличатся. Результаты виртуальной торговли в виде потерь/убытков, прибыльности, просадки и линий сделок выводятся на график цены и в поле комментария. П
Эта панель является частью торговой системы SupDem-Pro и служит для поиска наилучших возможностей по любым доступным инструментам. Которые вы можете самостоятельно выбрать из Market Watch (открыв его CTRL+M). Использование этой торговой панели совместно с индикатором ShvedSupDem-Pro_Zone открывает возможность анализировать множество инструментов всего одним нажатием кнопки. Панель позволяет загружать любые инструменты из Market Watch от 6 основных валютных пар вплоть до всех инструментов (480).
The Market Profile Indicator for MT4 displays the price levels and zones where increased trading activity happens. These zones with substantial forex trading activity provide the forex traders with the best entry levels, support, and resistance levels. Moreover, price levels indicate the best reversal zones. As a result, forex traders can identify BULLISH and BEARISH market trends and BUY and SELL entry points as well as the best reversal points. The indicator works well in all intraday timefram
TrendPlus
Sivakumar Subbaiya
4.21 (14)
Trend Plus   Trendplus  Indicator   Time Frame: Suitable for any time frame.  Purpose: Trend Prediction. Blue and red candle indicate the buy and sell call respectively. Buy: When the blue candle is formed buy call is initiated. close the buy trades when the next red candle will formed.   Sell: When the Red candle is formed Sell call is initiated. close the Sell trades when the next blue candle will formed.   Happy trade!!
FREE
Индикатор Volume mag это очередной индикатор который использует для расчета точек входа тиковый объем. Индикатор подает сигнал редко, но это можно сказать   его преимущество. Сигналы индикатора не перерисовываются и не запаздывают и выдаются после закрытия текущей свечи. Индикатор не перегружает терминал и ведет расчет точек входа на протяжении величины BarsCount, которая задается в меню , по умолчанию 500 баров. 
TWO PAIRS SQUARE HEDGE METER INDICATOR Try this brilliant 2 pairs square indicator It draws a square wave of the relation between your two inputs symbols when square wave indicates -1 then it is very great opportunity to SELL pair1 and BUY Pair2 when square wave indicates +1 then it is very great opportunity to BUY pair1 and SELL Pair2 the inputs are : 2 pairs of symbols         then index value : i use 20 for M30 charts ( you can try other values : 40/50 for M15 , : 30 for M30 , : 10 for H1 ,
Индикатор Magneto Volume Trigger предназначен для определения подтвержденного свечным паттерном объема и прогнозирования тенденции тренда. Настройка и работа с индикатором На расчет значений влияют два параметра - Period и Gate . Чем меньше значение Gate , тем больше чувствительность индикатора. Period позволяет сделать выборку данных по указанному количеству свечей. Чем меньше значение Period , тем больше индикатор адаптирован под текущее состояние рынка. В окне индикатора можно отслеживать п
Noize Absorption Index - is the manual trading system that measures the difference of pressure between bears forces and bulls forces. Green line - is a noize free index that showing curent situation. Zero value of index shows totally choppy/flat market.Values above zero level shows how powerfull bullish wave is and values below zero measures bearish forces.Up arrow appears on bearish market when it's ready to reverse, dn arrow appears on weak bullish market, as a result of reverse expectation. S
UR Gamma
Krzysztof Jan Debski
УР Гамма (на основе аналогичных вычислений, используемых в системах машинного обучения) UR Gamma — это передовой инструмент финансового анализа, который предлагает новую и улучшенную версию классического индикатора WaveTrend. Включая передовые методы цифровой обработки сигналов, UR Gamma устраняет некоторые ограничения традиционных алгоритмов WaveTrend и обеспечивает более точный, надежный и динамичный подход к выявлению и измерению трендов в движении цены. Преимущества использования УР Гам
С этим продуктом покупают
ПОЖАЛУЙСТА, ПРОЧТИТЕ ИНФОРМАЦИЮ НИЖЕ ПЕРЕД ПОКУПКОЙ! Apollo Pips PLUS SP – уникальный продукт! ЭТО ДЛЯ ТЕХ, КТО ХОЧЕТ ПОЛУЧИТЬ МОЙ НОВЫЙ ИНДИКАТОР «APOLLO PIPS» + БОНУС «SUPER PACK» С ДОСТУПОМ КО ВСЕМ МОИМ ТОРГОВЫМ ИНДИКАТОРАМ! Покупая продукт Apollo Pips PLUS SP, вы фактически приобретаете абсолютно новую версию моего индикатора Apollo Pips. Эта версия индикатора имеет улучшенный алгоритм и простой в использовании параметр, который дает вам возможность использовать индикатор на любом рынке и в
Прежде всего стоит подчеркнуть, что этот торговый индикатор не перерисовывается, не перерисовывает и не отставает, что делает его идеальным как для ручной, так и для роботизированной торговли. Руководство пользователя: настройки, вводы и стратегия. Атомный аналитик - это индикатор ценового действия PA, который использует силу и импульс цены, чтобы найти лучший край на рынке. Оборудованный расширенными фильтрами, которые помогают убирать шумы и ложные сигналы, и повышают торговый потенциал. Испо
Gold Channel is a volatility-based indicator, developed with a specific timing algorithm for the XAUUSD pair, which consists of finding possible corrections in the market. This indicator shows two outer lines, an inner line (retracement line) and an arrow sign, where the theory of the channel is to help identify overbought and oversold conditions in the market. The market price will generally fall between the boundaries of the channel. If prices touch or move outside the channel it is a tra
В настоящее время скидка 20%! Лучшее решение для новичка или трейдера-эксперта! Эта приборная панель работает на 28 валютных парах. Он основан на 2 наших основных индикаторах (Advanced Currency Strength 28 и Advanced Currency Impulse). Он дает отличный обзор всего рынка Forex. Он показывает значения Advanced Currency Strength, скорость движения валюты и сигналы для 28 пар Forex на всех (9) таймфреймах. Представьте, как улучшится ваша торговля, когда вы сможете наблюдать за всем рынком с пом
PZ Day Trading
PZ TRADING SLU
3.67 (3)
Этот индикатор обнаруживает разворот цены зигзагообразно, используя только анализ ценового действия и канал Дончиана. Он был специально разработан для краткосрочной торговли, без перекраски или перекраски вообще. Это фантастический инструмент для проницательных трейдеров, стремящихся увеличить сроки своих операций. [ Руководство по установке | Руководство по обновлению | Устранение неполадок | FAQ | Все продукты ] Удивительно легко торговать Это обеспечивает ценность на каждом таймфрейме Ре
NAM Order Blocks
NAM TECH GROUP, CORP.
5 (1)
Индикатор обнаружения блоков ордеров мультитаймфреймов MT4. Функции - Полностью настраиваемая панель управления графиком, обеспечивает полное взаимодействие. - Скрыть и показать панель управления где угодно. - Обнаружение OB на нескольких таймфреймах. - Выберите количество OB для отображения. - Различные пользовательские интерфейсы OB. - Различные фильтры по OB. - Оповещение о близости OB. - Линии ADR High и Low. - Служба уведомлений (Экранные оповещения | Push-уведомления).
Enigmera
Ivan Stefanov
5 (4)
ЭНИГМЕРА: ядро рынка https://www.enigmera.com Введение Этот индикатор и торговая система представляют собой удивительный подход к финансовым рынкам. ENIGMERA использует фрактальные циклы для точного расчета уровней поддержки и сопротивления. Он показывает подлинную фазу накопления и дает направление и цели.  Система, которая работает независимо от того, находимся ли мы в тренде или в коррекции.  Как она работает? ENIGMERA состоит из трех линий: линии поддержки/сопротивления, линии цели и ли
Trend Trading - это индикатор, предназначенный для получения максимальной прибыли от трендов, происходящих на рынке, путем определения времени отката и прорыва. Он находит торговые возможности, анализируя, что делает цена во время установленных тенденций. [ Руководство по установке | Руководство по обновлению | Устранение неполадок | FAQ | Все продукты ] Торгуйте на финансовых рынках с уверенностью и эффективностью Прибыль от устоявшихся тенденций без проволочек Признать прибыльные откаты,
Reversal First Impulse levels (RFI)        INSTRUCTIONS     RUS    -      ENG           Рекомендуем использовать с  индикатором -  TPSpro  TREND PRO -  Version MT5 Важным ключевым элементом в трейдинге являются зоны или уровни, от которых принимаются решения о покупке или продаже торгового инструмента. Несмотря на попытки крупных игроков скрыть свое присутствие на рынке, они неизбежно оставляют следы. Наша задача заключалась в том, чтобы научиться находить эти следы и правильно их интерпретирова
Connect Indicator
Sukunthakan Ngernbamrung
Connect Indicator is a tool used for connecting indicators between the MQL market and MT4. The connected indicators are made by our group and can be used for other applications, such as sending messages to the Line application or Telegram application. If you have any questions, please don't hesitate to ask us to receive support. Function and indicator buffer Buffer one is the high price of the previous candle. Buffer two is the high price of the previous candle. Usage To connect indicators to fu
Ultimate Sniper Dashboard
Hispraise Chinedum Abraham
4.85 (27)
Скидка $299! Цены могут вырасти в будущем! Читайте описание ниже! Лучшая система ввода для Ultimate Sniper Dashboard: ПРЕДЕЛЬНЫЕ ДИНАМИЧЕСКИЕ УРОВНИ. (Пожалуйста, проверьте мои продукты) Ultimate Sniper Dashboard работает ТОЛЬКО на реальных рынках из-за ограничений мультивалютного тестирования MT4. Представляем вам Ultimate-Sniper Dashboard! Наша самая лучшая панель, которая содержит HA-Sniper, MA-Sniper и множество специальных режимов. Ultimate Sniper Dashboard - это абсолютный зверь!
Indicator : RealValueIndicator Description : RealValueIndicator is a powerful tool designed specifically for trading on the EURUSD pair. This indicator analyzes all EUR and USD pairs, calculates their real currency strength values, and displays them as a single realistic value to give you a head start on price. This indicator will tell you moves before they happen if you use it right. RealValueIndicator allows you to get a quick and accurate overview of the EURUSD currency pair tops and bottoms,
Cycle Sniper
Elmira Memish
4.41 (39)
NEW YEAR SALE PRICE FOR LIMITED TIME!!! Please contact us after your purchase and we will send you the complimentary indicators to complete the system Cycle Sniper is not a holy grail but when you use it in a system which is explained in the videos, you will feel the difference. If you are not willing to focus on the charts designed with Cycle Sniper and other free tools we provide, we recommend not buying this indicator. We recommend watching the videos about the indiactor and system before pu
Способ применения Pair Trading Station Рекомендуется использовать Pair Trading Station на таймфрейме H1 с любой валютной парой. Чтобы получить сигналы на покупку и продажу, следуйте указанным ниже инструкциям по применению Pair Trading Station в терминале MetaTrader. При загрузке Pair Trading Station на график индикатор оценит доступные исторические данные на вашей платформе MetaTrader для каждой валютной пары. В самой начале на графике отобразятся исторические данные, доступные для каждой валют
Данный индикатор предназначен для работы на любом ТФ. Программа на основе авторских алгоритмов и математике W.D.Ganna позволяет рассчитать целевые уровни движения цены по трем точкам с высочайшей степенью достоверности. Является прекрасным инструментом для биржевой торговли. Индикатор оснащен тремя кнопками NEW - вызвать треугольник для расчета. DEL - удалить выбранный треугольник. DELS - полностью удалить все построения. Вероятность достижения целей более 80%. Так же индикатор оснащен сигналом
The AT Forex Indicator MT4 is a sophisticated trading tool designed to provide traders with a comprehensive analysis of multiple currency pairs. This   powerful indicator   simplifies the complex nature of the forex market, making it accessible for both novice and experienced traders. AT Forex Indicator uses   advanced algorithms   to detect trends, patterns and is an essential tool for traders aiming to enhance their forex trading performance. With its robust features, ease of use, and reliabl
Уникальный индикатор, реализующий профессиональный и количественный подход к торговле на возврате к среднему. Он использует тот факт, что цена отклоняется и возвращается к среднему предсказуемым и измеримым образом, что позволяет использовать четкие правила входа и выхода, которые значительно превосходят неколичественные торговые стратегии. [ Installation Guide | Update Guide | Troubleshooting | FAQ | All Products ] Четкие торговые сигналы Удивительно легко торговать Настраиваемые цвета и разм
Introduction to X3 Chart Pattern Scanner X3 Cherart Pattern Scanner is the non-repainting and non-lagging indicator detecting X3 chart patterns including Harmonic pattern, Elliott Wave pattern, X3 patterns, and Japanese Candlestick patterns. Historical patterns match with signal patterns. Hence, you can readily develop the solid trading strategy in your chart. More importantly, this superb pattern scanner can detect the optimal pattern of its kind. In addition, you can switch on and off individu
ECM Elite Channel is a volatility-based indicator, developed with a specific time algorithm, which consists of finding possible corrections in the market. This indicator shows two outer lines, an inner line (retracement line) and an arrow sign, where the channel theory is to help identify overbought and oversold conditions in the market. The market price will generally fall between the boundaries of the channel. If prices touch or move outside the channel, it's a trading opportunity. The
TrendMaestro
Stefano Frisetti
5 (3)
note: this indicator is for METATRADER4, if you want the version for METATRADER5 this is the link:  https://www.mql5.com/it/market/product/108106 TRENDMAESTRO ver 2.4 TRENDMAESTRO recognizes a new TREND in the bud, he never makes mistakes. The certainty of identifying a new TREND is priceless. DESCRIPTION TRENDMAESTRO identifies a new TREND in the bud, this indicator examines the volatility, volumes and momentum to identify the moment in which there is an explosion of one or more of these data a
Данный продукт основан на методологиях Ганна его последователем Don E. Hall . Индикатор строит сетку определенного вида с помощью которой производится анализ графика.  Инструмент Pyrapoint, разработанный Доном Холлом, представляет собой сетку, основанную на Пифагоровом кубе. В своих расчетах он использует методологию Ганна Квадрат 9 и взаимосвязи между Ценой и Временем. Этот инструмент используется для прогнозирования изменений в тренде и общих действий рынка. Больше информации о методе   ТУТ
3 Indicators in 1 indicator Strategy based on price action Made specifically for the best forex currency pairs Can be used in the best time frame of the market at a very reasonable price This indicator is basically 3 different indicatos . But we have combined these 3 indicators in 1 indicator so that you can use 3 indicators at the lowest price. All three strategies are based on price action. But based on different trends. Long term, medium term and short term Attributes : No repaintin
Max Payne - это индикатор сигналов разворота/тренда, который подает сигналы в виде стрелки. Этот индикатор подает сигнал при закрытии одного и того же бара. Этот индикатор можно опускать на график несколько раз с разными периодами, чтобы получить двойное или тройное подтверждение сигналов. Индикатор легко настраивается, чтобы соответствовать любому стилю торговли, при этом он никогда не перерисовывается и не перерисовывается. После покупки вы получите полную систему, показанную на скриншотах, в
JULY OFFER 80% OFF next price for unlimited version will be 17000$. This is the only time you can get this institutional and professional indicator at this price for unlimited version. Don't dare to miss this. The tool I am about to introduce to you you can't compare it with other tools due to its strategy and accuracy level in predicting the next price directional movement . This tool is designed for serious traders who have decided to make a difference through trading. Be the next person to wi
Dear Traders this is my another tool called " Swing Master Indicator ". As the name above the indicator is designed to help you in swing trading by capturing the low and highs of the price. You may us this tool with any trading strategy and style from scalping to position trading. It is made for level of traders including newbies and advanced traders even prop-firms, hedge funds and banks to help them make sold market analysis. I create tools for serious traders who want to make a difference in
This indicator has been developed to identify and display these trends quickly and easily, allowing you to see instantly, those currency pairs which are trending, and those which are not – and in all timeframes, with just one click. The 28 currency pairs are displayed as a fan as they sweep from strong to weak and back again, and this is why we call it the ‘currency array’. All 28 pairs are arrayed before you, giving an instant visual description of those pairs that are trending strongly, those
Индикатор " ZigZag on Trend " представляет из себя помощника в определении направления движения цены, а так же калькулятора баров и пунктов. Состоит из трендового индикатора, следящей за направлением цены трендовой линией представленной в виде зигзага и счетчика вычисляющего число баров пройденных в направлении тренда и количество пунктов по вертикальной шкале.(расчеты ведутся по открытию бара) Индикатор не перерисовывается. Для удобства исполнен в виде окрашенных баров или в виде линий. Можно и
Представляем индикатор астрономии для MT4: Ваш незаменимый небесный товарищ в торговле Готовы ли вы поднять свой опыт торговли до небесных высот? Не ищите дальше, чем наш революционный индикатор астрономии для MT4. Этот инновационный инструмент выходит за рамки традиционных торговых индикаторов, используя сложные алгоритмы для предоставления вам беспрецедентных астрономических понимания и точных расчетов. Вселенская информация под рукой: Взгляните на обширную панель, раскрывающую сокровищницу ас
Индикатор Gann Squares представляет собой мощный инструмент для анализа рынка, основанный на математических концепциях, представленных W.D. Gann в его статье "Математическая формула для прогнозирования рынка." Этот индикатор включает в себя техники Ганна, связанные с квадратными числами, такими как 144, 90 и 52, а также Квадрат 9. Кроме того, он включает метод  по использованию Квадрата 9 в сочетании с каналами и паттерном звезды. Руководство пользователя и использование: Перед использованием эт
MT5 Version SMT Divergences MT4 SMT Divergences is one of the most innovative indicators in the market. It offers the possibility of analyzing price divergences between 2 pairs. These divergences highlight and help to foresee what banks and institutions are planning to do. SMT divergences also provides you with a kill zones indicator and the possibility of filtering divergences occurring during these kill zones.  The strategy tester is limited in MT4. Contact the author to get your Demo Version
Другие продукты этого автора
Description This addon is originated from my own trading. I spent my whole time waiting for signals and just wanted a notification  when a specific signal appears. So i started to wrote my own addon and called it "LifetimeSaver", because thats exactly what it is for me. But because this addon should not only be for my personal trading, I extended the LifetimeSaver and now its highly customizable,  so that it can fit your needs. Functions: Notification at your defined target/signal Notificatio
Description: The Volume Profile displays detailed informations of historical trading activities at certain price levels (Market Profile). Locate the areas with the best prices in the market and get an advantage over other market participants. Features: Customizable Market Profile Shows the "fair" Value Area with 70% of all Volume Shows critical low volume zones Shows VPOC, VAL and VAH Points integrated resource management to reduce the load while working with multiple charts Works on all tim
Description: TrendAccess can optimize your trading time by showing you the trend via two different calculation modes quick and easy. No more searching for Trends. Just open the chart and look at the trend display. Features: Shows Uptrend, Downtrend and "No Trend" indicator Shows the calculated ZigZag Profile Works on all timeframes Two different calculation Modes (MACD and Candle-based calculation) Settings: Variable  Standard Value Description  Calculation Mode  Candle based  C
Description: The Multi POC displays multiple Point Of Controls on one chart.  This Indicator is also already included in the "VolumeProfile" Indicator . Features: Customizable Range POC Customizable section POCs with VAL&VAH lines Works on all timeframes Drag & Drop for live calculation Support: The indicator is constantly being developed and improved. Please do not hesitate to contact me via the MQL5 Platform. I am very grateful about any Bug report, so that i can constantly improve the ind
Фильтр:
ROBERT EDWARD BIRD
2146
ROBERT EDWARD BIRD 2023.07.12 04:32 
 

Quite disappointed in this product. It moves itself to the middle of the screen and stays there making it difficult to navigate charts if it shows back up at all. when adjusting the properties as overview says, it'll often just disappear and not return. The same said when you change tf's. It'll just disappear. It only reads as shown on higher tf's. Lower tf's it really not useful at all. Quite disappointing.

Robert Hess
1649
Ответ разработчика Robert Hess 2023.07.12 14:12
Hi Robert Edward Bird, it seems that you activated the indicator on either a weekend day or without a valid broker connection. If the indicator wont get any new data from a broker, it wont update and will show up like you described. The new MT5 Version has an "auto refresh" option that was implemented for such cases. I appologise for any problems with the tool, but I hope my comment can help in your case. Robert Heß
Buai
132
Buai 2021.09.11 06:12 
 

I was looking for something exactly like this when I stumbled across it a short while ago. I don't use many indicators on my charts, but this one is one of the few that I do use. It gives a very clear broader picture of price action, an I take consideration of its input before every trade I take. I can adjust the colors so it's quite subtle & doesnt take over the chart. Because it gives indications of every time frame, it's absolutely fundamental and underpins all my trading. Well done Robert...

Frank Paetsch
7067
Frank Paetsch 2021.02.04 10:46 
 

danke

Saleh Alghanem
1093
Saleh Alghanem 2020.04.07 22:46 
 

Bad support

Robert Hess
1649
Ответ разработчика Robert Hess 2021.04.25 13:48
Hi Saleh, i can understand your position because i answered some days after your question. I have to apologize on that.
But i think there is more value of an indicator for you, than just the support of it. So i would be glad to hear if the indicator fits your needs and maybe you can give it the stars you think it deserves. Thank you. Robert
CSG CSG
1594
CSG CSG 2020.01.30 19:47 
 

Sehr gut gemacht! Ich handle schon recht lange und mag optische Klarheit und Instrumente, die in schnellen Marktsituationen nicht hängen bleiben (oder den ganzen Metatrader zum Einfrieren bringen), hier funktioniert auch bei großer Historie ALLES flüssig. Auch im Zusammenhang mit dem Stereotrader sehr gut anwendbar. Wer fragen hat, kann mir gern schreiben. Die meisten Volumen Tools analysieren max den aktuellen Monat, nicht einen definierten Zeitraum. Im MT5 Bereich hat jemand nur einen Stern gegeben, dabei aber nicht das Tool sondern, wie er selbst schreibt SEINE mangelnde Vorinformation bewertet und mal ehrlich, ob etwas 20 oder 120€ kostet, das holt man doch locker wieder rein mit guten Instrumenten und dieses VolumeProfile hier gehört alle mal dazu. Man sollte natürlich schon verstehen, was damit dargestellt wird und dann weiß man den Wert auch zu schätzen. Vielen Dank an den Entwickler!

Ответ на отзыв
Версия 1.37 2022.10.20
Added a function to limit the POC/VArea line lengths to the given History.
Версия 1.36 2022.01.14
- Added functions to Disable POC/VAH/VAL Lines
- Changed the "Scale" function -> it will now represent the "% of the Chart" and its default value is set to 10.
Версия 1.35 2021.07.02
- The appearance in mirrored mode has been corrected, the level of detail should now be the same as in non-mirrored mode
Версия 1.34 2021.06.11
New Feature:
- You can now adjust the percentage for the "value area"
Версия 1.33 2021.06.11
- Changed calculation of the profile to optimize the accuracy
Версия 1.32 2021.04.25
- Optimization of some processes, to reduce CPU usage
Версия 1.31 2020.05.26
Changes:
- you can now scale the VolumeProfile in mirrored mode
Версия 1.30 2020.05.13
Что нового:
Новые функции:
- Отражение в левую сторону: зеркальное отображение профиля объема в левой части графика.

корректировки:
- Добавлена ​​функция «Зеркало на левую сторону»
- описания следующих входов были изменены
- «Автоматическая установка X-Position» -> Горизонтальное положение (авто)
- «X-Position» -> Горизонтальное положение (ручное)
Версия 1.29 2019.04.16
- Code optimizations

Bug fixes
- fixed incorrect end of lines at specific indicator settings
Версия 1.28 2019.04.08
Bug Fixes
- the mt4 app now doesnt freeze in monthly view anymore
- the indicator now draws the lines correct, if the chart is shifted
Версия 1.27 2019.04.06
Исправление ошибок
- исправлена ​​ошибка, когда другие графические объекты на графике были удалены

Характеристики
- Удален выбор режима из-за увеличения производительности
-> Индикатор теперь будет перерисовываться, только если:
1. Появляется новый бар
2. График увеличен или уменьшен
3. Период графика изменился
4. Функция Autoscale устанавливает масштаб
Версия 1.26 2019.04.03
Генеральный:
- производительность увеличивается
- исправление ошибок

Масштабирование:
- Установите начальное значение Scale на 4
- Сбросить Масштаб до начального значения при увеличении
- Если масштаб слишком велик, линии больше не пересекают столбцы (если включен сдвиг диаграммы)
Версия 1.25 2019.04.02
- Bug fixes
- Smoothing in smaller timeframes
Версия 1.24 2019.03.27
- Bug fixes
Версия 1.23 2019.03.26
Implemented the function "Auto set X-Position"
- Set this value to "true" to let the volume profile automaticaly align to your screen.
- Set this value to "false" to ajust the X-Position with the variable "X-Position"
Версия 1.22 2019.03.23
- Further performance increases for low end clients and Live Mode
Версия 1.21 2019.03.23
- Disabled the output
Версия 1.2 2019.03.23
- Изменены некоторые расчеты, так что общий вид теперь стал намного более плавным, и вы можете видеть более высокие максимумы громкости
- Изменено начальное значение для «режима расчета» на «живой» вследствие последнего обновления
- Улучшена производительность в режиме «Live»
Версия 1.1 2019.02.10
I implemented a new Auto Detail function. If you open up a high volume chart, such as Gold or BTC, it calculates the level of detail by the overall volume. This function only triggers at a specific volume size, so that its only for protection purposes against performance issues.