• Обзор
  • Отзывы (16)
  • Обсуждение (24)
  • Что нового

Weis Wave with Alert MT5

4.93

Limited time offer 40% Discount on six month, yearly and lifetime packages. Offer ends 31/8/2024.

  • Six Month from 209$ to 125$
  • Yearly from 379$ to 227$
  • Lifetime from 599$ to 359$

Rental/Lifetime Package Options and Privileges 

* For optimum results the yearly or lifetime package is suggested due to live training !

Rent Monthly Six Months   Yearly/Lifetime
Weis Wave with Speed with Alert+Speed Index
x
x
x
Manual 
x
x
x
Quick Set up Video
x
x
x
Blog
x
x
x
Lifetime Updates
x
x
x
Setup and Training Material
x
x
Free Rectangle Break Alert Tool     
x
Discord Access Channel "The SI traders"

x
2-hour live methodology training

x


How to trade with it:   http://www.tradethevolumewaves.com 

** If you purchase please contact me to setup your  : Two hour  webinar and  training Room and  complete manual access. 


Weis Wave with Alert MT5

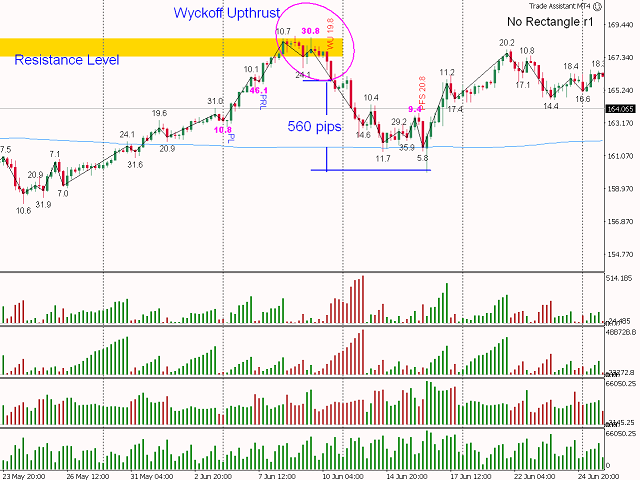
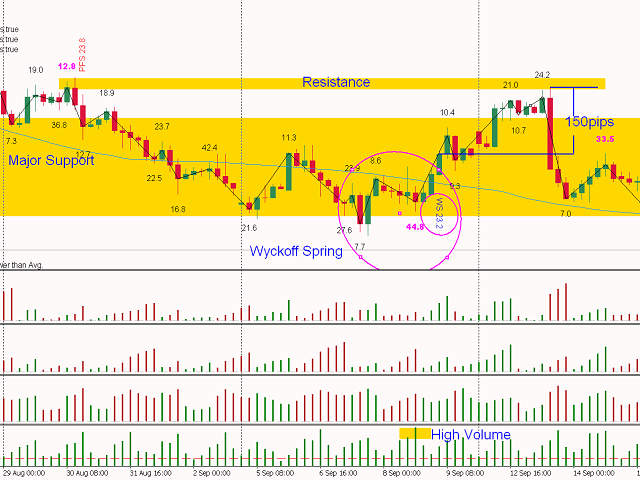
This is a Weis Wave indicator which is based on Richard D. Wyckoff theory. It works in all time periods, range bar and tick bar charts and it can be applied to any market.

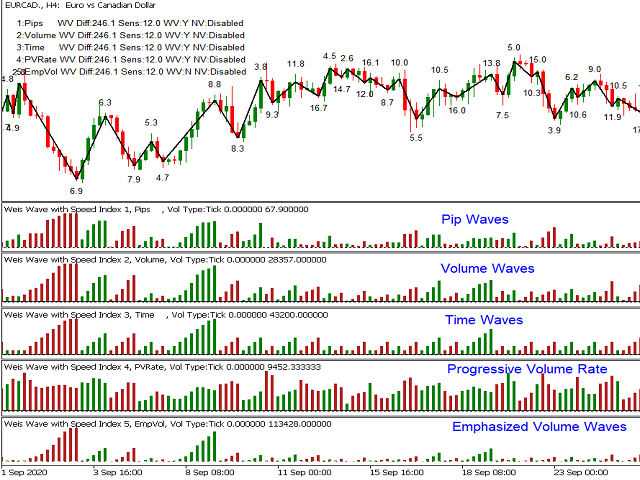
This indicator is an evolution of Weis Wave because it offers the autowaves feature, five different wave types as well as the powerful Speed Index.  Each price wave is moving in a specific direction up or down until it reverses. In order for the indicator wave to reverse in the opposite direction, the price should exceed the number of points (pip*10) set in the parameters. Therefore, the last wave repaints but the theory behind this trading method is forecasting where the market will go by reading  the previous waves.


Trading Strategies: www.tradethevolumewaves.com Setup Parameters
  • Indicator Number: Multiple Indicators can be added on the same chart. Valid values "0 to 9" and "a-z"
  • Show Orders: display or not your orders
  • Load all Bars: true/false, if false Number of bars back will be loaded
  • Number of bars back: numbers of bars that the indicator will load
  • Wave Direction Change difference in Points: Number of points required for the current wave to reverse and form a new wave
  • AutoDifference: true/false - Neglects the Wave Direction difference  and adjusts the Difference automatically creating more accurate waves.
  • AutoSensitivity: The higher the number the higher the sensitivity and therefore more waves are formed.
  • Volumetype= true=Tick Volume, false=Real Volume
  • Weighted Volume: true/false - Weights volume of  different sessions taking into consideration that when London and US are operating at same time have the highest volume of all sessions occurs and adjusts the rest of the sessions. With this parameter it very easy visualize which volumes are significant even on Asian hours or non-significant on London-US hrs.
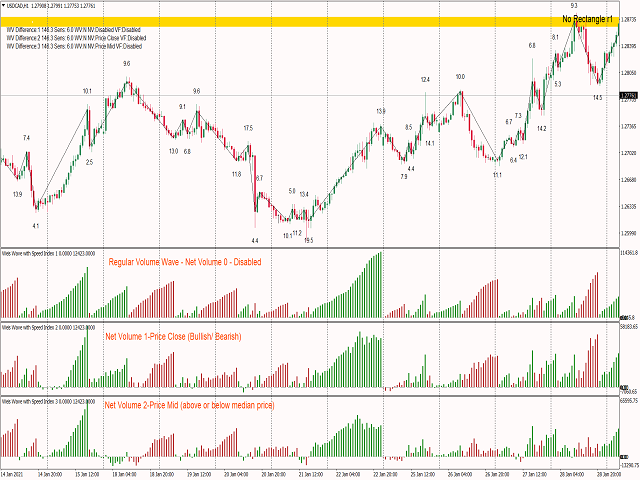
  • Net Volume: 0-Disabled, 1-Price Close, 2 Price Median
  • Wave Type: 0-Regular Volume, 1-Pips, 2-Progressive Volume Rate, 3-Time,4 Emphasized Volume Waves, 5 Inverse Progressive Pip Rate
Speed Index Display and Alert Parameters
  • SI Display: Show or not speed index on the chart 0-No Display, 1 Speed Index only, 2 Volume and Speed Index, 3 Speed Index and Average Speed Index, 4 Speed Index and Wave speed (Fast or SLow)
  • Show Plutus Patterns or Not
  • Alert on Plutus Patterns: Popup, Sound, Email, Push Notification
  • SpeedAlert: There are two ways that you can be notified for Extreme Speed Index numbers the Automatic and the Manual, please refer to the manual for explanations.
    • Alerts :Popup, Sound, Email, Push

Format Wave and Label
  • ShowLabels: Display or not the wave type the pips and the number of bars of each wave
  • What to Display:1-Volume,2-Pips, 3-Bars, 4-All, 5-Volume and Pips
  • ShowWaveLine: Draw the wave line or not on the price chart
  • Format: LabelShift, Font size, Color Up, Color Dn, wave color, wave width

Volume Alert The information displayed by the alert function are: the pair, the period, a message “High Down Volume” or “High Up Volume” and the time.
  • Volume Alert Above this limit: The value of cumulative volume that will be triggered if the alert is exceeded
  • Alerts: Popup, Sound, Email, Push
Format Numbers for better display parameters
  • VolDivBy: Volume divider in order to avoid big numbers on the display
  • PipDivBy: Pip distance  divider in order to avoid big numbers on the display
  • SI Multiplier: Speed Index Multiplier for better display
  • Reverse Style: inverts wave style


Отзывы 16
Mr_Corazon
54
Mr_Corazon 2024.03.10 09:28 
 

I read a book by David Weis and watched a video of his, from there I found this product which has been developed by Takis. He is passionate about what he has created and he is generous with his offering of expertise and more importantly he is generous with his time. It looks very complicated but its quite simple in essence and time spent with the creator and programmer himself was a pleasure. Thank you for everything so far Takis. And here is to a plentiful 2024

TruthMV
49
TruthMV 2023.06.03 00:23 
 

I just want to say thank for sharing your experience in putting together the "Weis Wave with Speedy Index Indicator". Using the Wyckoff Method, David Weis's Wave theory with Forex all in one. I would say it's not really a indicator, it's a way to read the charts for your self and not dependent on a line crosses this line or candle crossed a MA. I've been searching for many years trying to find some sort of logical process and common denominator in trading, I've spent thousands on all sort of esoteric books, platforms, data feeds etc. and was almost ready to quit, thinking I'm not smart enough to figure all this out. I've been applying the, "Trade The Volume Wave Method" for only three months, but I've had more consistent results and the confidence in what I'm learning will work. Even though I've made mistakes, now I know why and learn from them. Also, thanks for offering a two hour training session for free, for now, to get me up and running and the Discord Channel where we can discuss potential trades. Thank you Panagiotis (Takis) for giving all of us retail traders peace of mind and hope. Mark USA

mistaeff
159
mistaeff 2023.01.05 22:15 
 

Throughout my time using the MQL5 platform, I have never come across anyone who is more devoted to the success of their customers. The developer is a great guy, he spends hours sharing his knowledge and is a successful professional trader in his own right. He has developed a personal trading system, along with a pretty unique indicator that will enable you to consistently profit in the forex markets. I would highly recommend this product, whether you are starting a brand new strategy or even adding additional verifications to an existing strategy.

Рекомендуем также
Сложно найти и дефицит по частоте, дивергенции являются одним из самых надежных торговых сценариев. Этот индикатор автоматически находит и сканирует регулярные и скрытые расхождения, используя ваш любимый осциллятор. [ Руководство по установке | Руководство по обновлению | Устранение неполадок | FAQ | Все продукты ] Легко торговать Находит регулярные и скрытые расхождения Поддерживает много известных генераторов Реализует торговые сигналы на основе прорывов Отображает подходящие уровни ст
Ловец трендов: Стратегия Ловец трендов с индикатором оповещения - это универсальный инструмент технического анализа, который помогает трейдерам определять рыночные тренды и потенциальные точки входа и выхода. Он представляет собой динамичную стратегию Ловец трендов, адаптирующуюся к рыночным условиям для четкого визуального представления направления тренда. Трейдеры могут настраивать параметры в соответствии со своими предпочтениями и уровнем риска. Индикатор помогает в идентификации тренда,
FREE
The   Three White Soldiers candlestick pattern   is formed by three candles. Here’s how to identify the Three White Soldiers candlestick pattern: Three consecutive bullish candles The bodies should be big The wicks should be small or non-existent This 3-candle bullish candlestick pattern is a reversal pattern, meaning that it’s used to find bottoms. For this reason, we want to see this pattern after a move to the downside, showing that bulls are starting to take control. When a Three White Soldi
Introduction to X3 Chart Pattern Scanner X3 Cherart Pattern Scanner is the non-repainting and non-lagging indicator detecting X3 chart patterns including Harmonic pattern, Elliott Wave pattern, X3 patterns, and Japanese Candlestick patterns. Historical patterns match with signal patterns. Hence, you can readily develop the solid trading strategy in your chart. More importantly, this superb pattern scanner can detect the optimal pattern of its kind. In addition, you can switch on and off individu
Prices move for many reasons and these can vary from one operator to another: software, private and institutional traders simultaneously contribute to the formation of the price, making predictive art very difficult. However, there are measurable factors that bind the price to an underlying trend in line with the physical reality that the financial asset represents: these are the macroeconomic indicators. Large investors use this information wisely to set their strategies. Understanding these m
Этот индикатор определяет наиболее популярные гармонические паттерны, которые предсказывают точки разворота рынка. Эти гармонические паттерны представляют собой ценовые формации, которые постоянно повторяются на рынке Форекс и указывают на возможные будущие движения цены /   Бесплатная версия MT4 Кроме того, данный индикатор имеет встроенный сигнал входа в рынок, а также различные тейк-профиты и стоп-лоссы. Следует отметить, что хотя индикатор гармонических паттернов может сам по себе давать
FREE
PipFinite Exit EDGE MT5
Karlo Wilson Vendiola
4.89 (37)
Должна была состояться прибыльная сделка и вдруг отменилась? При наличии надежной стратегии выход из сделки также важен, как и вход. Exit EDGE помогает максимально увеличить доход от текущей сделки и не потерять выигрышные сделки. Всегда будьте внимательны к сигналу на выход из сделки Отслеживайте все пары и тайм-фреймы в одном графике www.mql5.com/en/blogs/post/726558 Торговля Вы можете закрыть уже открытые сделки, как только получите сигнал Закрывайте заявку на покупку, если вы получил
Forex traders often observe increased market activity near Supply and Demand zones, which are levels formed based on zones where strong price movements have previously occurred. The Supply Demand Strong Weak Confirm Indicator utilizes fractals and the ATR indicator to identify and plot support and resistance zones on the price chart. These zones are categorized as follows: - Weak: significant high and low points in the trend. - Untested: crucial turning points in the price chart that the pr
The "No Reversal Accumatrix AI" is a cutting-edge MetaTrader 5 indicator designed to assist traders in confirming trends without the inconvenience of repainting. Built upon advanced artificial intelligence algorithms, this indicator offers a reliable tool for identifying and validating trends in financial markets. Key Features: Non-Repainting Technology : Unlike traditional indicators prone to repainting, the "No Reversal Accumatrix AI" utilizes innovative algorithms to provide accurate trend co
Trend Trading - это индикатор, предназначенный для получения максимальной прибыли от трендов, происходящих на рынке, путем определения времени отката и прорыва. Он находит торговые возможности, анализируя, что делает цена во время установленных тенденций. [ Руководство по установке | Руководство по обновлению | Устранение неполадок | FAQ | Все продукты ] Торгуйте на финансовых рынках с уверенностью и эффективностью Прибыль от устоявшихся тенденций без проволочек Признать прибыльные откаты,
This indicator uses support and resistance, volume and some special formula to calculate the volume to filter the candles. If the volume reaches a specific value, And at the same time, Candle breaks the support/resistance line, There would be a signal and we can enter the market. Signals appear when the current candle closes. then you can enter the trade when a new candle appears. Please don't forget to follow your money management plan. MT4 Version Support/Resistance Breakout MT4 :   https
Прежде всего стоит подчеркнуть, что этот торговый индикатор не перерисовывается, не перерисовывает и не отставает, что делает его идеальным как для ручной, так и для роботизированной торговли. Руководство пользователя: настройки, вводы и стратегия. Атомный аналитик - это индикатор ценового действия PA, который использует силу и импульс цены, чтобы найти лучший край на рынке. Оборудованный расширенными фильтрами, которые помогают убирать шумы и ложные сигналы, и повышают торговый потенциал. Испо
>>> BIG SALE PROMOTION: 50% OFF + GIFT EA!  - Promo price: $64 / Regular price $129 <<< - The promotion will end soon! The Forex Trend Tracker is an advanced tool designed to enhance the trading capabilities of forex traders. This sophisticated indicator uses complex mathematical formulas alongside the Average True Range (ATR) to detect the beginnings of new upward and downward trends in the forex market. It offers visual cues and real-time alerts to give traders a competitive advantage in th
Salinui - Стрелочный трендовый индикатор, без запаздывания и перерисовки, применяется трейдерами в трендовых стратегиях в торговле на финансовых рынках (Форекс, CFD, бинарные опционы). Индикатор предсказывает наиболее вероятное краткосрочное движение цен на основе сложных математических расчетов. Одна из самых больших проблем, с которыми сталкиваются трейдеры, - это поиск подходящей для себя торговой системы. Этот индикатор создан для обнаружения тенденций движения цены и позволяет быстро опред
Индикатор ROMAN5 Time Breakout автоматически рисует блоки прорыва дневной поддержки или сопротивления. Он помогает пользователю определиться с направлением сделки. В утилиту также встроена функция звукового уведомления при появлении нового сигнала. Дополнительно доступна функция уведомления по email. Ваш e-mail адрес, а также параметры SMTP сервера должны быть указаны в настройках терминала MetaTrader 5 (вкладка "Почта"). Синяя стрелка вверх = Покупка. Красная стрелка вниз = Продажа. Вы можете и
FREE
This indicator finds Three Drives patterns. The Three Drives pattern is a 6-point reversal pattern characterised by a series of higher highs or lower lows that complete at a 127% or 161.8% Fibonacci extension. It signals that the market is exhausted and a reversal can happen. [ Installation Guide | Update Guide | Troubleshooting | FAQ | All Products ] Customizable pattern sizes Customizable colors and sizes Customizable breakout periods Customizable 1-2-3 and 0-A-B ratios It implements visua
Данный индикатор определяет паттерны Sandwich Bars по нескольким диапазонам, весьма надежные паттерны пробоя. Просто и эффективен в использовании Настраиваемые диапазоны баров Настраиваемый выбор цвета В индикаторе предусмотрены визуальные/почтовые/push/звуковые уведомления. Индикатор не перерисовывается и не рисует на истории Паттерн Sandwich состоит из одного бара, поглощающего несколько прошедших баров, пробивая и отклоняя весь ценовой диапазон. Синяя рамка - бычий пробой Красная рамка - медв
FREE
Версия MT4   |   FAQ Индикатор Owl Smart Levels – это полноценная торговая система внутри одного индикатора, которая включает в себя такие популярные инструменты анализа рынка как усовершенствованные фракталы Билла Вильямса , Valable ZigZag, который строит правильную волновую структуру рынка, а также  уровни Фибоначчи, которые   отмечают точные уровни входа в рынок и места взятия прибыли. Подробное описание стратегии Инструкция по работе с индикатором Советник-помошник в торговле Owl Helper При
Matreshka
Dimitr Trifonov
5 (1)
Самотестируемый и самооптимизируемый и ндикатор Matreshka: 1. Я вляется интерпретацией Теории Волнового Анализа Элиотта. 2. За основу взят принцип индикатора типа ZigZag, а волны строятся на принципе интерпретации теории ДеМарка. 3. Фильтрует волны по длине и высоте. 4. Рисует до шести уровней ZigZag одновременно , отслеживая волны разных порядков. 5. Отмечает Импульсные и Откатные волны. 6. Рисует стрелки для открытия позиций 7. Рисует три канала. 8. Отмечает уровни поддержки и сопротивления. 9
Divergence Detection: The indicator is designed to identify divergences between the price movement and the Stochastics oscillator. This can help traders spot potential trend reversals or trend continuation opportunities. Early Warning System: By capturing divergences, the Stochastics Divergence Indicator can provide an early warning of possible market turning points. This allows traders to take timely action and make informed decisions. Versatility: The indicator can be applied to various finan
Minions Labs' Candlestick Pattern Teller It shows on your chart the names of the famous Candlesticks Patterns formations as soon as they are created and confirmed. No repainting. That way beginners and also professional traders who have difficulties in visually identifying candlestick patterns will have their analysis in a much easier format. Did you know that in general there are 3 types of individuals: Visual, Auditory, and Kinesthetic? Don't be ashamed if you cannot easily recognize Candlest
Promotion $66 lifetime for you. The principle of this indicator is very simple: detecting the trend with Moving Average, then monitoring the return point of graph by using the crossing of Stochastic Oscillator and finally predicting BUY and SELL signal with arrows, alerts and notifications. The parameters are fixed and automatically calculated on each time frame. Example: If you install indicator on EURUSD, timeframe M5: the indicator will detect the main trend with the Moving Average on this t
The Cipher Hybrid-HFT Gold Trader: The Power of Probability Theory and Price Action Principles The vast majority of technical indicators are the same age as dinosaurs. Also, many retail traders are not aware of this fact: most technical indicators are developed for the stock market - not for the forex and not for the metals market. The apparent fact that you can not achieve consistent success in the metal market with old technical indicator theories and with the tools developed for stock marke
Awesome Oscillator Билла Уильямса с возможностью тонкой настройки и замены алгоритмов усреднения индикатора, что значительно расширяет возможности применения этого осциллятора в алгоритмическом трейдинге и приближает его по своим свойствам к такому индикатору, как MACD. Для уменьшения ценовых шумов итоговый индикатор обработан дополнительным усреднением Smooth.  Индикатор имеет возможность подавать алерты, отправлять почтовые сообщения и push-сигналы при смене направления движения осциллятора и
This indicator can automatically scan the RSI values of all varieties on the mt5 and set an alarm. Note that it is fully automatic scanning, you do not need to enter which varieties, do not need to open the variety chart, as long as there are some varieties in the market quotation column, will be automatically scanned to reach the set rsi alarm value, will pop up the alarm, and cycle with the market changes to scan the latest RSI values of all varieties, and alarm. This is very helpful t
Price Breakout pattern Scanner - это полностью автоматический и мощный анализ для трейдеров и инвесторов. Он определяет следующие паттерны на графике. Голова и Плечи - Распространенный паттерн для торговли. Обратная Голова и Плечи - эта модель обратна паттерну Голова и плечи. Двойная вершина - когда цена дважды достигает уровня сопротивления и снизится к уровню поддержки, трейдер может ожидать внезапный медвежий прорыв уровня поддержки. Двойное дно - двойное дно является противоположностью формы
Свинг-трейдинг - это первый индикатор, предназначенный для обнаружения колебаний в направлении тренда и возможных разворотов. Он использует базовый подход свинговой торговли, широко описанный в торговой литературе. Индикатор изучает несколько векторов цен и времени для отслеживания направления совокупного тренда и выявляет ситуации, когда рынок перепродан или перекуплен и готов к исправлению. [ Руководство по установке | Руководство по обновлению | Устранение неполадок | FAQ | Все продукты ]
Этот индикатор находит AB = шаблоны восстановления CD. Паттерн AB = CD Retracement представляет собой 4-точечную ценовую структуру, в которой начальный ценовой сегмент частично восстановлен и сопровождается равноудаленным движением от завершения отката, и является базовой основой для всех гармонических паттернов. [ Руководство по установке | Руководство по обновлению | Устранение неполадок | FAQ | Все продукты ] Настраиваемые размеры рисунков Настраиваемые соотношения AC и BD Настраиваемы
Key level breaker block MT5
Presley Annais Tatenda Meck
5 (1)
The key level breaker block indicator automatically draws breaker blocks for you on the chart. Breaker blocks are, in short, failed order blocks, but create strong support and resistance zones when price comes back to re-test them. Advantages  The key level breaker block DOES NOT RE-PAINT, giving you confidence when a signal appears and also helps when looking back.  The key level breaker block includes an on/off button on the chart to easily keep the charts clean after analysis by just on
Индикатор находит на графике свечные паттерны на основе книги Грегори Л. Морриса «Японские свечи. Метод анализа акций и фьючерсов». При обнаружении модели индикатор выдает сообщение при закрытии бара. Если вы торгуете с помощью терминала MetaTrader 4, то вы можете скачать полный аналог индикатора " Candle Pattern Finder for MT4 " Список распознаваемых моделей: Бычья / Медвежья (в скобках возможные настройки параметров) : Молот / Падающая Звезда (с подтверждением / без подтверждения*) Переверну
С этим продуктом покупают
note: this indicator is for METATRADER4, if you want the version for METATRADER5 this is the link:  https://www.mql5.com/it/market/product/108106 TRENDMAESTRO ver 2.4 TRENDMAESTRO recognizes a new TREND in the bud, he never makes mistakes. The certainty of identifying a new TREND is priceless. DESCRIPTION TRENDMAESTRO identifies a new TREND in the bud, this indicator examines the volatility, volumes and momentum to identify the moment in which there is an explosion of one or more of these data a
IVISTscalp5
Vadym Zhukovskyi
5 (5)
Что нового в индикаторе прогнозов iVISTscalp5 (Версия 10)? iVISTscalp5 – это авторская система прогнозов для любого финансового инструмента на неделю вперед (для быстрого скальпинга по уровням времени). iVISTscalp5 – инструмент для простого изучения и понимания финансового рынка. 1)     Индикатор прогнозов iVISTscalp5 полностью переписан на другой язык программирования ( C ++), что ускорило загрузку и обработку данных. Разное графическое отображение прогнозов на графике будет еще проще для п
Индикатор предназначен для того, чтобы вовремя закрывать позиции по рынку. Например: досрочно фиксировать прибыль, если цена не достигла TakeProfit, а рынок разворачивается. Индикатор анализирует импульс, а не тренд. О тренде никакой информации он не дает. Индикатор хорошо подходит для поиска дивергенции. Индикатор Ershov 38 Parrots динамически подстраивается под рынок и выявляет импульсы движения цены средней и высокой амплитуды. На мелкие скачки цены почти не реагирует.  Принципиальное о
Contact us to receive a comprehensive user guide after purchasing. William Delbert Gann, commonly known as W.D. Gann, was an exceptional market analyst renowned for his unique trading style in the early 20th century.  His trading techniques were based on a blend of mathematics, geometry, astrology, and ancient mathematics. Gann believed that stock market movements followed specific patterns and cycles, rather than being random. His methodologies, celebrated for their accuracy and relevance, con
ЭТОТ ИНДИКАТОР, ОСНОВАННЫЙ НА ИСКУССТВЕННОМ ИНТЕЛЛЕКТЕ, определяет возможные точки разворота рынка, считывая следы, и ЗАРАНЕЕ сигнализирует о небольших движениях рынка до того, как они произойдут. В отличие от индикаторов цены и объема, которые генерируют «поздние» входы, т. е. когда подтверждение цены или объема уже произошло при изменении направления и, следовательно, часто движение уже закончилось, этот индикатор сигнализирует, основываясь на том, что он читает в след, «КОГДА ДВИЖЕНИЕ ДОЛЖНО
VTrende Pro
Andrii Diachenko
5 (1)
VTrende Pro - МТФ индикатор для трендовой торговли с панелью индикации для МТ5 !!! - Подробное описание на русском языке под видео (на Youtube) - !!! Хотя сигналы индикатора VTrende Pro можно использовать, как сигналы полноценной торговой системы, рекомендуется применять их в связке с ТС Билла Вильямса. VTrende Pro - это расширенная версия индикатора VTrende . Отличие Pro версии от VTrende: - Временные зоны - Сигнал V - сигнал 1-2 волн Основная задача индикатора - определить точки изм
Indicador en MQL5, que obtiene el promedio de 10 EMAS, que son alineadas según Fibonacci, obteniendo un promedio, que sera suavizado.  Se puede ingresar un numero desde 2 a N, que multiplica a los EMA-Fibonacci. Funciona en cualquier criptomoneda, etc. etc... pudiendo calcular el futuro segun la tendencia de las EMAS. Funciona excelentemente en tramos largos, determinando exactamente el mejor inicio/salida. El precio inicial por apertura sera por un periodo de tiempo, luego aumentará.
TREND HARMONY MT5 – Multi Timeframe Trend and Phase and Pullback Level Visualizer indicator for Metatrader5 The TREND HARMONY indicator automates deep trend analysis and generates visualizations for you. Take control of your trades by eliminating uncertainty! Revolutionize your trading experience with precision and insight through the TREND HARMONY Multi Timeframe indicator – your ultimate MT5 trend visualization indicator. [  Features and Manual   | MT4 version |   All Products   ] Are you t
EQ Cutrim Theory
Marco Aurelio Santos Costa
Ронал Кутрим в течение 14 лет был увлеченным математиком с более чем 10-летним опытом работы на финансовом рынке. Концепция теории проста - найти дисбаланс между покупателями и продавцами. В этом есть большой смысл, потому что ничто не растет вечно, ничто не падает вечно.   Когда вы находите актив с математической вероятностью неравновесного равновесия, это отличный способ заняться трейдингом:  Включите субтитры, видео сопровождается субтитрами
WanaScalper
Isaac Wanasolo
1 (1)
A scalping indicator based on mathematical patterns, which on average gives signals with relatively small SL, and also occasionally helps to catch big moves in the markets (more information in the video) This indicator has three main types of notifications: The first type warns of a possible/upcoming signal on the next bar The second type indicates the presence of a ready signal to enter the market/open a position The third type is for SL and TP levels - you will be notified every time price r
Технический индикатор Smooth Price (Гладкая цена) используется для построения гладкой линии максимально приближенной к цене торгового инструмента и служит для устранения ее шумовых составляющих. Индикатор является частью торговой системы Monarch, но здесь он представлен как самостоятельный инструмент технического анализа. Основой индикатора служит кластерный цифровой фильтр , который, в отличии от проекта ClusterSMA , применяется непосредственно к ценовой таймсерии. Smooth Price не перерисовывае
Классификатор силы тренда. Показания на истории не меняет. Изменяется классификация только незакрытого бара. По идее подобен полной системе ASCTrend, сигнальный модуль которой, точнее его аппроксимация в несколько "урезанном" виде, есть в свободном доступе, а также в терминале как сигнальный индикатор SilverTrend . Точной копией системы ASCTrend не является. Работает на всех инструментах и всех временных диапазонах. Индикатор использует несколько некоррелируемых между собой алгоритмов для класси
Currency Index Watcher - это простой инструмент для тех, кто хочет торговать на рынке Форекс, используя индексы валют . После завершения расчетов показываются конкретные торговые возможности , и подаются сигналы по ним. Currency Index Watcher можно настроить непосредственно с панели управления : Индексы 8 валют: EUR, USD, GBP, JPY, CHF, AUD, CAD, NZD с возможностью выбирать для анализа индексы и синтетические пары. Выбор возможностей осуществляется в соответствии со следующими критериями: Minima
SmartTrendMt5 - индикатор тренда и торговых сигналов, основанный на принципе совмещенного анализа расчетных опорных точек внутри канала Келтнера. Индикатор формирует в отдельном окне канал Келтнера (по умолчанию линии красного цвета и линия синего цвета - середина канала), а также гистограмму расчетных опорных точек для каждой свечи (по умолчанию столбцы гистограммы желтого цвета). Индикатор устанавливается обычным образом на любой торговый символ с любым временным интервалом. Преимущества инд
Premium level - это уникальный индикатор с точностью правильных прогнозов  более 80%!  Данный индикатор тестировался более двух месяцев лучшими Специалистами в области Трейдинга!  Индикатор авторский такого вы больше не где не найдете!  По скриншотах можете сами увидеть точностью данного инструмента!  1 отлично подходит для торговли бинарными опционами со временем экспирации на 1 свечу. 2 работает на всех валютных парах, акциях, сырье, криптовалютах Инструкция: Как только появляется красная стре
Indicador en base a la pendiente de la linea de precio, dibuja una línea de color cuando sube a base de los precios que previamente has sido procesados o linealizados, y cuando baja la pendiente la linea linealizada toma otro color. En este caso se a considerado 6 lineas de diferentes procesos desde pendientes largas hacia las cortas, observándose que cuando coincidan las pendientes se produce un máximo o mínimo, lo que a simple vista nos permitirá hacer una COMPRA O VENTA.
Индикатор Coefficient Of Determination (COD) представляет собой значение коэффициента детерминации или квадрат коэффициента корреляции между зависимой переменной — ценой и объясняющей переменной — тиковым объемом. Что это дает нам на практике? COD отлично распознает кульминацию трендовых движений, что позволяет подбирать оптимальные точки и ловить развороты рынка. Как использовать индикатор: Наиболее популярная торговая стратегия строится совместно с трендовым индикатором Moving Average (MA), пе
Fibonacci Múltiple 12, utiliza la serie fibonacci plasmado en el indicador fibonacci, aumentadolo 12 veces según su secuencia. El indicador fibonacci normalmente muestra una vez, el presente indicador se mostrara 12 veces empezando el numero que le indique siguiendo la secuencia. Se puede utilizar para ver la tendencia en periodos cortos y largos, de minutos a meses, solo aumentado el numero MULTIPLICA.
Recommended TimeFrame >= H1. 100% Non Repainted at any moment.  Use it carefully, only with Trend Direction. Trading Usage: 2 Variants: as Range System or as BreakOut System (Both Only With Trend Direction)::: (Always use StopLoss for minimise Risk); [1] as Range System: (Recommended) in UP TREND:  - BUY in Blue Line , then if price goes down by 50 points (on H1) open Second BUY.   Close in any Profit you wish: TrailingStop(45 points) or Close when Price touches upper Gold Line. in DOWN TR
En base a cálculos matemáticos de determino una linea Horizontal que cruza a todas las señales de trading, mostrando los máximos y mínimos. La linea horizontal parte en dos las subidas y bajadas de las señales de trading, de tan manera que es fácil identificar los máximos y mínimos, y es inteligente por que es sensible a las subidas y bajadas, afín de no quedarse en un solo lado por siempre, trabaja excelentemente con otros indicadores suavizadores ya que les garantiza que en un intervalo de tie
этот индикатор является индикатором детектора спайков, он специально разработан для обмена на Boom 1000, Boom 500, Crash 1000 и Crash 500 Мы рекомендуем использовать его только для индексов Deriv Boom и Crash. Его настройки интуитивно понятны, знакомы, просты в использовании имеет функции уведомления; звуковые уведомления и push-уведомления. этот инструмент прост в использовании, прост в обращении Это обновление основано на разных стратегиях для шипов.
Индикатор отслеживает тренд в 5 разных временах графика для одного и того же актива, основываясь на 6 сигналах для каждого времени графика. Основная цель индикатора - показать нам тенденцию большинства финансового актива, в котором он был размещен. Система передает информацию о тенденциях в несколько графических периодов, таким образом, пользователь может иметь широкое представление о движении актива, этот тип инструмента дает пользователю более высокую частоту обращений, помогая оператору в
Limitless MT5  - это универсальный индикатор который подойдет каждому как начинающему так и опытному трейдеру работает на всех валютных парах криптовалютах сыре акциях Limitless MT5 - уже настроен и не требует дополнительной настройки   А теперь главное Почему  Limitless MT5 ? 1 полное отсутствие перерисовки  2 два года тестирования лучшими специалистами в трейдинге 3 точность правильных сигналов превышает 80% 4 хорошо показал себя в торговле во время выхода новостей Правила торговли  1 сигнал н
панель просмотра тренда; Тенденция автосигналов Индикатор отслеживает тренд на 5 разных графиках одного и того же актива, основываясь на 6 сигналах для каждого графика. Основная цель индикатора - показать нам тренд большинства финансового актива, в который он был помещен. Система передает информацию о тенденциях в разное графическое время, таким образом, пользователь может иметь широкий обзор движения актива, этот тип инструмента позволяет пользователю иметь более высокий процент по
Indicador en MQL5, recibe la información del precio SUAVIZADO, lo procesa anulando los picos inteligentemente, y el resultado lo envía al desarrollo de la escalera que iniciara y subirá o bajara según el peldaño o INTERVALO ingresado Ingreso PERIODO = 50 (variar segun uso) Ingreso MULTIPLICA AL PERIODO = 1 (variar segun uso) Segun la configuración la escalera puede pegarse o separarse de los precios,, Se aplica toda la linea de tiempo, y a todas las divisas, etc.  
Micro  ******************* Секундные графики MT5 ********************** Более точного инструмента для входа в сделку вы не найдёте. Входные параметры: Timeframe, sek - период построения графика, секунды Displayed bars - отображаемые бары Step of price levels, pp, 0-off - шаг отрисовки ценовых уровней, пункты Scale points per bar, 0-off - масштаб в пунктах на бар Show lines - отображение текущих уровней Show comment - отображение комментария Standard color scheme - стандартная цветовая сх
QuantXMarketScanner is a multi assets indicator for MT5 - Mathematical model based on 7 custom moving averages indicators  - Adaptable on Currencies, Stocks and Crypto - Automatic setup, self optimized About QuantXsystem Products: –         Simple installation & integration into MT5   –         Unlimited License after purchase (for one user) –         Automatic pattern recognition to identify the best timing and price levels. –         Trading indicators are displayed directly and automatica
QuantXSTocks Trading Range Indicator for MT5: INSTRUCTIONS TO USE OUR INDICATOR:- User needs to take trade on Arrow or after an Arrow CandleStick, You can achieve up-to 35-125 pips target by this Indicator. Best Timeframes for Stocks and Indices are M30 and H1: AMAZON M30 (50 pips) TESLA M30 (50 pips) APPLE M30 (50 pips) ADOBE M30 (50 pips) NASDAQ100 H1 (125 pips) The above are the approximate amount of pips you can achieve by this Indicator, Green arrow appears to be buy arrow while the Red a
Super Suavizador
Cesar Juan Flores Navarro
Indicador en MQL5 que obtiene el promedio de 10 EMAS que son alineadas y procesadas según Fibonacci luego el promedio es suavizado"  Se ingresa un número de 2 a N que multiplica los EMA-Fibonacci y por consiguiente aumenta los fibonacci, resultando un promedio.   Se ingresa un número que suaviza los EMA-Fibonacci. Considerando los números 1/1 seria la suavización minima. Considerando los números 3/5 seria la suavización media. Considerando los números 10/30 seria la suavización alta.....etc
Trend and Signals MT5  indicator scans  30 trading Instruments (Forex, Metals and Indices).     It uses special algorithm on the  current market   based on   Pure Price Action   and display the overall trend and signal on the dashboard. When signals are produced the indicator sends alert and notification. Strategy for Signals This indicator uses the daily timeframe to determine the direction of the trend. The hourly timeframe is used to identify possible entries. Main trend and is determined by
Другие продукты этого автора
Anchored VWAP with Alert
Trade The Volume Waves Single Member P.C.
5 (4)
What is the Volume Weighted Average Price (VWAP)? The volume weighted average price (VWAP) is a trading benchmark used by traders that gives the average price an instrument has traded at throughout the day, based on both volume and price.  It is important because it provides traders with insight into both the trend and value of the instrument. What is the Difference between VWAP and AVWAP? While VWAP is having as starting point the beggining of the day,week,month etc. in the AVWAP you can pla
TrendLines Cross with Alert
Trade The Volume Waves Single Member P.C.
5 (2)
Trend Lines Cross  This indicator will alert you on any cross of a Trendline. You can draw up to two trend lines and form a channel, a pennant , a triangle or a simple trend and when the price crosses either trend line the indicator  will provide you with alerts that you define plus an up or down arrow when the cross happened. How to:   Draw the 1st trendline and name it tl1.  Draw the 2nd trendline and name it tl2. Select which type of alerts you would like in the indicator properties and you a
FREE
Weis Wave with Alert
Trade The Volume Waves Single Member P.C.
4.81 (21)
Индикатор волны Вайса основан на теории Ричарда Вайкоффа. Работает на всех таймфреймах, флетовых и тиковых графиках. Может применяться к любому рынку. Индикатор добавляет объемы соответствующих ценовых волн и рисует кумулятивную гистограмму. Каждая ценовая волна движется в определенном направлении вверх или вниз, пока не изменится. Чтобы индикаторная волна развернулась, цена должна превышать количество точек (пипсы * 10), установленных в параметрах индикатора. Поэтому последняя волна перерисовыв
No Demand No Supply
Trade The Volume Waves Single Member P.C.
4.5 (4)
This indicator identifies No Demand –No Supply candles  to your chart and plots volume bars colored according to the signal. It can be applied to all timeframes or to a specific one only. It can also be used as regular volume indicator but with exceptional future of WEIGHTED VOLUME. Furthermore is has an alert notification, sound and email when a signals occurs. The indicator does not repaint but the alert will come on two candles back due to the definition of No Demand No Supply. The VSA (Volum
Wave Anatomy
Trade The Volume Waves Single Member P.C.
4.5 (2)
Wave Anatomy Visit:   http://www.tradethevolumewaves.com   for more information Construct your own 5 Waves and analyze the price movements stages: Easy Movement Hard time to move Fast move This indicator is based on Wyckoff’s, David’s Weis and my Speed Index Theory. This indicator will you help analyze what is happening in 5 Price Waves that you can construct yourself. This tool is designed for scalpers and swing traders and will help them to analyze any wave on any timeframe at the same tim
No Demand No Supply MT5
Trade The Volume Waves Single Member P.C.
No Demand No Supply   This indicator identifies   No Demand –No Supply candles to your chart and plots volume bars colored according to the signal. It can be applied to all timeframes or to a specific one only. It can also be used as regular volume indicator  with exceptional future of WEIGHTED VOLUME. Furthermore is has an alert notification, sound and email when a signals occurs. The indicator does not repaint but the alert will come on two candles back due to the definition of No Demand No Su
Anchored VWAP with Alert MT5
Trade The Volume Waves Single Member P.C.
5 (1)
What is the Volume Weighted Average Price (VWAP)? The volume weighted average price (VWAP) is a trading benchmark used by traders that gives the average price an instrument has traded at throughout the day, based on both volume and price.  It is important because it provides traders with insight into both the trend and value of the instrument. What is the Difference between VWAP and AVWAP? While VWAP is having as starting point the beggining of the day,week,month etc. in the AVWAP you can p
Wave Anatomy MT5
Trade The Volume Waves Single Member P.C.
Wave Anatomy Visit:  http://www.trafethevolumewaves.com  for more information Construct your own 5 Waves and analyze the price movements stages: Easy Movement Hard time to move Fast move This indicator is based on Wyckoff’s, David’s Weis and my Speed Index Theory. This indicator will you help analyze what is happening in 5 Price Waves that you can construct yourself. This tool is designed for scalpers and swing traders and will help them to analyze any wave on any timeframe at the same time. Fur
Фильтр:
Mr_Corazon
54
Mr_Corazon 2024.03.10 09:28 
 

I read a book by David Weis and watched a video of his, from there I found this product which has been developed by Takis. He is passionate about what he has created and he is generous with his offering of expertise and more importantly he is generous with his time. It looks very complicated but its quite simple in essence and time spent with the creator and programmer himself was a pleasure. Thank you for everything so far Takis. And here is to a plentiful 2024

Trade The Volume Waves Single Member P.C.
5697
Ответ разработчика Panagiotis Diamantopoulos 2024.03.10 09:39
Thank you for your honest review and kind words.
TruthMV
49
TruthMV 2023.06.03 00:23 
 

I just want to say thank for sharing your experience in putting together the "Weis Wave with Speedy Index Indicator". Using the Wyckoff Method, David Weis's Wave theory with Forex all in one. I would say it's not really a indicator, it's a way to read the charts for your self and not dependent on a line crosses this line or candle crossed a MA. I've been searching for many years trying to find some sort of logical process and common denominator in trading, I've spent thousands on all sort of esoteric books, platforms, data feeds etc. and was almost ready to quit, thinking I'm not smart enough to figure all this out. I've been applying the, "Trade The Volume Wave Method" for only three months, but I've had more consistent results and the confidence in what I'm learning will work. Even though I've made mistakes, now I know why and learn from them. Also, thanks for offering a two hour training session for free, for now, to get me up and running and the Discord Channel where we can discuss potential trades. Thank you Panagiotis (Takis) for giving all of us retail traders peace of mind and hope. Mark USA

Trade The Volume Waves Single Member P.C.
5697
Ответ разработчика Panagiotis Diamantopoulos 2023.06.03 06:12
Thank you for your kind words Mark.
mistaeff
159
mistaeff 2023.01.05 22:15 
 

Throughout my time using the MQL5 platform, I have never come across anyone who is more devoted to the success of their customers. The developer is a great guy, he spends hours sharing his knowledge and is a successful professional trader in his own right. He has developed a personal trading system, along with a pretty unique indicator that will enable you to consistently profit in the forex markets. I would highly recommend this product, whether you are starting a brand new strategy or even adding additional verifications to an existing strategy.

Trade The Volume Waves Single Member P.C.
5697
Ответ разработчика Panagiotis Diamantopoulos 2023.01.05 22:18
Thank you for your honest review!
Mark Renier
33
Mark Renier 2022.11.27 07:57 
 

I wanted to have Weis wave indicator in my charts and I decided for this indicator because additional features that it offers. Actually I changed the platform just to get Weis wave indicator and I decided for MT5. MT5 has its flaws, so I would rather recommend others to choose MT4 if they have to made the same decision. Support for this indicator is exelent. Takis is always available for help and he is answering any questions. And personal private teaching from Takis is also very valuable. Beside that you get access to private discord group where trade opportunites are shared and also other discussions regarding Weis wave. I would like to thank Takis for his help and support.

Trade The Volume Waves Single Member P.C.
5697
Ответ разработчика Panagiotis Diamantopoulos 2022.11.27 09:54
Thank you Mark.
baszim
240
baszim 2022.06.21 17:22 
 

For me this was a Ahaa moment. The indicator helped me understand Wyckoff methodology in a better way. It provides you most of the times a early warning signal when analysing trading ranges on 1hr timeframe. The plutus signals are kickoff from phase D, the jump across the creek or the fall through the ice. Accompanied with the two hours teaching of Takis, his rectangle warning tool and the Discord group, you have another set of tools that gives you a better reward percentage in you trading. Make no mistake, this isn't a set and forget indicator with a signal! You have to read the background of the chart yourself and validate the signals and or tune the indicator sensitivity. This must be done for each currency pair. That takes practice and patients and time. Thanks for the tools Takis and the ongoing support and sharing on Discord!

Trade The Volume Waves Single Member P.C.
5697
Ответ разработчика Panagiotis Diamantopoulos 2022.06.21 17:58
Thank you for your review Bas. It is worth noting what you mentioned about this not being a signal indicator, if it was that easy I would have created a robot trading but markets change and you need to be able to read them and adjust accordingly. This is a tool that will help read the market and understand Wyckoff better as you already mentioned. Thanks again for the review!
Sh_Mikhail
231
Sh_Mikhail 2022.01.31 08:21 
 

Very pleased with the purchase. The two hours training with Takis are extremely valuable, and it does not stop at that. He is using a community App to share a lot of tips and to explain the rational behind some of the trades he takes. That means we are getting continuous education to improve our skills using the indicator. He also shares signals with us which he does not have to do. Highly recommended if you are serious about improving your manual trading. Thanks a lot Takis for all your efforts. Highly appreciated

Trade The Volume Waves Single Member P.C.
5697
Ответ разработчика Panagiotis Diamantopoulos 2022.01.31 08:25
Thank you for your kind words! Trying my best to educate retail traders because I have been there and know how it is. Thanks again.
Leguar
65
Leguar 2022.01.07 11:43 
 

The indicator is just the tip of the iceberg. The real value is the education you get for the price of the indicator. I highly recommend it and thank you!

Trade The Volume Waves Single Member P.C.
5697
Ответ разработчика Panagiotis Diamantopoulos 2022.01.07 13:45
Thank you Leguar. Exactly as you mention, the real value is the education behind it and it is worth much more than the indicator. Furthermore, I think it is worthwhile to mention that I am trading with the indicator myself, not just selling it. Thanks again.
Sumit Dubey
1462
Sumit Dubey 2021.12.13 05:09 
 

Excellent indicator and support. Best part is , knowledge to apply indicator and understand market move is free with indicator. Must say , price for education not indicator. Thanks a lot Mr. Panagiotis !

Trade The Volume Waves Single Member P.C.
5697
Ответ разработчика Panagiotis Diamantopoulos 2021.12.13 07:22
Thank you Sumit, I hope you make lots of pips with it.
Andre Gomes
2771
Andre Gomes 2021.10.14 20:30 
 

Excellent indicator and customer support. This tool really gives you an edge. Totally recommend it.

Trade The Volume Waves Single Member P.C.
5697
Ответ разработчика Panagiotis Diamantopoulos 2021.10.14 20:45
Thank you Andre!
Rutt Tungkiratichai
1233
Rutt Tungkiratichai 2021.09.13 05:43 
 

This is the price for education not only indicator.This indicator open new world for me.

Trade The Volume Waves Single Member P.C.
5697
Ответ разработчика Panagiotis Diamantopoulos 2021.09.13 06:54
Thank you Rutt!
adonis4ex
6308
adonis4ex 2021.07.29 11:49 
 

Пользователь не оставил комментарий к оценке

Trade The Volume Waves Single Member P.C.
5697
Ответ разработчика Panagiotis Diamantopoulos 2021.07.29 12:21
Thank you for your kind words Adonis4ex
satish vangipuram
33
satish vangipuram 2020.12.26 17:06 
 

this product and the methods taught by takis are geared towards practical trading purposes. there are not a lot of products out there about which this can be said. the personal mentoring and help by takis is high quality. he will work with you to develop a trading strategy. no bullshit. well worth the money.

SamitR
1271
SamitR 2020.06.23 00:13 
 

If there was a way I could give someone 100 stars , then this would be it !!!!! I have never had anyone like Panagiotis during all my time in the field of trading He literally held my hand and went through all the steps of how to use his fabulous indicators He is a true gentleman..God Bless

malmegrin
69
malmegrin 2019.12.04 18:27 
 

The Best Weis Wave indicator available!!!! Blazing fast and full of features. And the tech support is Awesome!!!!!! Thx a lot for the Work Mr. Panagiotis.

Eduardo Silva Vian
328
Eduardo Silva Vian 2019.11.30 05:00 
 

Excelente indicador. De todos weis wave, sem dúvida esse é o melhor. O speed index é muito efetivo para antecipar grandes movimentos, sem dúvida, o melhor indicador para rastrear o "smart money". Recomento. Um investimento que você não vai se arrepender.

Excellent indicator. Of all weis wave, no doubt this is the best. Speed index is very effective for anticipating large movements, arguably the best indicator for tracking smart money. I recommend it. An investment you will not regret.

Globex43
214
Globex43 2019.09.11 13:45 
 

Excellent!

Ответ на отзыв
Версия 10.0 2023.10.08
Added alerts for the two new signals PFBL and PFBS
Версия 9.9 2023.10.08
Two more Fake Break Signals have been added:
PFBL - Plutus Fake Break Long
PFBS - Plutus Fake Break Short
Версия 9.8 2023.07.17
New Wave Type added IPPR: Inverse Progressive Pip Rate. Please refer to the manual for a detail explanation!
Версия 9.7 2023.03.12
Added a double signal of WS+PRL or WU+PRS when both conditions are met
Версия 9.6 2023.02.14
New Feature added making the indicator faster by calculating part of the code only on New Bar creation. Just set "Calc OnNewBar=true"
This feature is extremely useful when you are working with Custom charts such as Tick Charts, Renko, Range, etc which are very CPU intensive but also if you have lots of charts open.
Версия 9.5 2023.01.16
Fixed Plutus signal moving to next bars
Версия 9.4 2022.12.23
Rollback
Версия 9.3 2022.12.23
Fixed displaying Pips instead of Points on Autowaves
Версия 9.2 2022.12.16
Updated Autowaves Algorithm - AutoSensitivity adjustment might be necessary.
New Feature - Auto Fast and Slow Waves
Setting Speed Index Display to 4 the indicator will display next to Speed Index the letter F="Fast" or "S"=Slow to designate if the wave is fast or slow compared to the Average Speed Index.
You can set how fast or slow from the Extreme_Threshold parameter. For example., if you set the Extreme Threshold to 0.5 (50%) then if the wave's speed index is less than 50% of Average Speed Index it will be signified as F=Fast wave or if the wave's speed index is greater than 50% of the Average Speed Index it will be signified as S="Slow".
Версия 9.1 2022.12.08
New Improved Autowaves Algorithm.
You might need to adjust your Autosensitivity setting.
Версия 9.0 2022.11.25
Fixed out of range bug
Версия 8.9 2022.11.24
Improved Plutus Signals Algorithm
Версия 8.8 2022.11.18
Improved real volume loop calculations
Версия 8.7 2022.10.19
Code Improvements
Версия 8.6 2022.10.11
Improve Autowaves Algorithm
Версия 8.5 2022.10.07
Code Improvements
Версия 8.4 2022.10.06
Fixed disappearing labels.
Версия 8.3 2022.10.06
1. Added weighted average of Speed Index AvgWSI
2. Added weighted average of Speed Index of up waves uWSI
3. Added weighted average of Speed Index of dn waves dWSI
4. Code improvements
Версия 8.2 2022.09.23
Fix a small bug on High Volume Alert
Версия 8.1 2022.09.22
New feature
Added Wyckoff and Fake Break Signals.
Option to Display Avg Speed Index next to Speed Index
Keyboard Z button to refresh chart (needed for tick charts)
Версия 8.0 2022.06.17
Various Code Improvements
Версия 7.9 2022.03.08
Improved Speed Index Algorithm
Версия 7.8 2022.02.28
Fix deleting all objects when changing timeframe after last update.
Версия 7.7 2022.02.23
Display/Calculate or not Average SI
Версия 7.6 2022.02.23
Code optimization made it faster
Fixed Object delete
Fixed Array out of Range
Версия 7.5 2022.02.15
1. New Feature: Automatic Extreme Speed Index Alert for Slow and Fast Waves
2. Added different color for Plutus SIs
Версия 7.4 2021.11.18
empty array error fixed
Версия 7.3 2021.09.18
Code improvements om Speed Index Display
Версия 7.2 2021.05.13
Fixed an array issue
Версия 7.1 2021.04.28
Fix issue with Signal Alert
Removed Show Individual Signals
Версия 7.0 2021.04.23
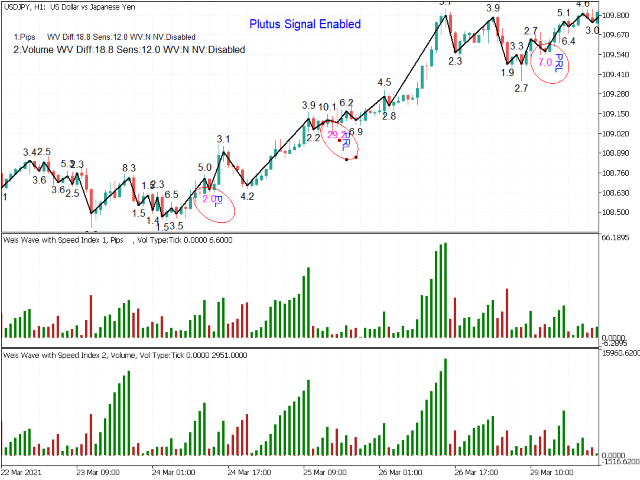
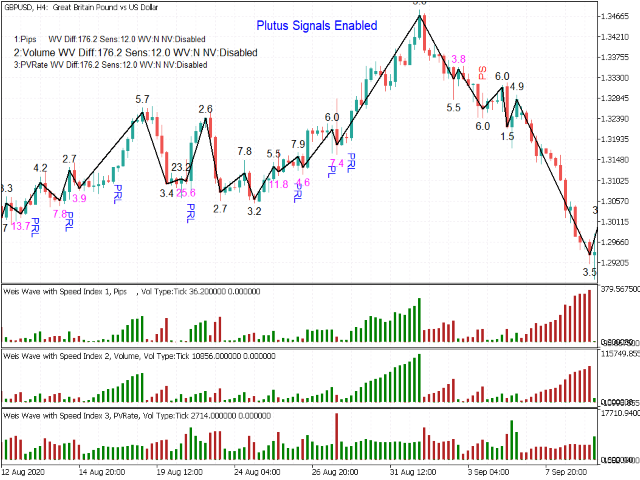
Plutus Patterns Signals added.These signals offer high probability Long and Short trades. No need to scan your charts for Plutus Patterns, just setup the alert and you are ready to get notified.
Recomended setting:
Show Plutus Signal=true
SI Ratio =2.0 (Speed Index Ratio)
Min Wave Bars = This is the total number of bars of both waves forming the pattern. I recommend 4 when trading the 1HR, 3 when trading higher TFs. The smaller TF you are trading the higher number.
Версия 6.0 2021.03.01
All In One
Choose what Wave Type you would like to display:
Regular Volume, Pips, Progressive Volume Rate, Time or Emphasized Volume Waves
Версия 5.3 2021.02.06
Code Improvement
Weight Volumed Algorithm Adjustment
Версия 5.2 2021.01.29
Multiple Indicators can be added to the same chart
Show your orders or not on the chart
New Net Volume wave calculation according to Price Median
New Volume Filter = Progressive Volume Rate
Версия 5.1 2020.12.18
Added Net Volume Waves option. Bulish Candle is considered a +volume and bearish Candlet is considered a -Volume.
The Net Volume Wave= Absolute(+volume-volume)
Версия 5.0 2020.09.23
Labelshift code improvement,you need to adjust your Labeshift start with value =0.5 or 1 ,
Added Volume and SI display together
Added SI Multiplier
Remove weighted volume on specific bars, weighted volume calculates all bars
Версия 4.9 2020.09.10
Updated SI Algorithm & changed indicator name
Версия 4.8 2020.09.07
Added Weighted Volume features!
Версия 4.7 2020.08.16
Added the option to Load All Bars or Specific Number of Bars
Weighted volume under development
Версия 4.6 2019.09.19
Adjusted Weighted Volume - added all bars weight-added DayLight Savings
Версия 4.5 2019.08.13
Updated Speed Index, Volume divider and Pip Divider
Версия 4.4 2019.07.18
Adjusted Autowaves
Версия 4.3 2019.07.15
Adjusted Autowaves Algorithm
Версия 4.1 2019.06.02
Added display of AutoSensitivity parameter on chart
Версия 4.0 2019.05.28
1. ****NEW Auto Volume Waves ****

AutoDifference: true/false - Neglects the Wave Direction difference and adjusts the Difference automatically creating more accurate waves.
AutoSensitivity: The higher the number the higher the sensitivity and therefore more waves are formed.
Format Parameters for Auto Difference value displayed on chart as "WV Difference:xx" (Corner, Y offset, X offset, Font, Font Size)

2. Adjusted Label Shift

Версия 3.2 2019.03.31
Added parameters for Speed Index color and Speed Index Alerts color
Версия 3.1 2019.03.21
Pip display adjustment.
Версия 3.0 2019.03.21
Added Advanced Volume Filter that emphasizes on significant volume waves.
Версия 2.0 2019.02.03
Major Update:
New functions added to the indicator
1. PipDivBy: Pips divider in order to avoid big numbers on the display
2. Ability to choose which labels to display: 1 - Volume, 2 -Pips, 3 -Bars, 4- ALL, 5- Volume and Pips

New Speed Index Display and Alert
Speed Index= Wave Volume/Pip Distance - which means how much volume was needed to move 1 pip. The smaller the number is the faster the wave is. The larger the number is the slower the wave is.

Alert functionality has been added if speed index is above a certain value and/or below a certain value.


Push Notification has been added on both Volume and Speed Index