Weiss Wave with Zigzag and several data
- Индикаторы
- Ricardo Rodrigues Lucca
- Версия: 2.0
- Обновлено: 16 октября 2021
- Активации: 20
Weiss Wave with lots of functionality and lightweight. The same can be used both in markets that have access to volume (REAL=Contracts, Tick=Business) or points!
You will be able to:
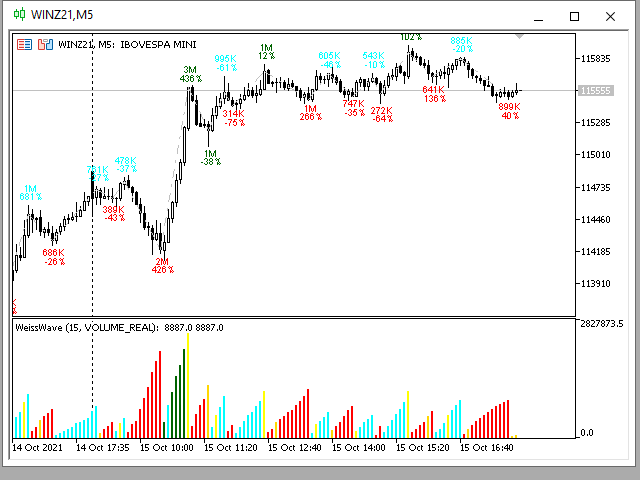
- Analyze the volume of the market by swings made!
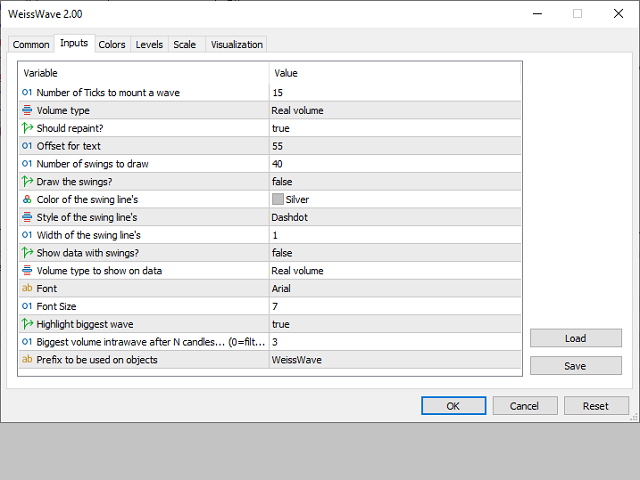
- Define the source of the data presented in the graphic, its size and color! Or simply hide this information!
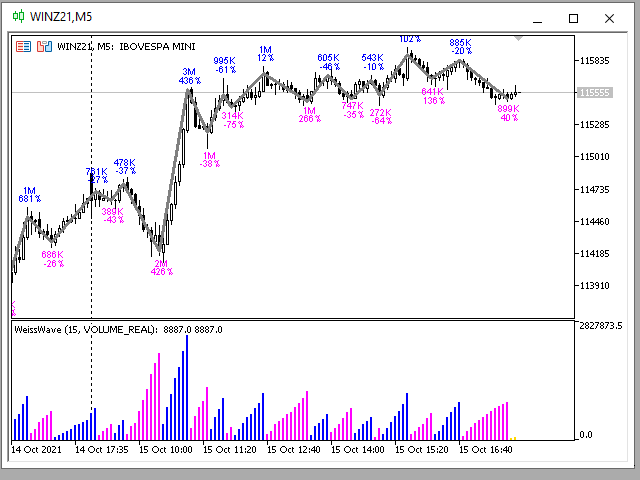
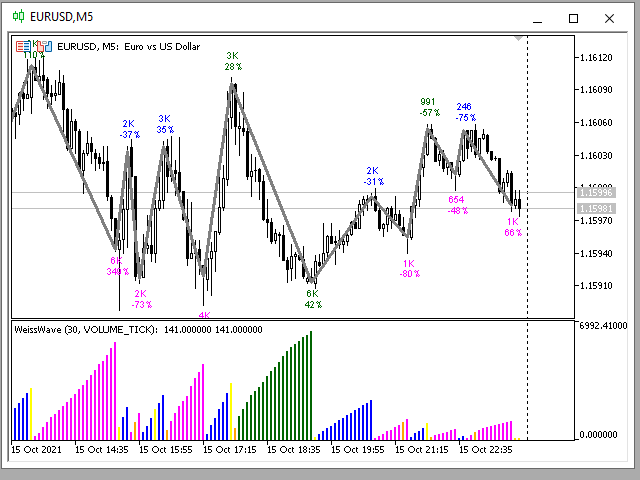
- Define whether or not to show the swings in the graph and how many swings! In addition to setting the trend line color, thickness and trend line style!
The data shown in the chart when enabled are:
- Volume or points (according to configuration);
- Growth percentage in relation to the previous wave of the same type;
- Wave pontuation achieved from one close to the next!


