Версия 2.6
2023.12.06
- Bug fix -
Версия 2.5
2023.12.06
*** Please always make a backup of the existing indicator (the .ex5 file) before you make an update ***
Change log:
- bug fix in the MA trend filter. Did not work when time frame was set to something else than 'current'.
- added the option to set Strice mode for scanning double tops/bottoms (not supported in triple scanning mode). If enabled then ZigZag logic will be used.
- new additional input for symbols.
- the indicator can now draw the Moving average (if time frame set to 'current') and RSI indicators on the chart if any of these filters have been enabled.
Версия 2.4
2023.11.24
*** Please always make a backup of the existing indicator (the .ex5 file) before you make an update ***
Change log:
- bug fix in the arrow drawing. The arrow was drawn one candle to early when value in the 'Wait for candle close for alert (neckline only)' input was set to False
- added a moving average (MA) trend filter
Версия 2.3
2023.11.16
*** Please always make a backup of the existing indicator (the .ex5 file) before you make an update ***
Change log:
- bug fix for the panel which in some cases got minimized
- added an option to write the signals as global variables instead of to a file (to be used by an EA)
- added the possibility to change MACD, Stochastics, CCI, RSI, RVI, ATR, MFI and Momentum settings for the divergence filter
Версия 2.2
2022.07.26
- bug fix
Версия 2.1
2022.07.14
*** Please always make a backup of the existing indicator (the .ex5 file) before you make an update ***
- bug fix regarding line colors for double top/bottoms
Версия 2.0
2021.12.28
*** Please always make a backup of the existing indicator (the .ex5 file) before you make an update ***
- minor improvements
Версия 1.9
2021.12.15
*** Please always make a backup of the existing indicator (the .ex5 file) before you make an update ***
- add a possibility to select color for lines and other objects
- added drawing of a breakout arrow when in neckline breakout mode (confirmed top/bottom)
- added the possibilty set set the maximum amount of bars to wait for a neckline breakout
Версия 1.8
2021.12.09
*** Please always make a backup of the existing indicator (the .ex5 file) before you make an update ***
- added the possibility to use the indicator in single chart mode (checking only one symbol and time frame). It will then draw the top/bottom on the chart where the indicator is running. This option is in some ways limited though. More information in the product's blog.
- added engulfing, tweezer and morning/evening star candle patterns filters as additional options to the existing pin bar filter.
Версия 1.7
2021.11.30
*** Please always make a backup of the existing indicator (the .ex5 file) before you make an update ***
This update is only recommended if you are using the divergence filter
- added another 9 divergence indicators/oscillators to select from
- added the option to set minimum amout of bars for a divergence
Версия 1.6
2021.11.26
*** Please always make a backup of the existing indicator (the .ex5 file) before you make an update ***
- corrected another bug regarding the detection of divergences
- added OsMA divergence
Версия 1.5
2021.11.23
*** Please always make a backup of the existing indicator (the .ex5 file) before you make an update ***
- corrected a bug regarding the detection of divergences
- added the possibility to enable ADX filter
Версия 1.4
2021.10.03
*** Please always make a backup of the existing indicator (the .ex5 file) before you make an update ***
- added the possibility to use the ATR indicator instead of points for calculating the offset
- added the possibility to add a custom text to the pop-up, push and mail alerts
- added the possibility to set a custom panel title
Версия 1.3
2019.11.27
- added support for this Expert Advisor: https://www.mql5.com/en/market/product/43820
- added an option to set how many candles must be lower/higher prior to the first extremum candle (first top/bottom)
- added an option to decide the position of the neckline candle in order to get it more to the middle (between the 2 extremum candles). Using this option will make it a more clear U/V formation for those who desires that for their trading strategy
Версия 1.2
2019.08.28
- corrected an error with incorrect drawing of lines in the strategy tester
Версия 1.1
2019.01.15
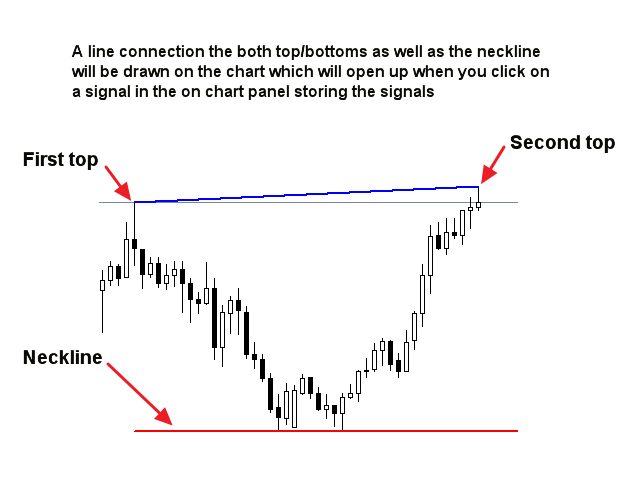
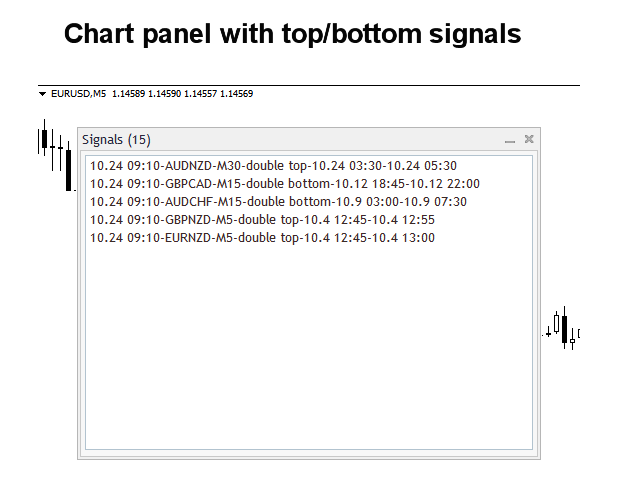
- a line between the 2 extremums as weel as the neckline will now automatically be drawn on the chart which opens up when a signal is clicked on in the panel














Amazing work Jan. I totally recommend this indicator.