• Обзор
  • Отзывы
  • Обсуждение (2)
  • Что нового

Volume Spread Pattern Indicator MT5

Introduction

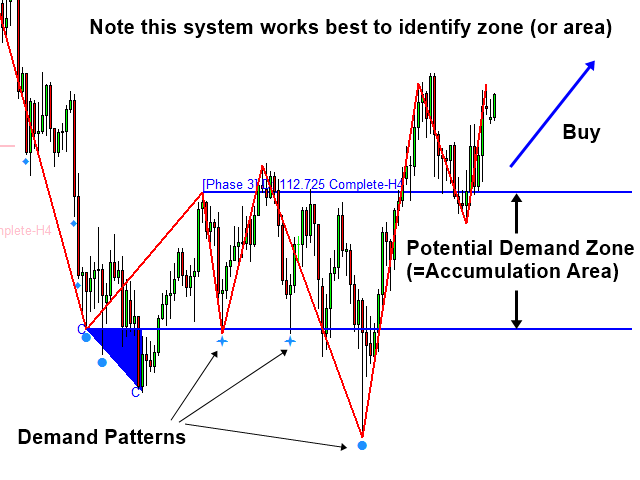
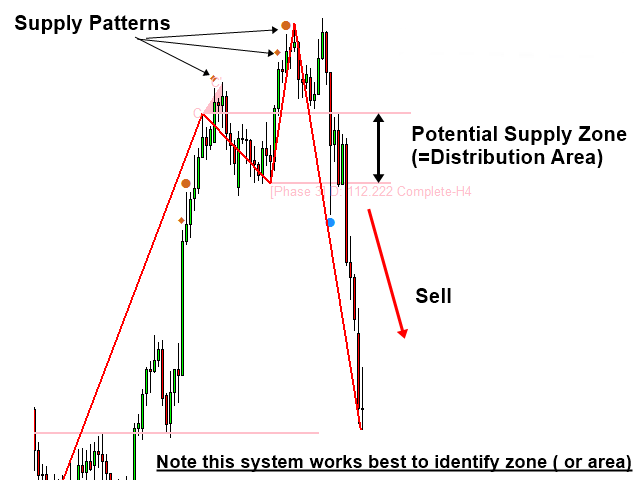
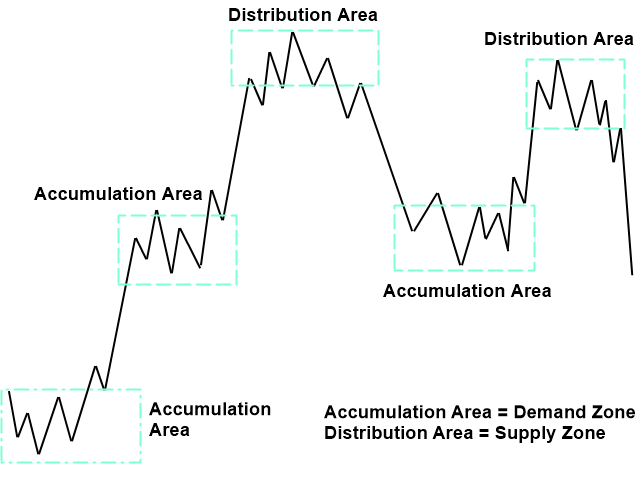
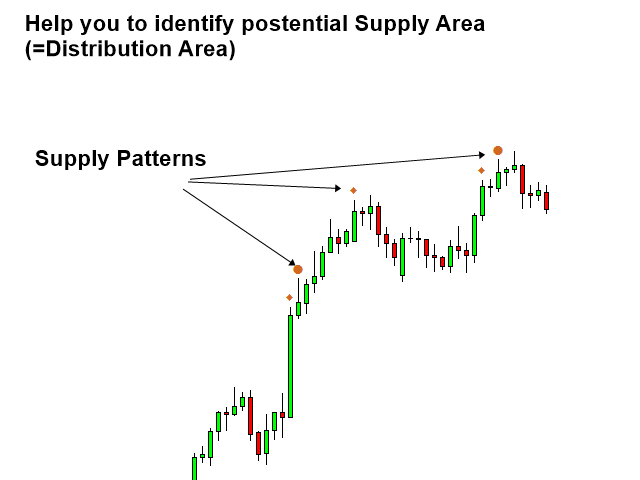
This indicator detects volume spread patterns for buy and sell opportunity. The patterns include demand and supply patterns. You might use each pattern for trading. However, these patterns are best used to detect the demand zone (=accumulation area) and supply zone (=distribution area). Demand pattern indicates generally potential buying opportunity. Supply pattern indicates generally potential selling opportunity. These are the underlying patterns rather than direct price action. The effect of buy and sell market may come after observing several of these patterns sometimes. Therefore, these patterns are useful in detecting possible demand zone (=accumulation area) or supply zone (=distribution area). In overall this is easy and simple indicator to support your trading operation. Trading principle is based on the modified volume spread analysis. We do not use sub phase A, B, C, D and E of Wyckoff phases due to the high subjectivity in detecting them. Instead, we focus on identifying accumulation and distribution area using demand and supply patterns. This is simpler and more effective approach.


Input Recommendation

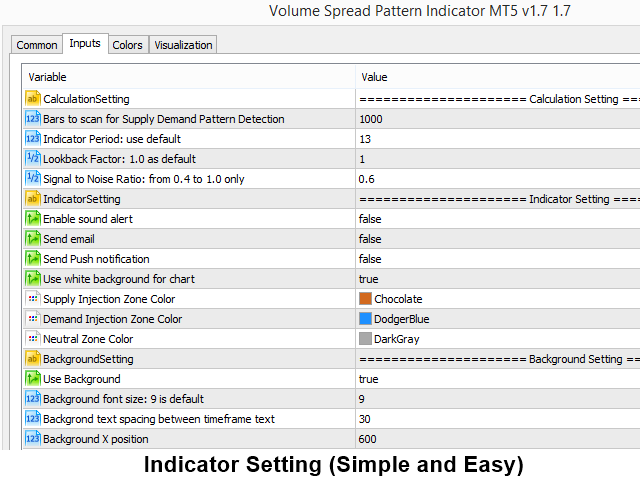
Most of time you can use default setting for this volume Spread Indicator. However, you might want to tweak around to use for your specific needs. Here is the complete description of input settings.


Calculation Settings

  • Bars to scan: Amount of bars to calculate demand and supply pattern.
  • Indicator Period: Calculation period to generate each supply and demand patterns.
  • Lookback Factor: 1.0 as default
  • Signal to Noise Ratio: from 0.4 to 1.0 only. (Input used to filter random fluctuations in data.)


Indicator Setting

  • Enable sound alert: Sound alert for patter detection. (true or false only)
  • Send email: Email notification for pattern detection. (true or false only)
  • Send Push notification: push notification for pattern detection (true or false only)
  • Use white background for chart: Set this to false if you just want to use default black background color.
  • Supply Pattern Color: color of supply patterns.
  • Demand Pattern Color: color of demand patterns
  • Neutral Pattern Color: color of neural patterns or no patterns.


Background settings

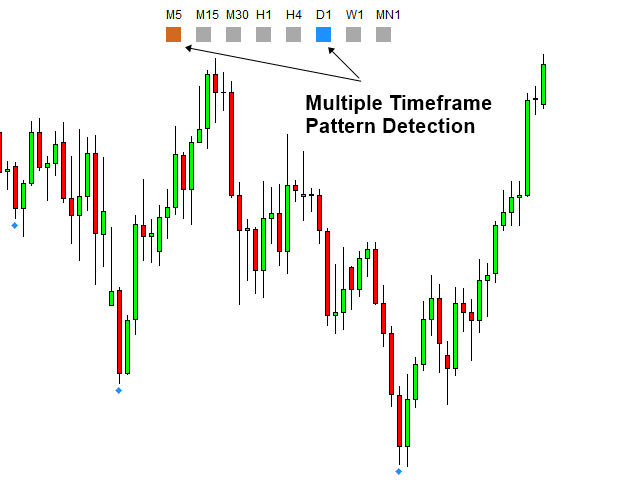
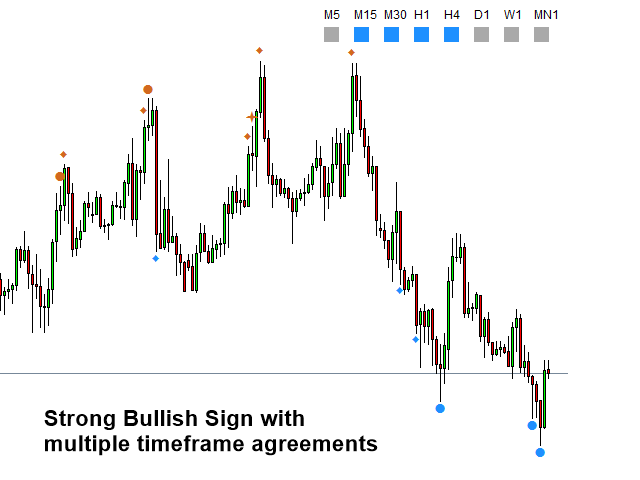
Background refers to the multiple timeframe pattern detection of supply and demand patterns. In this setting, you can control which timeframe patterns you want to use together in your chart for your decision-making. These inputs are mostly for graphic panel. Depending on which screen size you are using, you might have to change these inputs.


  • Use Background: true or false to switch on and off multiple timeframe pattern detection.
  • Background font size: 9 is default
  • Background text spacing between timeframe text
  • Background X position: staring position X of Background panel
  • Background Y position: staring position Y of Background panel
  • Background rectangle size (it is square always): Size of rectangle
  • Background rectangle distance from timeframe text: distance between text and rectangle
  •    

Trading Strategy Guide 

Volume Spread Pattern Indicator can run best to identify Demand zone (=accumulation area) and supply zone (=distribution area). When you run with Excessive Momentum Indicator, C point of Excessive Momentum become the selling climax (SC) or the buying climax (BC). Then you will use demand and supply patterns to confirm the accumulation area and distribution area for your trading. Both short term and long term trading is possible. Please check the trading stragey guide below:

Strategy Guide: https://www.mql5.com/en/blogs/post/750390


Important Note

This is the off the shelf product. Therefore, we do not accept any modification or customization request on this product. In addition, we do not provide any code library or any support for your coding for this product.


Рекомендуем также
Этот индикатор представляет собой идеальный индикатор волнового автоматического анализа для практической торговли! Стандартизированное определение диапазона больше не является волной для разных людей, и рисунок антропогенных помех устранен, что играет ключевую роль в строгом анализе подхода. =》Increase the choice of international style mode, (red fall green rise style)           На данный момент при покупке со скидкой!   Содержание индекса: 1.       Базовая волна:   Сначала мы нашли точ
Oneiroi
Oleksandr Powchan
5 (1)
Oneiroi trades hard oversold and overbought conditions. On M15 you can achieve a very high hitrate. The system does not trade a lot because meeting the three conditions is quite hard. It will work on any pair and any broker but some are better than others. The EA will work also on small accounts but i would highly recomend to use a 100kcent account. Our Goal is to help you be way more profitable and way more stress free, so you can enjoy the things that are important to you and your fa
Индикатор Urgently создан для быстрого определения ситуации на рынке, отражает состояние рынка и сигнализирует о выгодных уровнях для открытия сделок. Рыночные условия меняются достаточно быстро, требуя постоянной калибровки торговых стратегий. Рекомендуется использовать совместно с любым из осцилляторов. Трендовый индикатор рынка форекс Urgently показывает направление тренда и точки входа. Он сглаживет колебания цены при формирования сигнала путем усреднения данных и сигнала только в определен
XFlow показывает расширяющийся ценовой канал помогающий определять тренд и моменты его разворота. Используется также при сопровождении сделок для установки тейк-профит/стоп-лосс и усреднений. Практически не имеет параметров и очень прост в использовании - просто укажите важный для вас момент истории и индикатор рассчитает ценовой канал. ОТОБРАЖАЕМЫЕ ЛИНИИ ROTATE - толстая сплошная линия. Центр общего вращения цены. Цена делает широкие циклические движения вокруг линии ROTATE. Положение цены око
Volume Trade Levels
Mahmoud Sabry Mohamed Youssef
The idea behind this indicator is very simple , First it contains 2 mechanisms to place your trades: 1- Enter the Pips you want to duplicate to price levels. 2- Automatically let the indicator specify the largest Buy / Sell Volume Candle and place duplicated levels based on the candle itself. How it works: 1- Enter the Pips you want to duplicate to price levels:    1- once the indicator is loaded you will need first to Specify the number of pips in the indicator Configuration window ,you can
This Indicator adding power to traditional zigzag indicator. With High-Low numbers in vision it will be easier to estimate change of trend by knowing the depth of each wave. Information including points, pips, percentage%, and #bars can be displayed based on configuration. All information is real-time update. This indicator is especially useful in sideway market to buy low sell high.
Disclaimer : Keep in mind that seasonal patterns are not always reliable. Therefore, thoughtful risk management is crucial to minimize losses.  Seasonal patterns in the financial world are like a well-guarded secret that successful investors use to their advantage. These patterns are recurring price movements that occur during specific periods or around special events. Additionally, there are also intraday patterns that repeat. For example, Uncle Ted from Forex Family suggests examining previou
General Description In the simplest terms this is a contrarian intra-day scalping system. Built to try and let correct trades run as far as possible and flip the trade when indicated. The indicator looks at historical daily trading ranges to lay out levels at which it takes long and short positions based on the statistical levels. The indicator is built around index futures, mainly around S&P and the DOW but can be used an any futures contract mainly using AMP Futures to trade. The indicator is
Session Control индикатор сессий. В зависимости от того, с какого континента в определённый период происходит активность торгов, и подразделяют весь дневной распорядок на несколько торговых сессий. За счет того, что в каждый отдельный промежуток времени к торговому процессу подключаются биржевые и банковские площадки с разных уголков планеты и заключается круглосуточное функционирование рынка Форекс.  Существует 4 основных торговых сессий:  Тихоокеанская. Европейская. Американская. Азиатс
Elevate Your Trading Experience with the famous UT Bot Alert Indicator! Summary: The UT Bot Alert Indicator by Quant Nomad has a proven track record and is your gateway to a more profitable trading journey. It's a meticulously crafted tool designed to provide precision, real-time insights, and a user-friendly experience.  Key Features: 1. Precision Analysis: Powered by advanced algorithms for accurate trend identification, pinpointing critical support and resistance levels. 2. Real-time Ale
ИНДИКАТОР, основанный на ИСКУССТВЕННОМ ИНТЕЛЛЕКТЕ, который генерирует возможные записи колл- и пут-опционов для бинарных опционов. Индикатор работает по 3 разным стратегиям: 1) считывая объемы, он посылает сигнал, когда цена должна развернуться 2) через расхождение между ценой и объемом он посылает сигнал, когда тренд должен продолжиться или развернуться. 3) благодаря сближению цены и объема он посылает сигнал о том, что тренд должен продолжиться. Индикатор работает на всех таймфр
This indicator simplifies your entry zones by displaying the areas where you can plan your entry that potentially could give you high risk/reward ratios. Other than picking the most optimal entry points, the Hot Zone indicator can act as your typical support/resistance indicator for pullbacks for all timeframes. You can use this indicator as the only trading indicator or use it with another indicator for reentry purposes.  Besides, when using Hot Zones, the risk/reward ratio should be well abov
Интеллектуальный алгоритм индикатора Godfather с точностью определяет тренд, отфильтровывает рыночный шум и генерирует входные сигналы и уровни выхода. Индикатор поможет в поиске точек входа при анализе графика цены. Программа сначала получает «снимок» графика, затем анализирует его. Результаты сообщаются трейдеру в виде сигналов. Основная цель данного индикатора это определение моментов входов и выходов из сделок, поэтому индикатор отображает только линию тренда и точки входа, тоесть отображае
A useful scanner/dashboard that shows the RSI values for multiple symbols and Time-frames. It can be easily hidden/displayed with a simple click on the scanner man top left of the dashboard. You can input upper and lower RSI values and the colours can be set to show when above/below these values. The default values are 70 and 30. There are also input colours for when the RSI is above or below 50 (but not exceeding the upper/lower levels Symbols and time-frames are input separated by commas.
Sam TrendBlaster for MT5
AKILA THILINDA JAYARATHNA RANASINGHEGE
5 (1)
***** This is an indicator for MT5 providing accurate arrow signals without repainting. ***** Trade With Sam Simple Strategy Guide :  https://www.mql5.com/en/blogs/post/740855 MT4 version of the indicator Try Out and see the Difference The Sam's Trend Blaster indicator tracks the market trend with an unmatched reliability, by ignoring sudden fluctuations and market noise. It has been designed to trend-trade intraday charts and small timeframes. Its winning ratio is around 85%. This is a
Hello Seasonal Traders! The seasonality trading strategy works because the smart money is doing the same thing every single year more often than not. The month of the year or the day of the week and the time of the day can call the shots in any market.   The seasonal cycle is another useful tool in your trading arsenal. I'm not saying to trade solely off of seasonality and forget anything else. I'm only giving you another trading tool that you can incorporate into your own trading strategy to ga
The indicator determines a special pattern of Joe Dinapoli. It gives very high probability buy and sell signals. Indicator does not repaint. Indicator Usage Buy Signal ''B'' Entry : Market buy order at signal bar close Stop : Low of signal bar Take Profit : First swing high Sell Signal ''S'' Entry : Market sell order at signal bar close Stop : High of signal bar Take Profit : First swing low Indicator Parameters Fast EMA : External Parameter (should be kept as default) Slow EMA: External Param
Автоматическая система, которая определяет сигналы на вход по ценовому действию. Также устанавливает на определенном расстоянии от этого ордера другой стоп-ордер, противоположный сигналу на вход. Принцип работы советника Cobalto основан на волатильности рынка - он ищет сильные движения для покупки и продажи. Система предназначена для работы на ECN-счетах с плечом 1:300. Параметры Lot_Management - управление лотом Initial_lot: начальный размер лота для открытия первого ордера. (Размер следующих
Fibonacci and RSI. Demo versión only works with GBPUSD. For full version, please, visit visit https://www.mql5.com/en/market/product/52101 The indicator is a combination of the Fibonacci and RSI indicators. Every time the price touches one of the fibonacci levels and the rsi condition is met, an audible alert and a text alert are generated. Parameters number_of_candles : It is the number of candles that will be calculated. If you put 100, the indicator will give you the maximum and min
FREE
"Pattern 123" это индикатор-торговая система, построенная на популярной закономерности, паттерне 123. Это момент, когда мы ожидаем разворот на старшем тренде и входим в продолжение малого тренда, в его 3-й импульс. Индикатор отображает сигналы и разметку на открытом графике. В настройках можно включать/отключать графические построения. Индикатор имеет встроенную систему оповещений   (электронная почта, мобильный терминал, стандартный алерт терминала). У "Pattern 123" есть таблица,  котор
Tyr Bands XAU
Gerardo Armando Ochoa Aguilera
Tyr Bands Indicator (IC MARKETS GOLD). Just drag and drop. This indicators gets you entry points for the market. it is for gold, but you can configure for any other currency. Tyr Band works with BB and 3 different deviations, plus the Stochastic confirmation. So when the price closes below/above the BB Reversal Band (Red) and the Stochcastic is in the confirmation zone, then the arrow (buy/sell) appears. This arrow indicates that we can entry to the market up/down on the next opening. Since it i
FREE
Configure scaffolding charts and signals based on the scissor pattern, which works great at low times. Buy and sell signs based on 2 previous candle patterns It works on the active time form, and when detecting the pattern in 4 time frames, 5 minutes, 15 minutes, 30 minutes and one hour, the alert can be set to notify us of the formation of this pattern. MetaTrader version 4 click here How to use: When there is an opportunity to buy or sell, the marker places a scissors mark on
Harmonic Pro
Kambiz Shahriarynasab
Only 5 copies of the EA at $30! Next price --> $45 Find charts and signals based on harmonic patterns, which work great in 1-hour timeframes and up. Buy and sell signs based on different harmonic patterns as follows: 0: ABC_D 1: ABCD_E 2: 3Drive 3: 5_0 4: Gartley 5: Bat 6: Crab 7: Butterfly 8: Cypher 9: NenStar 10: Shark 11: AntiBat 12: AntiGartley 13: AntiCrab 14: AntiButterfly 15: AntiCypher 16: AntiNenStar 17: AntiShark How to use: When there is an opportunity to
"Hunttern harmonic pattern finder" base on the dynamic zigzag with the notification and prediction mode This version of the indicator identifies 11 harmonic patterns and predicts them in real-time before they are completely formed. It offers the ability to calculate the error rate of Zigzag patterns depending on a risk threshold. It moreover sends out a notification once the pattern is complete. The supported patterns: ABCD BAT ALT BAT BUTTERFLY GARTLEY CRAB DEEP CRAB CYPHER SHARK THREE
The Volume by Price Indicator for MetaTrader 5 features Volume Profile and Market Profile TPO (Time Price Opportunity). Volume and TPO histogram bar and line charts. Volume Footprint charts. TPO letter and block marker collapsed and split structure charts. Static, dynamic and flexible range segmentation and compositing methods with relative and absolute visualizations. Session hours filtering and segment concatenation with Market Watch and custom user specifications. Graphical layering, positio
Adjustable Consecutive Fractals  looks for 2 or more fractals in one direction and sends out a on screen alert, sound alert and push notification, for strong reversal points . Adjustable Consecutive Fractals, shows the fractals on chart along with a color changing text for buy and sell signals when one or more fractals appear on one side of price. Adjustable Consecutive Fractals is based Bill Williams Fractals . The standard Bill Williams fractals are set at a non adjustable 5 bars, BUT withe
This product is designed for the MT5 platform and offers two key features: VWAP (Volume Weighted Average Price) calculation and Volume Profile analysis. Advantages: VWAP Calculation: The product calculates the VWAP, which is a popular indicator used by traders to determine the average price of a security based on its trading volume. It helps identify potential buying or selling opportunities by comparing the current price to the average price weighted by volume. Volume Profile Analysis: The prod
Koala Engulf Pattern
Ashkan Hazegh Nikrou
3 (1)
Тарифный план Koala Engulf Pattern     Шаг 1: Бесплатно для первых 20 загрузок.     Шаг 2: Аренда 10 $ / год для следующих 20 загрузок.     Шаг 3: Аренда 20 $ / год для следующих 20 загрузок.     Step4; Закупочная цена за пожизненное использование для следующих 100 загрузок 39 $.     Шаг 5: Окончательная пожизненная цена этого продукта составляет 99 $. Введение в шаблон "Поглощение коалы"     Профессиональный индикатор MT5 для обнаружения паттерна поглощения Price Action.     Полез
By using (MOMENTUM and VELOCITY and ACCELLERATION) and the power of machine learning we can accurately calculate the current strength of the currencies of each time frame. - It's really easy to use: Choosing to trade between currency pairs that have clear and dominant trends will give you a great advantage. -The currency pair strength meter is rated from -100 to + 100
My PVSR
Ashok Kumar Singha
My PVSR   is based on All Type of Pivot Points. Use this Indicator to get proper Support / Resistance Zone and Trade accordingly.. Recommendation: Use this Indicator along with my another Indicator --->>> Dr. Trend   <<<--- Click Here ; To get the best output result feel free to contact me ; Best of Luck It can be used for: All Pairs: Forex, Cryptocurrencies, Metals, Stocks, Indices etc. All Timeframe All Brokers All type of Trading Style like Scalping, Swing, Intraday, Short-Term, Lon
С этим продуктом покупают
TPSpro TREND PRO   —  трендовый индикатор, который автоматически анализирует рынок и предоставляет информацию о тренде и каждой его смене а также дающий сигналы для входа в сделки без перерисовки! Индикатор использует каждую свечу, анализируя их отдельно. относя к разным импульсам – импульс вверх или вниз. Точные точки входа в сделки  для  валют, крипты, металлов, акций, индексов! Version MT4                ПОЛНОЕ ОПИСАНИЕ ИНДИКАТОРА          Рекомендуем использовать с  индикатором -  RFI LEVE
Важным ключевым элементом в трейдинге являются зоны или уровни, от которых принимаются решения о покупке или продаже торгового инструмента. Несмотря на попытки крупных игроков скрыть свое присутствие на рынке, они неизбежно оставляют следы. Наша задача заключалась в том, чтобы научиться находить эти следы и правильно их интерпретировать. INSTRUCTIONS     RUS   -    ENG                    Рекомендуем использовать с индикатором -   TPSpro  TREND PRO -  Version MT4 Основные функции: Отображения а
Представляем   Quantum TrendPulse   , совершенный торговый инструмент, который объединяет мощь   SuperTrend   ,   RSI   и   Stochastic   в один комплексный индикатор, чтобы максимизировать ваш торговый потенциал. Разработанный для трейдеров, которые ищут точность и эффективность, этот индикатор помогает вам уверенно определять рыночные тренды, сдвиги импульса и оптимальные точки входа и выхода. Основные характеристики: Интеграция SuperTrend:   легко следуйте преобладающим рыночным тенденциям и п
FX Levels - это исключительно точный индикатор поддержки и сопротивления, объединяющий традиционный метод Lighthouse с инновационным динамическим подходом и безупречно работающий на всех торговых инструментах. Это касается и валютных пар, и индексов, и акций, и сырьевых товаров. FX Levels определяет точки разворота и отображает их на графике, которые могут быть идеально использованы в качестве целей прибыли в вашей торговой деятельности. При разработке FX Levels мы использовали наш богатый опыт
Эта панель показывает последние доступные   гармонические паттерны   для выбранных символов, так что вы сэкономите время и будете более эффективны /   MT4 версия . Бесплатный индикатор:   Basic Harmonic Pattern Колонки индикатора Symbol:   отображаются выбранные символы Trend   :   бычий или медвежий Pattern   :   тип паттерна (Гартли, бабочка, летучая мышь, краб, акула, шифр или ABCD) Entry   :   цена входа SL:   цена стоп-лосса TP1:   цена первого тейк-профита TP2:   цена второго тейк-про
Прежде всего стоит подчеркнуть, что этот торговый индикатор не перерисовывается, не перерисовывает и не отставает, что делает его идеальным как для ручной, так и для роботизированной торговли. Руководство пользователя: настройки, вводы и стратегия. Атомный аналитик - это индикатор ценового действия PA, который использует силу и импульс цены, чтобы найти лучший край на рынке. Оборудованный расширенными фильтрами, которые помогают убирать шумы и ложные сигналы, и повышают торговый потенциал. Испо
Прежде всего стоит подчеркнуть, что эта торговая система является индикатором без перерисовки, без повторной отрисовки и без задержки, что делает ее идеальной как для ручной, так и для роботизированной торговли. Онлайн курс, руководство и загрузка пресетов. «Smart Trend Trading System MT5» - это комплексное торговое решение, созданное для новичков и опытных трейдеров. Он объединяет более 10 премиальных индикаторов и предлагает более 7 надежных торговых стратегий, что делает его универсальным
Получайте ежедневную информацию о рынке с подробностями и скриншотами через наш утренний брифинг здесь, на mql5 , и в Telegram ! FX Power MT5 NG - это новое поколение нашего популярного измерителя силы валют FX Power. Что же предлагает этот измеритель силы нового поколения? Все, что вы любили в оригинальном FX Power ПЛЮС Анализ силы GOLD/XAU Еще более точные результаты расчетов Индивидуально настраиваемые периоды анализа Настраиваемый предел расчета для еще более высокой производительности Спец
FX Volume MT5
Daniel Stein
4.93 (14)
Получайте ежедневную информацию о рынке с подробностями и скриншотами в нашем утреннем брифинге здесь, на mql5 , и в Telegram ! FX Volume - это ПЕРВЫЙ и ЕДИНСТВЕННЫЙ индикатор объема, который дает РЕАЛЬНОЕ представление о настроении рынка с точки зрения брокера. Он дает потрясающее представление о том, как институциональные участники рынка, такие как брокеры, позиционируют себя на рынке Forex, гораздо быстрее, чем отчеты COT. Видеть эту информацию прямо на своем графике - это настоящий геймчей
Представляем Золотой Блиц Скальпинг Индикатор, идеальный инструмент для скальпинга золота на временных интервалах M1, M5 и M15. Разработанный с использованием передовых нейронных сетей AI, этот индикатор без перерисовки гарантирует постоянную прибыльность и превосходные торговые результаты. Оптимизирован для точности и эффективности, Золотой Блиц Скальпинг Индикатор дает лучшие результаты на временном интервале M15. Основные функции: Передовые нейронные сети AI: Используйте возможности перед
Представляем       Quantum Breakout PRO   , новаторский индикатор MQL5, который меняет ваш способ торговли в зонах прорыва! Разработан командой опытных трейдеров со стажем торговли более 13 лет,       Квантовый прорыв PRO       разработан, чтобы поднять ваше торговое путешествие к новым высотам с его инновационной и динамичной стратегией зоны прорыва. Quantum Breakout Indicator покажет вам сигнальные стрелки на зонах прорыва с 5 целевыми зонами прибыли и предложением стоп-лосса на основе по
Свинг-трейдинг - это первый индикатор, предназначенный для обнаружения колебаний в направлении тренда и возможных разворотов. Он использует базовый подход свинговой торговли, широко описанный в торговой литературе. Индикатор изучает несколько векторов цен и времени для отслеживания направления совокупного тренда и выявляет ситуации, когда рынок перепродан или перекуплен и готов к исправлению. [ Руководство по установке | Руководство по обновлению | Устранение неполадок | FAQ | Все продукты ]
Топовый индикатор МТ5, дающий сигналы для входа в сделки без перерисовки! Идеальные точки входа в сделки для  валют, крипты, металлов, акций, индексов !  Смотрите  видео  (6:22) с примером отработки всего одного сигнала, окупившего индикатор. Версия индикатора для MT4 Преимущества индикатора Сигналы на вход без перерисовки Если сигнал появился, он никуда НЕ исчезает! В отличие от индикаторов с перерисовкой, которые ведут к потере депозита, потому что могут показать сигнал, а потом убрать его.
Лучшее решение для новичка или трейдера-эксперта! Этот индикатор является уникальным, высококачественным и доступным торговым инструментом, поскольку мы включили в него ряд собственных функций и новую формулу. С помощью всего лишь ОДНОГО графика вы можете определить силу валюты для 28 пар Форекс! Представьте, как улучшится ваша торговля, потому что вы сможете точно определить точку запуска нового тренда или возможность скальпирования? Руководство пользователя:   нажмите здесь Это первый,
The AT Forex Indicator MT5 is a sophisticated trading tool designed to provide traders with a comprehensive analysis of multiple currency pairs. This powerful indicator simplifies the complex nature of the forex market, making it accessible for both novice and experienced traders. AT Forex Indicator uses advanced algorithms to detect trends, patterns and is an essential tool for traders aiming to enhance their forex trading performance. With its robust features, ease of use, and reliable signal
Сейчас 147 долл. США (увеличиваясь до 499 долл. США после нескольких обновлений) - неограниченные учетные записи (ПК или Mac) Руководство пользователя + Обучающие видео + Доступ к приватному Discord-каналу + VIP-статус и мобильная версия + Лицензия на 5 ПК с неограниченным количеством аккаунтов и терминалов MT4. Сколько раз вы покупали индикатор торговли с замечательными обратными тестами, доказательствами производительности на живых счетах и зашикарными цифрами и статистикой, но после испо
Индикатор Supply Demand использует предыдущее ценовое действие для выявления потенциального дисбаланса между покупателями и продавцами. Ключевым является определение зон с лучшими возможностями, а не просто вероятностей. Индикатор Blahtech Supply Demand обеспечивает функционал, не доступный ни в одной платформе. Этот индикатор 4 в 1 не только выделяет зоны с более высокой вероятностью на основе механизма оценки силы по множественным критериям, но также комбинирует его с мульти-таймфреймовым ана
Это, пожалуй, самый полный индикатор автоматического распознавания гармонического ценообразования, который вы можете найти для платформы MetaTrader. Он обнаруживает 19 различных паттернов, воспринимает проекции Фибоначчи так же серьезно, как и вы, отображает зону потенциального разворота (PRZ) и находит подходящие уровни стоп-лосс и тейк-профит. [ Руководство по установке | Руководство по обновлению | Устранение неполадок | FAQ | Все продукты ] Он обнаруживает 19 различных гармонических цен
Quantum Trend Sniper
Bogdan Ion Puscasu
4.71 (49)
Представляем       Индикатор Quantum Trend Sniper   , инновационный индикатор MQL5, который меняет способ определения разворотов тренда и торговли ими! Разработан командой опытных трейдеров со стажем торговли более 13 лет,       Снайперский индикатор Quantum Trend       разработан, чтобы вывести ваше торговое путешествие на новые высоты благодаря инновационному способу определения разворотов тренда с чрезвычайно высокой точностью. ***Купите индикатор Quantum Trend Sniper и получите индикатор
This indicator belongs to the family of channel indicators. These channel indicator was created based on the principle that the market will always trade in a swinging like pattern. The swinging like pattern is caused by the existence of both the bulls and bears in a market. This causes a market to trade in a dynamic channel. it is designed to help the buyer to identify the levels at which the bulls are buying and the bear are selling. The bulls are buying when the Market is cheap and the bears a
Профиль Рынка (Market Profile) определяет ряд типов дней, которые помогают трейдеру распознать поведение рынка. Ключевая особенность - это область значений (Value Area), представляющая диапазон ценового действия, в котором произошло 70% торговли. Понимание области значений может помочь трейдерам вникнуть в направление рынка и установить торговлю с более высокими шансами на успех. Это отличное дополнение к любой системе, которую вы возможно используете. Blahtech Limited представляет сообществу Me
Gold TMAF MTF – это лучший биржевой технический индикатор. Алгоритм индикатора анализирует движение цены актива и отражает волатильность и потенциальные зоны для входа.   Самые лучшие сигналы индикатора: Для SELL = красная верхняя граница TMA2 выше красной верхней границы TMA1 + красный указатель фрактала сверху + желтая сигнальная стрелка SR в этом же направлении. Для BUY = синяя нижняя граница TMA2 ниже синей нижней границы TMA1 + синий указатель фрактала снизу + аква сигнальная стрелка SR в
TPA True Price Action indicator reveals the true price action of the market makers through 100% non-repainting signals strictly at the close of a candle! TPA shows entries and re-entries, every time the bulls are definitely stronger than the bears and vice versa. Not to confuse with red/green candles. The shift of power gets confirmed at the earliest stage and is ONE exit strategy of several. There are available now two free parts of the TPA User Guide for our customers. The first "The Basics"
Этот индикатор распознает более 30 паттернов японских свечей и красиво выделяет их на графике. Это просто один из тех индикаторов, без которых трейдеры не могут жить. Повысьте технический анализ в одночасье Легко определить паттерны японских свечей Торгуйте надежными и универсальными моделями разворота Перейдите к установленным тенденциям безопасно, используя шаблоны продолжения Индикатор не перерисовывается и реализует оповещения Индикатор реализует панель управления с несколькими таймфреймами
Индикатор Gann Squares представляет собой мощный инструмент для анализа рынка, основанный на математических концепциях, представленных W.D. Gann в его статье "Математическая формула для прогнозирования рынка." Этот индикатор включает в себя техники Ганна, связанные с квадратными числами, такими как 144, 90 и 52, а также Квадрат 9. Кроме того, он включает метод по использованию Квадрата 9 в сочетании с каналами и паттерном звезды. Руководство пользователя и использование: Перед использованием это
Royal Wave Pro M5
Vahidreza Heidar Gholami
3.5 (4)
Royal Wave is a Trend-Power oscillator which has been programmed to locate and signal low-risk entry and exit zones. Its core algorithm statistically analyzes the market and generates trading signals for overbought, oversold and low volatile areas. By using a well-designed alerting system, this indicator makes it easier to make proper decisions regarding where to enter and where to exit trades. Features Trend-Power Algorithm Low risk Entry Zones and Exit Zones Predictions for Overbought and Over
Введение в Harmonic Pattern Plus Индикатор Harmonic Pattern Plus, предназначенный для работы в MetaTrader 5, ищет на графике гармонические модели. Программа Harmonic Pattern Plus предназначена для определения точек разворота текущего тренда - она находит гармонические модели с высокой силой прогнозирования. Гармонические модели состоят из нескольких линий, объединенных важными соотношениями Фибоначчи, такими как 0,618 и 0,382, которые часто используются профессиональными трейдерами для измерения
WHY IS OUR FXACCCURATE LS MT5 THE PROFITABLE ? PROTECT YOUR CAPITAL WITH RISK MANAGEMENT Gives entry, stop and target levels from time to time. It finds Trading opportunities by analyzing what the price is doing during established trends. POWERFUL INDICATOR FOR A RELIABLE STRATEGIES We have made these indicators with a lot of years of hard work. It is made at a very advanced level. Established trends provide dozens of trading opportunities, but most trend indicators completely ignore them!
Индикатор Trend Forecaster использует уникальный авторский алгоритм для определения точек входа в сделку по пробойной стратегии. Индикатор определяет ценовые скопления и анализирует движение цены возле уровней и показывает сигнал, когда цена пробивает уровень. Индикатор Trend Forecaster подходит для любых финансовых активов: валюты (Форекс), металлы, акции, индексы, криптовалюты. Также индикатор можно настроить для работы на любых тайм-фреймах, однако в качестве рабочего тайм-фрейма все же реком
Этот индикатор является уникальным, качественным и доступным инструментом для торговли, включающим в себя наши собственные разработки и новую формулу. В обновленной версии появилась возможность отображать зоны двух таймфреймов. Это означает, что вам будут доступны зоны не только на старшем ТФ, а сразу с двух таймфреймов - таймфрейма графика и старшего: отображение вложенных зон. Обновление обязательно понравится всем трейдерам, торгующим по зонам спроса и предложения. Важная информация Для мак
Другие продукты этого автора
Введение в Harmonic Pattern Plus Индикатор Harmonic Pattern Plus, предназначенный для работы в MetaTrader 5, ищет на графике гармонические модели. Программа Harmonic Pattern Plus предназначена для определения точек разворота текущего тренда - она находит гармонические модели с высокой силой прогнозирования. Гармонические модели состоят из нескольких линий, объединенных важными соотношениями Фибоначчи, такими как 0,618 и 0,382, которые часто используются профессиональными трейдерами для измерения
Способ применения Pair Trading Station Рекомендуется использовать Pair Trading Station на таймфрейме H1 с любой валютной парой. Чтобы получить сигналы на покупку и продажу, следуйте указанным ниже инструкциям по применению Pair Trading Station в терминале MetaTrader. При загрузке Pair Trading Station на график индикатор оценит доступные исторические данные на вашей платформе MetaTrader для каждой валютной пары. В самой начале на графике отобразятся исторические данные, доступные для каждой валют
Поддержка и сопротивление – важные ценовые уровни на внутридневном рынке. Эти уровни обычно тестируются ценой, после чего она продолжает движение, либо приводят к развороту тренда. Для опытных трейдеров точное определение уровней поддержки/сопротивления сложно переоценить. На их основе строятся многие популярные торговые стратегии (например, торговля на пробой/отскок). Precision Support and Resistance предназначен для профессиональных трейдеров. Помимо точного определения уровней поддержки/сопро
Рынок Форекс может пройти множество различных ценовых путей к достижению некоей точки в будущем. Будущее динамично. Поэтому, планирование торговли с возможным будущим сценарием является важным шагом для вашего успеха. Для этих целей представляем вашему вниманию Harmonic Pattern Scenario Planner, первый предиктивный инструмент для определения гармонических моделей в своем роде. Основные характеристики Прогнозирование будущих моделей для анализа сценариев 11 Определение гармонических моделей Авт
Introduction to X3 Chart Pattern Scanner X3 Cherart Pattern Scanner is the non-repainting and non-lagging indicator detecting X3 chart patterns including Harmonic pattern, Elliott Wave pattern, X3 patterns, and Japanese Candlestick patterns. Historical patterns match with signal patterns. Hence, you can readily develop the solid trading strategy in your chart. More importantly, this superb pattern scanner can detect the optimal pattern of its kind. In addition, you can switch on and off individu
Introduction to Fractal Pattern Scanner Fractal Indicator refers to the technical indicator that makes use of the fractal geometry found in the financial market. Fractal Pattern Scanner is the advanced Fractal Indicator that brings the latest trading technology after the extensive research and development work in the fractal geometry in the financial market. The most important feature in Fractal Pattern Scanner is the ability to measure the turning point probability as well as the trend probabil
Peak Trough Analysis - отличный инструмент для обнаружения пиков и впадин на графике. Peak Trough Analysis может использовать три разных алгоритма обнаружения пиков и впадин. Эти три алгоритма включают в себя оригинальный индикатор Fractals Билла Вильямса, модифицированный индикатор Fractals и индикатор ZigZag. Вы можете использовать этот инструмент анализа пиков и впадин для обнаружения паттернов, составленных Равновесным Фрактально-Волновым процессом. Для дальнейшего использования имеется хоро
FREE
Introduction This indicator detects volume spread patterns for buy and sell opportunity. The patterns include demand and supply patterns. You might use each pattern for trading. However, these patterns are best used to detect the demand zone (=accumulation area) and supply zone (=distribution area). Demand pattern indicates generally potential buying opportunity. Supply pattern indicates generally potential selling opportunity. These are the underlying patterns rather than direct price action. T
FREE
Период низкой волатильности и нетрендового движения на финансовом рынке считается периодом бокового рынка (Sideways Market). Рано или поздно волатильность начинает расти и рынок переходит в трендовую фазу. Период бокового рынка (флет) может служить хорошим временем входа в рынок. Кроме того, боковой рынок часто означает накопление на рынке объемных ордеров крупных инвесторов. Информация о господстве на рынке флета может помочь вам определить хорошие моменты для входа в рынок и выхода из него. Тр
Способ применения Pair Trading Station Рекомендуется использовать Pair Trading Station на таймфрейме H1 с любой валютной парой. Чтобы получить сигналы на покупку и продажу, следуйте указанным ниже инструкциям по применению Pair Trading Station в терминале MetaTrader. При загрузке Pair Trading Station на график индикатор оценит доступные исторические данные на вашей платформе MetaTrader для каждой валютной пары. В самой начале на графике отобразятся исторические данные, доступные для каждой валют
Introduction to X3 Chart Pattern Scanner X3 Cherart Pattern Scanner is the non-repainting and non-lagging indicator detecting X3 chart patterns including Harmonic pattern, Elliott Wave pattern, X3 patterns, and Japanese Candlestick patterns. Historical patterns match with signal patterns. Hence, you can readily develop the solid trading strategy in your chart. More importantly, this superb pattern scanner can detect the optimal pattern of its kind. In addition, you can switch on and off individu
Excessive Momentum Indicator – один из немногих индикаторов, измеряющий чрезмерный импульс на финансовом рынке с использованием ценового поведения. Индикатор полностью разработан Янгом Хо Сео (Young Ho Seo). Этот показатель демонстрирует концепцию и практическое применение Равновесной фрактальной волны (Equilibrium Fractal Wave). Чрезмерный импульс на рынке может рассказать о психологии толпы и помочь спрогнозировать направление цены. Таким образом, вы можете основывать свои торговые решения на
Индикатор Elliott Wave Trend был разработан для научного подсчета волн на основе шаблонов и паттернов, впервые разработанных Чжон Хо Сео. Индикатор нацелен на максимальное устранение нечеткости классического подсчета волн Эллиотта с использованием шаблонов и паттернов. Таким образом индикатор Elliott Wave Trend в первую очередь предоставляет шаблон для подсчета волн. Во-вторых, он предлагает структурный подсчет волн Wave Structural Score, которые помогает определить точное формирование волны. Он
Introduction This indicator detects volume spread patterns for buy and sell opportunity. The patterns include demand and supply patterns. You might use each pattern for trading. However, these patterns are best used to detect the demand zone (=accumulation area) and supply zone (=distribution area). Demand pattern indicates generally potential buying opportunity. Supply pattern indicates generally potential selling opportunity. These are the underlying patterns rather than direct price action. T
FREE
Introduction to Fractal Moving Average Fractal Moving Average indicator was designed as part of Fractal Pattern Scanner. Inside Fractal Pattern Scanner, Fractal Moving Average Indicator was implemented as multiple of chart objects. With over thousands of chart object, we find that it was not the best and efficient ways to operate the indicator. It was computationally too heavy for the indicator. Hence, we decide to implement the indicator version of Fractal Moving Average indicator to benefit ou
FREE
Introduction to Fractal Pattern Scanner Fractal Indicator refers to the technical indicator that makes use of the fractal geometry found in the financial market. Fractal Pattern Scanner is the advanced Fractal Indicator that brings the latest trading technology after the extensive research and development work in the fractal geometry in the financial market. The most important feature in Fractal Pattern Scanner is the ability to measure the turning point probability as well as the trend probabi
Introduction To Time Box Indicator Time Box Indicator is a must have indicator for any trader. It will display daily, weekly and Monthly box according to your preferences. Yet, you can extend any important price levels in your chart automatically. You can use them as the significant support and resistance levels. It is very simple but effective tool for your trading. Graphic Setting Use White Chart Line Style for Current Open price Daily Setting Update Timeframe for daily box Number of days
FREE
Ace Supply Demand Zone Indicator The concept of supply demand relies on the quantity mismatching between buying and selling volumes in the financial market. Supply and demand zone can provide the good entry and exit. A zone is easier to trade than a line. The supply demand zone can provide the detailed trading plan and the risk management. Its ability to predict market direction is high. There are two distinctive points about Ace Supply Demand Zone Indicator. Ace Supply Demand Zone indicator was
EFW Pattern Trader - это мощный сканер паттернов для вашей торговли. Основные методы обнаружения паттернов в этом продукте следуют принципам равновесной фрактальной волны (Equilibrium Fractal Wave, обозначение EFW с использованием коэффициента формы и коэффициента распространения; оригинальная концепция, созданная Young Ho, Seo). Таким образом, EFW Pattern Trader предоставляет эффективный алгоритм обнаружения паттернов. Любые паттерны, найденные с помощью EFW Pattern Trader, можно протестировать
Peak Trough Analysis - отличный инструмент для обнаружения пиков и впадин на графике. Peak Trough Analysis может использовать три разных алгоритма обнаружения пиков и впадин. Эти три алгоритма включают в себя оригинальный индикатор Fractals Билла Вильямса, модифицированный индикатор Fractals и индикатор ZigZag. Вы можете использовать этот инструмент анализа пиков и впадин для обнаружения паттернов, составленных Равновесным Фрактально-Волновым процессом. Для дальнейшего использования имеется хоро
FREE
Introduction Auto Chart Alert is a convenient tool to set alert for your trading in your chart. With Auto Chart Alert, you can set the alert line in one click in your desired location in your chart. You can even set alert over the sloped lines in your chart. Auto Chart Alert is a great tool when you have to watch out importnat support and resistance levels for your trading. You can receive the sound alert, email and push notification when the price hit the alert line at you desired location. A
FREE
Траектории движения финансового рынка схожи с полиномиальными искривлениями наличием случайных флуктуаций. Существует распространенное мнение, что можно разложить финансовые данные на множество различных циклических компонентов. Если какой-либо финансовый рынок обладает как минимум одним циклом, то в этих финансовых данных должна быть точка разворота. В таком случае, большинство данных финансовых рынков должны иметь кратные точки разворота, поскольку обычно они состоят из множества циклических к
Introduction To Time Box Indicator Time Box Indicator is a must have indicator for any trader. It will display daily, weekly and Monthly box according to your preferences. Yet, you can extend any important price levels in your chart automatically. You can use them as the significant support and resistance levels. It is very simple but effective tool for your trading. Graphic Setting Use White Chart Line Style for Current Open price Daily Setting Update Timeframe for daily box Number of days
FREE
Концепция спроса и предложения с возвратом к среднему значению Концепция торговли по спросу и предложению полагается на несовпадение объемов покупок и продаж на финансовых рынках. Для обычных трейдеров зоны спроса и предложения служат точками разворота. При рассмотрении первоначальной концепции было обнаружено, что первоначальная торговля по спросу и предложению может выполняться лучше на периоде возврата к среднему значению, а не на периоде тренда. Для демонстрации этой концепции, чтобы какая-л
Introduction to Fractal Moving Average Fractal Moving Average indicator was designed as part of Fractal Pattern Scanner. Inside Fractal Pattern Scanner, Fractal Moving Average Indicator was implemented as multiple of chart objects. With over thousands of chart object, we find that it was not the best and efficient ways to operate the indicator. It was computationally too heavy for the indicator. Hence, we decide to implement the indicator version of Fractal Moving Average indicator to benefit
FREE
Об эксперте Order Risk Management Эксперт ORM разработан специально для быстрого и точного исполнения ордеров. Он предназначен для использования с нашими перечисленными ниже стратегиями Ценового действия и Эконометрической торговли. Эксперт ORM полностью автоматизирован и прост в применении. Эксперт ORM абсолютно бесплатный. Такой способ исполнения ордеров экспертом ORM подходит для любой иной торговой стратегии. Harmonic Pattern Plus MT5 Harmonic Pattern Scenario Planner MT5 Price breakout Patt
FREE
Уровни Фибоначчи используются в трейдинге уже около 85 лет, с момента создания Волновой теории Эллиотта. До сих пор трейдеры используют анализ Фибоначчи для определения ценовых паттернов. Тем не менее, мы не смогли найти примеров использования анализ Фибоначчи для работы с волатильностью. Индикатор Harmonic Volatility стал первым техническим инструментом, использующим уровни Фибоначчи для анализа волатильности на рынке. Изначально индикатор Harmonic Volatility разрабатывался как способ преодолет
Об эксперте Order Risk Management Эксперт ORM разработан специально для быстрого и точного исполнения ордеров. Он предназначен для использования с нашими перечисленными ниже стратегиями Ценового действия и Эконометрической торговли. Эксперт ORM полностью автоматизирован и прост в применении. Эксперт ORM абсолютно бесплатный. Такой способ исполнения ордеров экспертом ORM подходит для любой иной торговой стратегии. Harmonic Pattern Plus MT4 Harmonic Pattern Scenario Planner MT4 Price breakout Patt
FREE
Introduction Auto Chart Alert is a convenient tool to set alert for your trading in your chart. With Auto Chart Alert, you can set the alert line in one click in your desired location in your chart. You can even set alert over the sloped lines in your chart. Auto Chart Alert is a great tool when you have to watch out importnat support and resistance levels for your trading. You can receive the sound alert, email and push notification when the price hit the alert line at you desired location. A
FREE
Introduction to Chart Pattern MT Chart Pattern MT is a chart pattern scanner to detect the triangle pattern, falling wedge pattern, rising wedge pattern, channel pattern and so on. Chart Pattern MT uses highly sophisticated chart pattern detection algorithm. However, we have designed it in the easy to use with intuitive user interface. Chart Pattern MT will show all the patterns in your chart in the most efficient format for your trading. You do not have to do tedious manual pattern detection an
Фильтр:
Нет отзывов
Ответ на отзыв
Версия 2.2 2022.03.03
In version 2.2, we have made some minor improvement on Volume Spread Pattern Indicator.

Bars to scan: Amount of bars to calculate demand and supply pattern.
Indicator Period: Calculation period to generate each supply and demand patterns.
Lookback Factor: 1.0 as default
Signal to Noise Ratio: from 0.4 to 1.0 only. (Input used to filter random fluctuations in data.)

Версия 2.1 2020.07.11
In version 2.1, Volume Spread Pattern Indicator provides the age of Volume Spread Pattern for bearish and bullish signals. It is useful information in the multiple timeframe scanning context because it helps you to recognize the bullish and bearish strength of other timeframe.