Strength Graph
- Индикаторы
- Zi Feng Ding
- Версия: 1.0
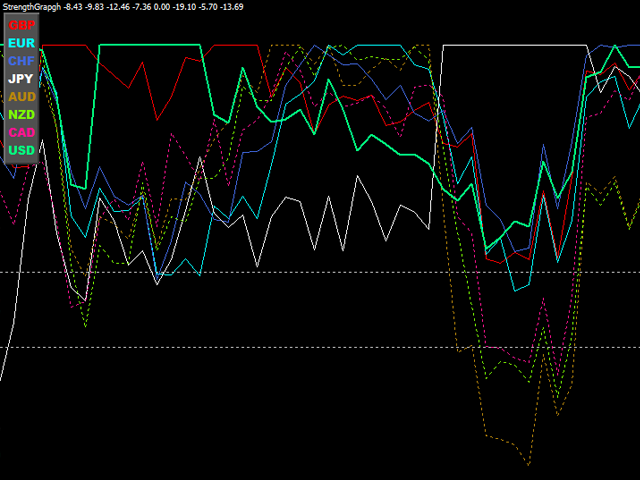
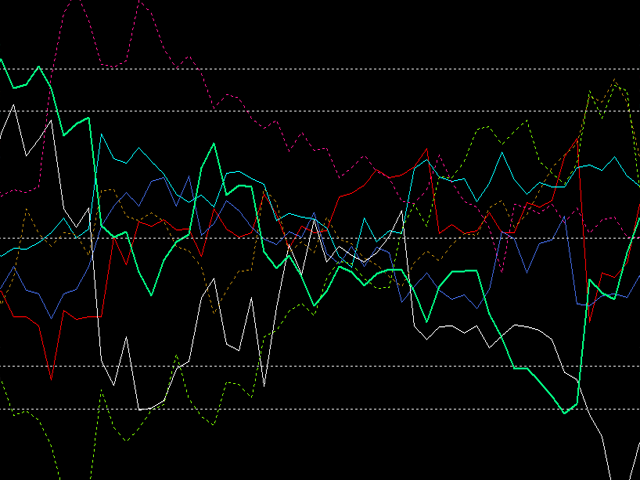
This indicator is a tool to measure the relative strength of different currency pairs. It present major currencies strength value base on their relative strength/weakness in custom period of time.
Indicator parameters
- Strength Period - Change the strength period in the settings affects the number of bars used for calculation. The higher the period value, the smoother the indicator lines and the result will represent longer term strength of each currencies, rather than recent strength.
- Display Options - Select the display options which affect how the data is visually displayed. (show strength/weakness/kebab).
- In mode "show strength", the stronger one currency gets, the higher its value. The weakest currency will be of value 0.
- In mode "show weakness", the weaker one currency gets, the lower its value. The strongest currency will be of value 0.
- In mode "show kebab", the stronger one currency gets, the higher its value. The average strength value will be 50.
It is useful when you are trying to trade not only major pairs but different cross pairs.
If this indicator is not working properly, it is likely that you have to switch between different timeframes and wait for it to refresh.
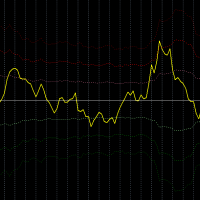
The indicator window displaying data value range can be customized it in the settings. You can change indicator line colors and styles for visual preference. To disable currency line, select "none" for its color.

















for verification of winning rate