• Обзор
  • Отзывы
  • Обсуждение (1)

XR Combo

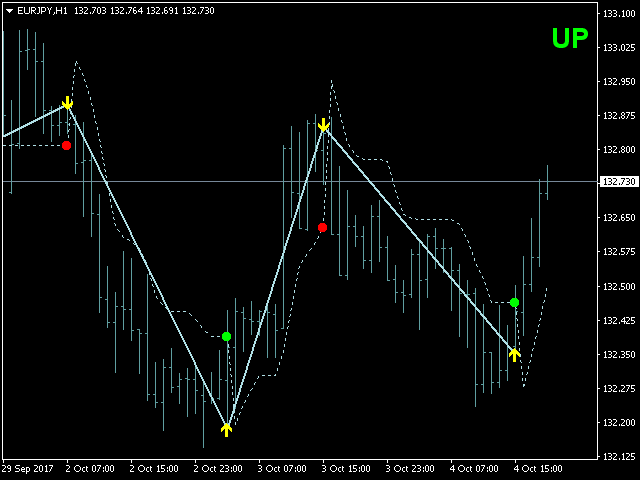
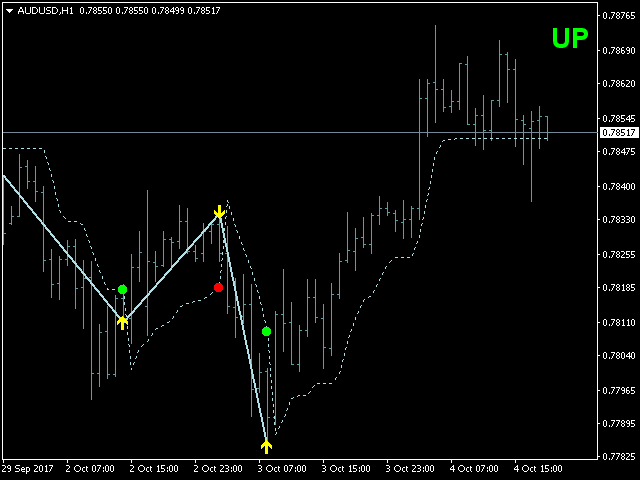
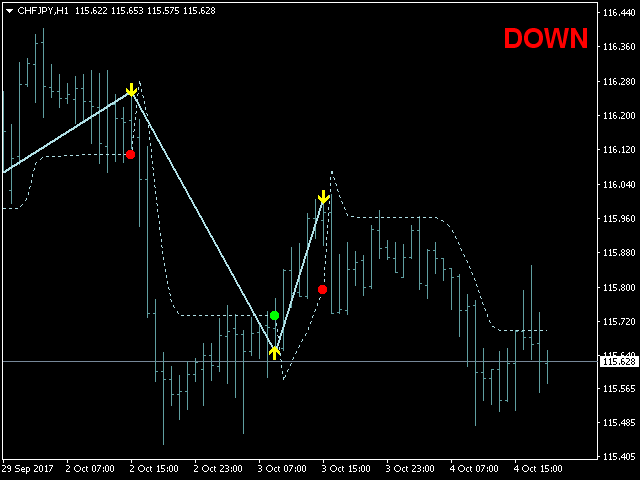
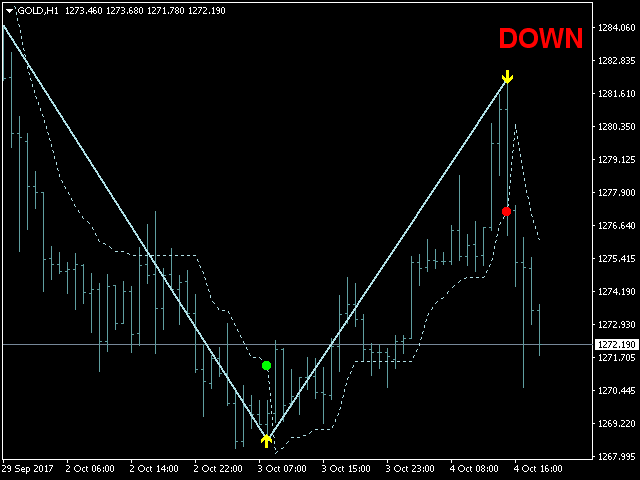
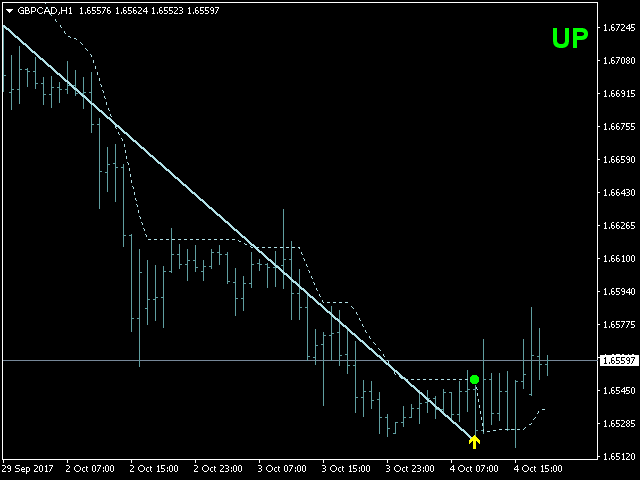
Индикатор отображает направление движения тренда.


Параметры

  • XRMultiplier: множитель XR.
  • Line: движение линии (true/false).
  • XRzak: движения XRzak (true/false).
  • Arrow1: движения стрелки (true/false).
  • Arrow2: движения стрелки вверх и вниз (true/false).
  • Trend: движения тренда (true/false).
  • X: переместить тренд влево/вправо.
  • Y: переместить тренд вверх/вниз.

Расшифровка:

  • Зеленая стрелка – восходящий тренд.
  • Красная стрелка – нисходящий тренд.
Рекомендуем также
Индикатор для бинарных опцыонов стрелочный прост в использовании и не требует настройки работает на всех валютных парах акцыях крипто валюте сигнал на покупку синяя стрелка вверх  сигнал на продажу красная стрелка в низ  советы не стоит торговать во время новостей и за 15-30 минут перед их выходом так как рынок слишком волотилен и очень много шума  входить в сделки стоит на одну или две свечи от текущего периода ( рекомендуется на 1 свечу ) таймфрейм до м 15 рекомендуемый мани менеджмент фиксир
This indicator works on MT4 and is very easy to use. When you receive a signal from it, you wait for that candle with the signal to close and you enter your trade at the beginning of the next new candle . A red arrow means sell and a green arrow means buy. All arrows comes with Alert  like for easy identification of trade signal. Are you okay with that? 1 minute candle 1 minute expire
индикатор для торговли бинарными опционами и торговли на рынке форекс индикатор не перерисовывает показания. при торговле бинарными опцыонами проводилось тестирование данный индикатор показал хороший результат  при таких условиях график eur/usd m1 при появлении сигнала открываетса сделка в направлении указаном индикатором на 5 свечей то исть на (5 минут так как в нас минутный график 1 свечя равна 1 минуте) в итоге вышел такой результат при торговле на рынке форекс вам понадобитса брокер который
Advanced Stochastic Scalper - это профессиональный индикатор на базе известного индикатора Stochastic Oscillator. Advanced Stochastic Scalper представляет из себя осциллятор с динамическими уровнями перекупленности и перепроданности, у стандартного Stochastic Oscillator эти уровни статические и никогда не изменяются. Это позволяет Advanced Stochastic Scalper адаптироваться под постоянно меняющийся рынок. При появлении сигнала на покупку или продажу на графике рисуется стрелка и появляется алерт,
Noize Absorption Index - is the manual trading system that measures the difference of pressure between bears forces and bulls forces. Green line - is a noize free index that showing curent situation. Zero value of index shows totally choppy/flat market.Values above zero level shows how powerfull bullish wave is and values below zero measures bearish forces.Up arrow appears on bearish market when it's ready to reverse, dn arrow appears on weak bullish market, as a result of reverse expectation. S
Автоматизированный мультивалютный советник с неограниченным количеством валютных пар. При этом можно на каждую отдельную валютную пару указать, как советник будет с ней работать. Можно добавлять ордера вручную. В эксперте не заложена определенная стратегия. Каждый сам выбирает какие функции он будет использовать. И по каким индикаторам и на каких ТФ с ними работать. Реальный счет, который полностью ведет эксперт. Используются MACD и Envelopes . Индикаторы Two Moving Average Envelopes RSI Force I
The Binary Profit Maker,  This indicator works on MT4 and is very easy to use. When you receive a signal from it, you wait for that candle with the signal to close and you enter your trade at the beginning of the next new candle . A Up Purple arrow means Buy and a Down Purple arrow means Sell. All arrows comes with Alert  like for easy identification of trade signal. Are you okay with that? How To Enter Trade? 1 minute candle 1 minute expire
The Indicator show Daily Pivot Points. It is possible to specify the number of days to display. For forex it doesn't consider the sunday session data. It is possibile to modify the color, style and  width for every level.It is better to use this indicator with timeframe not higher than Н1. 4 Levels of support and resistance with also Intermediate Levels that is possible to hide. Pivot trading: 1.pp pivot 2. r1 r2 r3, s1 s2 s3 Pivot points have been a trading strategy for a long time, orig
Heiken Ashi candle chart is an improved version of The Japanese candle chart, which can effectively filter the market "noise" of the Japanese candle chart. It is favored by many traders for its simplicity and intuition. For trend traders, the HA candle chart is a magic tool. Unlike the traditional Japanese candle chart, Heikenashi does not reflect the opening price, high price, low price and closing price of the market. Instead, Heikenashi calculates the value of a single K line in the dominant
PRO Renko System - это высокоточная система торговли на графиках RENKO. Система универсальна. Данная торговая система может применяться к различным торговым инструментам. Система эффективно нейтрализует так называемый рыночный шум, открывая доступ к точным разворотным сигналам. Индикатор прост в использовании и имеет лишь один параметр, отвечающий за генерацию сигналов. Вы легко можете адаптировать алгоритм к интересующему вас торговому инструменту и размеру ренко бара. Всем покупателям с удовол
Title : Market Bias Indicator - Oscillator-Based Trading Tool Introduction : Discover the potential of the "Market Bias Indicator," a revolutionary oscillator-based trading tool designed for precise market analysis. If you're in search of a robust alternative to traditional bias indicators, your quest ends here. Market Bias Indicator offers unparalleled accuracy in identifying market sentiment and is your gateway to confident trading decisions. Recommended Trading Pairs : Market Bias Indicator i
Embark on the pinnacle of Binary Options evolution. Our indicator isn't just adaptive—it's relentless. Picture a ninja riding a serpent, shadowing its every move; that's how this tool trails the market trend, unwavering till the end. Built upon the foundational prowess of the Ichimoku indicator and honed with an array of fine-tuned oscillators, it epitomizes accuracy and precision. Dive deep without getting lost in the Ichimoku's intricacies—our indicator simplifies the process for you. Perhaps
Индикатор R 2EMA Color для MT4 дает надежные торговые сигналы, основанные на пересечении двух EMA. Ключевые моменты Когда цена пересекает и закрывается выше двух зеленых EMA, это создает торговый сигнал на покупку. Когда цена пересекает и закрывается выше двух красных EMA, это создает торговый сигнал на продажу. Индикатор R 2EMA Color Forex позволяет еще проще определить, когда пора покупать и продавать. Сигнал на покупку возникает, когда две линии EMA становятся зелеными. Сигнал на продажу в
Индикатор Urgently создан для быстрого определения ситуации на рынке, отражает состояние рынка и сигнализирует о выгодных уровнях для открытия сделок. Рыночные условия меняются достаточно быстро, требуя постоянной калибровки торговых стратегий. Рекомендуется использовать совместно с любым из осцилляторов. Трендовый индикатор рынка форекс Urgently показывает направление тренда и точки входа. Он сглаживет колебания цены при формирования сигнала путем усреднения данных и сигнала только в определен
Delta Pairs
Anatolii Zainchkovskii
Delta Pairs - Индикатор для парной торговли, показывает расхождение двух валютных пар. Не перерисовывается. Полезный инструмент для анализа поведения двух валютных пар относительно друг друга. Назначение Индикатор Delta Pairs предназначен для определения расхождений в движении двух валютных пар. Данный индикатор отображается как два графика линий и разницы (дельты) между этими графиками в виде гистограммы. Индикатор Delta Pairs будет удобен тем, кто применяет парную торговлю. В основе этого мет
Прежде всего стоит подчеркнуть, что этот Торговый Инструмент является Неперерисовывающимся Нерепейнтинговым Индикатором, что делает его идеальным для профессиональной торговли. Онлайн-курс, руководство пользователя и демонстрация. Индикатор Концепций Умного Действия Цены - очень мощный инструмент как для новичков, так и для опытных трейдеров. Он объединяет более 20 полезных индикаторов в одном, комбинируя передовые торговые идеи, такие как анализ Inner Circle Trader и стратегии торговли концеп
The Strategy Tester product is an indicator where you can both test and run strategies. There are 64 strategies in total in this indicator. It uses 3 indicators. You can test tens of thousands of strategies by changing the parameter settings of these indicators. You can run 6 strategies at the same time. With this product, you will now create your own signals. Recommendations and Features Used indicators: Stochastic, Macd, Williams Percent Range It works on all time frame   Recommended time fr
Представляем вашему вниманию индикатор "Счётчик закрытия свечи", который станет вашим незаменимым помощником в мире трейдинга. Вот почему знание того, когда свеча закроется, может помочь: Если вы любите торговать, используя свечные паттерны, то вы будете знать, когда свеча будет закрыта. Этот индикатор позволит вам проверить, сформировался ли известный шаблон и есть ли возможность торговли. Индикатор поможет вам подготовиться к открытию рынка и закрытию рынка. Вы можете установить таймер, чтобы
The   Strategy Tester   product is an indicator where you can both test and run strategies. There are 64 strategies in total in this indicator. It uses 3 indicators. You can test tens of thousands of strategies by changing the parameter settings of these indicators. You can run 6 strategies at the same time. With this product, you will now create your own signals. Recommendations and Features Used indicators:   Rsi, Bears power, Stochastic It works on all   time frame   Recommended time frame
EZZ Elite Zig Zag is an indicator for the MetaTrader 4 terminal. This indicator traces the peak of the trend based on the market reversal, thus showing various opportunities in the financial market. EZZ Elite Zig Zag is a visual tool, intuitive, and easy to understand and use.  Test it Yourself by Downloading it for Free. Author Paulo Rocha all rights reserved
MACD Color for GOLD  Use for looking moving-way of graph and checking will be buy or sell  Easy for looking by see the color of trand. Red is down / Blue is up.  Can to use it with every time-frame by 1. Long Trade : Use it with time-frame H1 /  H4 /  Daily  2.Short Trade : Use it with  time-frame  M5 / M15  / M 30 /  H1 and you can see when you will open or close the orders by see this indicator by well by see signal line cut with color line again in opposite. and you can use this indicator for
Индикатор поддержки и сопротивления для бинарных опционов Этот индикатор разработан специально для торговли бинарными опционами и отлично показывает откаты от уровней поддержки и сопротивления. Сигналы появляются на текущей свече. Красная стрелка, направленная вниз, указывает на потенциальную возможность продажи, а синяя стрелка, направленная вверх, предлагает возможности для покупки. Все, что вам нужно настроить, это цвет сигнальных стрелок. Рекомендуется использовать его на таймфреймах M1-M5,
The Th3Eng PipFinite indicator is based on a very excellent analysis of the right trend direction with perfect custom algorithms. It show the true direction and the best point to start trading. With StopLoss point and Three Take Profit points. Also it show the right pivot of the price and small points to order to replace the dynamic support and resistance channel, Which surrounds the price. And Finally it draws a very helpful Box on the left side on the chart includes (take profits and Stop loss
TT Arrows is a trend based indicator that very succesfully predicts the start of the new trend.  The indicator is working with all trading instruments and in M5, M15, H1 and H4 timeframes. Up arrow signals a good time to enter a bullish trade while down arrow signals a good time to enter a bearish trade. The trade should be taken when the candle that has the arrow is closed. Following this strategy you will have have a high percentage of winning trades. Enjoy!
YK-Fibo Pivot Indicator: Trade Smarter with Fibonacci Pivot Points The YK-Fibo Pivot Indicator is a powerful technical analysis tool that combines the precision of Fibonacci retracements with the insights of Pivot Points. Whether you're a novice or seasoned trader, this indicator empowers you to spot profitable opportunities in the market with ease. Why Choose YK-Fibo Pivot? Pinpoint Support & Resistance: By calculating Fibonacci levels based on the previous day's high, low, and close prices, y
Это инструмент, помогающий не только торговать по методике VSA (Volume Spread Analysis) и PRICE ACTION, но и изучать в разрезе данные методы. Индикатор ищет на графике паттерны VSA и PRICE ACTION с учетом текущего тренда. Есть возможность просматривать паттерны старшего таймфрейма на графике текущего периода. Пользовательский режим дает возможность находить свои паттерны и закономерности рынка на основе метода VSA. Также имеется гистограмма объемов с автоподстройкой толщины и визуальными горизон
Dear Traders this is my another tool called " Swing Master Indicator ". As the name above the indicator is designed to help you in swing trading by capturing the low and highs of the price. You may us this tool with any trading strategy and style from scalping to position trading. It is made for level of traders including newbies and advanced traders even prop-firms, hedge funds and banks to help them make sold market analysis. I create tools for serious traders who want to make a difference in
Forex Daily Scalping EA is a professional scalping advisor for daily work on the FOREX currency market. In trading, along with experience, traders usually come to understand that the levels of accumulation of stop orders, price and time play a significant role in the market. Recommend ECN broker with LOW SPREAD: IC Market , Exness, NordFX , FXPRIMUS , Alpari , FXTM PARAMETERS: PRICE - the price distance to be covered in the allotted time period; TIME - time allotted in seconds; HL_PERIOD - n
This is a mini version(One pair) of Advanced Detector of Trend Reversal and Continuance known as TrueTrendStarM(TTSm25). It is a sensitive and Predictive indicator of Price Trends for Professional traders. ( WEEKEND DISCOUNT OFF  !! )( ATTENTION BUYERS:- PLEASE CONTACT SELLER FOR HOW BEST TO USE THE INDICATOR FOR MAXIMUM PROFITS )    It detects high odds changes in Price Trend direction long before other indicator detects it. I have been working on it since 2019.    This is possible due to f
Описание индикатора Binary DUNKS для MT4 Binary DUNKS — это инструмент для торговли бинарными опционами, который эффективно работает на таймфреймах от M5 и выше . Индикатор подходит для всех валютных пар и помогает находить потенциальные точки входа в рынок. Ключевые особенности Экспирация: По умолчанию установлена на 1 свечу , но вы можете изменить её в настройках индикатора. Сигналы: Индикатор генерирует стрелки: Красная стрелка — сигнал на продажу. Синяя стрелка — сигнал на покупку.
С этим продуктом покупают
Dynamic Forex28 Navigator — инструмент для торговли на рынке Форекс нового поколения. В НАСТОЯЩЕЕ ВРЕМЯ СКИДКА 49%. Dynamic Forex28 Navigator — это эволюция наших популярных индикаторов, объединяющая мощь трех в одном: Advanced Currency Strength28 Indicator (695 отзывов) + Advanced Currency IMPULSE with ALERT (520 отзывов) + CS28 Combo Signals (бонус). Подробности об индикаторе https://www.mql5.com/en/blogs/post/758844 Что предлагает индикатор Strength нового поколения?  Все, что вам нравило
Представляю Вам отличный технический индикатор GRABBER, который работает, как готовая торговая стратегия "Все включено"! В одном программном коде интегрированы мощные инструменты для технического анализа рынка, торговые сигналы (стрелки), функции алертов и Push уведомлений.  Каждый покупатель этого индикатора получает дополнительно БЕСПЛАТНО:  Grabber Утилиту для автоматического управления открытыми ордерами, Пошаговый видео-мануал : как установить, настроить и торговать, Авторские сет-файлы для
В настоящее время скидка 20%! Лучшее решение для новичка или трейдера-эксперта! Эта приборная панель работает на 28 валютных парах. Он основан на 2 наших основных индикаторах (Advanced Currency Strength 28 и Advanced Currency Impulse). Он дает отличный обзор всего рынка Forex. Он показывает значения Advanced Currency Strength, скорость движения валюты и сигналы для 28 пар Forex на всех (9) таймфреймах. Представьте, как улучшится ваша торговля, когда вы сможете наблюдать за всем рынком с помощ
Инновационный индикатор, использующий эксклюзивный алгоритм для быстрого и точного определения тренда. Индикатор автоматически рассчитывает время открытия и закрытия позиций, а также подробную статистику работы индикатора на заданном отрезке истории, что позволяет выбрать наилучший торговый инструмент для торговли. Вы также можете подключить свои пользовательские стрелочные индикаторы к Scalper Inside Pro для проверки и расчета их статистики и прибыльности. Инструкция и настройки: Читать... Осно
After your purchase, feel free to contact me for more details on how to receive a bonus indicator called VFI, which pairs perfectly with Easy Breakout for enhanced confluence!   Easy Breakout is a powerful price action trading system built on one of the most popular and widely trusted strategies among traders: the Breakout strategy ! This indicator delivers crystal-clear Buy and Sell signals based on breakouts from key support and resistance zones. Unlike typical breakout indicators, it levera
Enigmera
Ivan Stefanov
5 (7)
ENIGMERA: Основы рынка Важно: демо-версия на MQL5.com работает в Strategy Tester и может не полностью отображать функциональность Enigmera. Ознакомьтесь с описанием, скриншотами и видео для подробной информации. Не стесняйтесь обращаться с вопросами! Код индикатора был полностью переписан. Версия 3.0 добавляет новые функции и устраняет ошибки, накопившиеся с момента появления индикатора. Введение Этот индикатор и торговая система представляет собой уникальный подход к финансовым рынкам. ENIGMER
FX Volume
Daniel Stein
4.59 (34)
FX Volume: Оцените подлинную динамику рынка глазами брокера Краткий обзор Хотите вывести свою торговлю на новый уровень? FX Volume дает вам информацию в реальном времени о том, как розничные трейдеры и брокеры распределяют свои позиции — задолго до появления запаздывающих отчетов типа COT. Независимо от того, стремитесь ли вы к стабильной прибыли или ищете дополнительное преимущество на рынке, FX Volume поможет выявлять крупные дисбалансы, подтверждать пробои и совершенствовать управление риск
Lux Trend
Mohamed Hassan
5 (3)
After purchase, please contact me to get your trading tips + more information for a great bonus!   Lux Trend is a professional strategy based on using Higher Highs and Lower Highs to identify and draw Trendline Breakouts! Lux Trend  utilizes two Moving Averages to confirm the overall trend direction before scanning the market for high-quality breakout opportunities, ensuring more accurate and reliable trade signals. This is a proven trading system used by real traders worldwide, demonstrating
TPSproTREND PrO
Roman Podpora
4.68 (25)
VERSION MT5        —        ИНСТРУКЦИЯ RUS           —        INSTRUCTIONS  ENG Основные функции: Точные сигналы на вход БЕЗ ПЕРЕРИСОВКИ! Если сигнал появился, он остается актуальным! Это важное отличие от индикаторов с перерисовкой, которые могут предоставить сигнал, а затем изменить его, что может привести к потере средств на депозите. Теперь вы сможете входить в рынок с большей вероятностью и точностью. Также есть функция окрашивания свечей после появления стрелки до достижения цели (take
Golden Trend Indicator
Noha Mohamed Fathy Younes Badr
4.9 (10)
Golden Trend indicator  is The best indicator for predicting trend movement this indicator never lags and never repaints and never back paints    and give  arrow buy and sell    before the candle appear  and it will help you and  will make your trading decisions clearer its work on all currencies and  gold and crypto and all time frame This unique  indicator uses very secret algorithms to catch the  trends, so you can trade using this indicator and see the trend clear on charts  manual guide and
PUMPING STATION – Ваша персональная стратегия "всё включено" Представляем PUMPING STATION — революционный индикатор Forex, который превратит вашу торговлю в увлекательный и эффективный процесс! Это не просто помощник, а полноценная торговая система с мощными алгоритмами, которые помогут вам начать торговать более стабильно! При покупке этого продукта вы БЕСПЛАТНО получаете: Эксклюзивные Set-файлы: Для автоматической настройки и максимальной эффективности. Пошаговое видео-руководство: Научитесь т
Индикатор, который переосмыслил трейдинг, стал эталоном анализа графиков и задал новые стандарты в трейдинге. Разворотные зоны /  Зоны пикового объема  /   Активные зоны крупного игрока    ИНСТРУКЦИЯ RUS          INSTRUCTIONS  ENG    /  Рекомендуем использовать с индикатором -  TPSpro TREND PRO Каждый покупатель этого индикатора получает дополнительно БЕСПЛАТНО:  6 месяцев доступа к торговым сигналам от сервиса RFI SIGNALS — готовые точки входа по алгоритму TPSproSYSTEM. Обучающие матери
Volatility Trend System - торговая система дающая сигналы для входов.  Система волатильности дает линейные и точечные сигналы в направлении тренда, а также сигналы выхода из него, без перерисовки и запаздываний. Трендовый индикатор следит за направлением среднесрочной тенденции, показывает направление и ее изменение. Сигнальный индикатор основан на изменении волатильности, показывает входы в рынок. Индикатор снабжен несколькими типами оповещений. Может применяться к различным торговым инструмен
Gold Venamax – это лучший биржевой технический индикатор. Алгоритм индикатора анализирует движение цены актива и отражает волатильность и потенциальные зоны для входа. Особенности индикатора: Это супер индикатор с Magic и двумя Блоками трендовых стрелочников для комфортной и профитной торговли. Красная Кнопка переключения по блокам выведена на график. Magic задается в настройках индикатора, так чтобы можно было установить индикатор на два графика с отображением разных Блоков. Gold Venamax можно
Introduction to X3 Chart Pattern Scanner X3 Cherart Pattern Scanner is the non-repainting and non-lagging indicator detecting X3 chart patterns including Harmonic pattern, Elliott Wave pattern, X3 patterns, and Japanese Candlestick patterns. Historical patterns match with signal patterns. Hence, you can readily develop the solid trading strategy in your chart. More importantly, this superb pattern scanner can detect the optimal pattern of its kind. In addition, you can switch on and off individu
[ MT5 Version ]  [ Kill Zones ]  [ SMT Divergences ] How to trade using Order Blocks:  Click here User Interface Performance:  During testing in the strategy tester, the UI may experience lag. Rest assured, this issue is specific to the testing environment and does not affect the indicator's performance in live trading. Elevate your trading strategy with the  Order Blocks ICT Multi TF  indicator, a cutting-edge tool designed to enhance your trading decisions through advanced order block analys
Gold Trend – хороший биржевой технический индикатор. Алгоритм индикатора анализирует движение цены актива и отражает волатильность и потенциальные зоны для входа. Самые лучшие сигналы индикатора: Для SELL = красная гистограмма + красный указатель SHORT + желтая сигнальная стрелка в этом же направлении. Для BUY = синяя гистограмма + синий указатель LONG + аква сигнальная стрелка в этом же направлении. Преимущества индикатора: И ндикатора выдает сигналы с высокой точностью. Подтвержденный сигнал
Персональная реализация Order Blocks, простой, но эффективной стратегии позиционной торговли. Трейдер должен войти в рынок или искать сделки в направлении последнего блока ордеров, если ценовой диапазон не был нарушен в направлении, противоположном прорыву. Открытые блоки для наглядности не прорисовываются. [ Руководство по установке | Руководство по обновлению | Устранение неполадок | FAQ | Все продукты ] Бычий открытый блок - это первый бычий бар после нового рыночного минимума. Медвежий откр
СЕЙЧАС СКИДКА 31% !!! Лучшее решение для новичка или трейдера-эксперта! Этот индикатор является уникальным, высококачественным и доступным торговым инструментом, поскольку мы включили в него ряд собственных функций и секретную формулу. Всего на ОДНОМ графике он выдает алерты по всем 28 валютным парам. Представьте, как улучшится ваша торговля, ведь вы сможете точно определить точку запуска нового тренда или возможность скальпирования! Построенный на новых базовых алгоритмах, он позволяет еще
Linear Trend Predictor - Трендовый индикатор сочетающий в себе точки для входа и линии поддержки направления. Работает по принципу пробития ценового канала High/Low. Алгоритм индикатора фильтрует рыночный шум, учитывает волатильность и рыночную динамику. Возможности индикатора Методами сглаживания показывает рыночную тенденцию и точки входа для открытия ордеров BUY или SELL. Подходит для определения краткосрочных и долгосрочных движений рынка, анализируя графики на любых таймфреймах. Адаптивн
Best Currency Strength Indicator
Tumelo Patrick Rakotsoane
4.5 (46)
Advanced Currency Strength Indicator The Advanced Divergence Currency Strength Indicator. Not only it breaks down all 28 forex currency pairs and calculates the strength of individual currencies across all timeframes , but, You'll be analyzing the WHOLE forex market in 1 window (In just 1 minute) . This indicator is very powerful because it reveals the true movements of the market.  It is highly recommended to  analyze charts knowing the performance of individual currencies or the countries eco
Индикатор ручного построения зон коррекций основанных на теории Ганна. Определяются зоны путем математического вычисления с применением особых коэффициентов для различных таймфреймов начиная с м1 и заканчивая Д1. Индикатор работает как  с валютными парами и металлами, так и с крипто и даже акциями С помощью данного индикатора Вы можете легко построить опорные зоны покупок/продаж основанных на цикличности рынка, и принимать торговые решения при подходе к данным зонам Это даст Вам понимание напра
Эта система поможет найти высоковероятностные сделки в направлении сильных трендов. Возможность заработать прибыль появляется с помощью поиска завершения движения в одну сторону. Важная информация Для максимального использования потенциала сканера прочитайте полное описание (на английском языке): www.mql5.com/en/blogs/post/718109 Использование индикатора описано в записи в логе (на английском): Professional Trading With Strong Momentum Бесплатная версия индикатора работает только на парах EURUS
Wave Synchronizer - визуальный индикатор волнового анализа. Объединяет последовательности движения свечей и производит построение направленных волн, производя синхронные движения вместе с рынком. Начало каждой волны начинается с сигнальной стрелки, также есть оповещения. Индикатор никогда не перерисует и не передвинет стрелки на прошлой истории. Сигнальные стрелки появляются на закрытии свечи. Подстраивается под работу с любыми торговыми инструментами и тайм-фреймами. Прост в использовании и на
Cycle Sniper
Elmira Memish
4.39 (36)
NEW YEAR SALE PRICE FOR LIMITED TIME!!! Please contact us after your purchase and we will send you the complimentary indicators to complete the system Cycle Sniper is not a holy grail but when you use it in a system which is explained in the videos, you will feel the difference. If you are not willing to focus on the charts designed with Cycle Sniper and other free tools we provide, we recommend not buying this indicator. We recommend watching the videos about the indiactor and system before pu
В НАСТОЯЩЕЕ ВРЕМЯ СКИДКА 26% Лучшее решение для новичка или трейдера-эксперта! Этот индикатор является уникальным, высококачественным и доступным торговым инструментом, поскольку мы включили в него ряд собственных функций и новую формулу. С помощью всего лишь ОДНОГО графика вы можете определить силу валюты для 28 пар Форекс! Представьте, как улучшится ваша торговля, потому что вы сможете точно определить точку запуска нового тренда или возможность скальпирования? Руководство пользователя:  
В НАСТОЯЩЕЕ ВРЕМЯ СКИДКА 20%! Лучшее решение для новичка или трейдера-эксперта! Этот индикатор специализирован для отображения силы валюты для любых символов, таких как экзотические пары, товары, индексы или фьючерсы. Впервые в своем роде, любой символ может быть добавлен в 9-ю строку, чтобы показать истинную силу валюты золота, серебра, нефти, DAX, US30, MXN, TRY, CNH и т.д. Это уникальный, высококачественный и доступный торговый инструмент, потому что мы включили в него ряд собственных функци
Trading Levels Indicator - система для торговли, разработанная для определения точек входа, удержания позиций и трендового направления. Включает несколько механизмов работающих в одном комплексе, волновой анализ трендового направления, уровневый анализ при построении сигналов, показывает возможные цели TP и SL. Возможности индикатора Сигнальные стрелки появляются на текущей свече, не перекрашиваются. Использует специальные алгоритмы поиска уровней от которых отскакивает цена. Работает по тренд
MT5 Version Gaussian Channel MT4 Gaussian Channel MT4 is the first indicator in the market that uses Ehlers Gaussian Filter methods to define trends. Nowadays, this Gaussian Channel is highly known as a method to support HOLD techniques in crypto. If the price is above the channel the trend is strong, if it comes back to the channel this can react as a resistance and indicate the beginning of a bear market (or Winter) if the price breaks below it. Eventhough the use of this channel focuses on h
Индикатор Supply Demand использует предыдущее ценовое действие для выявления потенциального дисбаланса между покупателями и продавцами. Ключевым является определение зон с лучшими возможностями, а не просто вероятностей. Индикатор Blahtech Supply Demand обеспечивает функционал, не доступный ни в одной платформе. Этот индикатор 4 в 1 не только выделяет зоны с более высокой вероятностью на основе механизма оценки силы по множественным критериям, но также комбинирует его с мульти-таймфреймовым анал
Другие продукты этого автора
Индикатор отображает движения уровни Фибоначчи и треугольники на таймфреймах M1-W1. Параметры InDepth: параметр глубины. InDeviation: параметр отклонения. InBackstep: количество баров в истории. Fibonacci Expansion: отображать уровни Фибоначчи. true/false Triangle: отображать треугольники. true/false Интерпретация статусов: Если треугольник зеленого цвета, тренд направлен вверх. Если треугольник красного цвета, тренд направлен вниз.
Этот индикатор отображает направление движения тренда. Параметры Trend: отображать надпись о направлении движения тренда, true/false. X: смещает надпись о направлении тренда влево/вправо. Y: смещает надпись о направлении тренда вверх/вниз. Интерпретация статусов: M1 – минутный таймфрейм. Если квадрат зеленого цвета, тренд направлен вверх. Если квадрат красного цвета, тренд направлен вниз. M5 – пятиминутный таймфрейм. Если квадрат зеленого цвета, тренд направлен вверх. Если квадрат красного цвет
Индикатор для определения преобладающего тренда. Синяя линия и красная линия изменяются при усилении трендов. Параметры ki: задержка. per: >отображает период индикатора. Trend: отображает надпись о направлении движения тренда. true/false X: смещает надпись о направлении тренда влево/вправо. Y: смещает надпись о направлении тренда вверх/вниз. Интерпретация статусов: Если стрелка синего цвета, тренд растущий. Если стрелка красного цвета, тренд падающий.
Индикатор отображает направление движения тренда. Параметры XRMultiplier1: множитель XR 1. XRMultiplier2: множитель XR 2. Line1: движение линии 1 (true/false). Line2: движение линии 2 (true/false). XRTrend: тренд XR отображает движения линий 1 и 2 (true/false). X: переместить тренд влево/вправо. Y: переместить тренд вверх/вниз. Расшифровка: Зеленая линия - восходящий тренд. Красная линия - нисходящий тренд.
This indicator zone indicator.Indicator displays high and low zone. Features Green color - Shows movement on the high zone. Red colr - Shows movement on the low zone. Yellow colr - Shows movement on the zero zone.    How to understand the status: If the bar is higher than the yellow color line , trend is up. If the bar is lower than the yellow color line , trend is down.
This indicator super indicator.Indicator displays trend movement. Indicator calculates automatically bars Features FiltPer - displays indicator period. Multiplier - displays indicator multiplier. How to understand the status: If the indicator bar is higher , trend is up. If the indicator bar is lower , trend is down. IIIIIIIIIIIIIIIIIIIIIIIIIIIIIIIIIIIIIIIIIIIIIIIIIIIIIIIIIIIIIIIIIIIIII
This indicator displays super power trend movement. Features Multiplier - displays multiplier movement. Multiplier2 - displays multiplier2 movement. Trend - displays indicator trend 1 and trend 2 (true/false). separate_windor - displays trend separate window.(0-1....) X - move the trend left and right. Y - move the trend up and down. How to understand the status: If the Trend color is green, trend is up. If the Trend color is red, trend is down.
This indicator displays Super Power  Beeta trend movement.Indicator is version 2 . Features Multiplier - displays multiplier movement. Multiplier2 - displays multiplier2 movement. Trend - displays indicator trend 1 and trend 2 (true/false). Background:color - displays background color (true/false). separate_window - displays trend separate window.(0-1....) separate_window2 - displays trend (background color )separate window.(1-2....) X - move the trend left and right. Y - move the trend up an
This indicator displays XR Power Trend movement.Indicator displays Moving Average period 5,Moving Average period 26,Moving Average period 52,Commodity Channel Index,MACD,Average Directional Movement Index,Bulls Power,Bears Power,Stochastic Oscillator,Relative Strength Index,Force Index,Momentum,DeMarker,average movement.Indicators period is standard period.    Features X - move the trend left and right. Y - move the trend up and down. How to understand the status: If the Trend color is green, t
This indicator Master XR indicator.Indicator displays trend movement. Indicator calculates automatically line. Features FiltPer - displays indicator period. deviation - displays indicator deviation. deviation2 - displays indicator deviation. How to understand the status: If (Timeframe M1-H1) FiltPer = 100; If ( Timeframe H4-MN) FiltPer = 5-20; ////////////////////////////////////////////////////////////////////////////////////////////////////////////////////////////////////////////////////// //
This indicator Super MA Pluss indicator.Indicator displays trend movement. Indicator calculates automatically line. Features FiltPer - displays indicator period. How to understand the status: If the arrow is green, trend is up. If the arrow is red, trend is down. /////////////////////////////////////////////////////////////////////////////////////////////////////////////////////////////////////////////////// ///////////////////////////////////////////////////////////////////////////////////////
This indicator Super Channel Arrow and zak indicator.Indicator displays trend movement. Indicator calculates automatically line. Features FiltPer - displays indicator channel period. FiltPer2 - displays indicator period. deviation - displays indicator channel deviation. How to understand the status: If the arrow is green, trend is up. If the arrow is red, trend is down. best FiltPer ,period timeframe M1-H1 (100);H4-MN (50) best FiltPer2, period timeframe M1-H1 (50);H4-MN (25) //////////////////
This indicator Super Channel Pro indicator.Indicator displays trend movement. Indicator calculates automatically line. Features FiltPer - displays indicator channel period. deviation - displays indicator channel deviation. deviation2 - displays indicator channel deviation. How to understand the status: If the arrow is green, trend is up. If the arrow is red, trend is down. ///////////////////////////////////////////////////////////////////////////////////////////////////////////////////////////
This indicator Super Channel Pro Pluss indicator.Indicator displays trend movement. Indicator calculates automatically line. Features FiltPer - displays indicator channel period. deviation - displays indicator channel deviation. deviation2 - displays indicator channel deviation. deviation3 - displays indicator channel deviation. How to understand the status: If the arrow is up and line color Teal ;trend is up. If the arrow is down and line color Red; trend is down. If the arrow is Yellow close
This indicator Super XT indicator.Indicator displays trend movement. Indicator calculates automatically line. Features FiltPer - displays indicator period. Window - displays indicator trend (true/false). Trend - displays indicator trend (true/false). X - move the trend left and right. Y - move the trend up and down.     How to understand the status: If the Trend color is green, trend is up. If the Trend color is red, trend is down. ////////////////////////////////////////////////////////
This indicator Super Turbo indicator.Indicator displays trend movement. Indicator calculates automatically line. Features FiltPer - displays indicator period. Step - displays indicator Step. Trend - displays indicator trend (true/false). X - move the trend left and right. Y - move the trend up and down. How to understand the status: If the Trend color is green, trend is up. If the Trend color is red, trend is down. ///////////////////////////////////////////////////////////////////////////
This indicator Pluuto Alert indicator.Indicator displays trend movement. Indicator calculates automatically line.Alert = arrow.When the alert is up the next alert is down,when the alert is down the next alert is up (new bar). Features FiltPer - displays indicator period.Line1. FiltPer2 - displays indicator period.Line2. Multiplier - displays indicator multiplier.(FlitPer,Line1;step) Deviation1 - displays indicator deviation.(Line2) Deviation2 - displays indicator deviation.(Arrow) Trend - displa
This indicator Pluuto Alert Plus indicator.Indicator displays trend movement. Indicator calculates automatically line.Alert = FiltPer.When the alert is up the next alert is down,when the alert is down the next alert is up (new bar). Features FiltPer - displays indicator period.Line1. FiltPer2 - displays indicator period.Line2. Multiplier - displays indicator multiplier.(FlitPer,Line1;step) Deviation1 - displays indicator deviation.(Line2) Deviation2 - displays indicator deviation.(Line2) Deviati
This indicator Pluuto Alert Pro indicator.Indicator displays trend movement. Indicator calculates automatically line.Alert = (FiltPer1,Line1_Arrow).When the alert is up the next alert is down,when the alert is down the next alert is up (new bar). Features FiltPer1 - displays indicator period.Per1 FiltPer2 - displays indicator period.Per2. FiltPer3 - displays indicator period.Per3. Multiplier1_per1 - displays indicator multiplier.(FlitPe1,step) Multiplier2_line1 - displays indicator multiplier.(L
This indicator XX Power indicator.Indicator displays trend movement. Indicator helps to buy and sell.In dicator displays arrow and line. Features FiltPer - displays indicator period. How to understand the status:   If the Trend color is green, trend is up. I f the Trend color is red, trend is down.    //////////////////////////////////////////////////////////////////////////////////////////////////////////////////////////////////////////////////// ////////////////////////////////////////////
This indicator Matrix X indicator.Indicator displays Stochastic oscillator,Williams Percent Range,DeMarker,Relative Strength Index,Matrix trend movement. Indicator helps to buy and sell.Matrix trend = (Stochastic+WPR+DeMarker+RSI)/4. Features KPeriod - displays Stochastic K period. DPeriod - displays Stochastic D period. Slowing- displays Stochastic Slowing. Stochastic_Method - displays Stochastic Method. Stochastic_price - displays Stochastic Price. WPR_per - displays WPR period. Dem_per - disp
This indicator Mega Super indicator.Indicator displays trend movement. Indicator helps to buy and sell.In dicator displays arrow and line. Features per - displays indicator period. How to understand the status: If the arrow color is green, trend is up. I f the arrow color is red, trend is down. //////////////////////////////////////////////////////////////////////////////////////////////////////////////////////////////////////////////////// ///////////////////////////////////////////////////
This indicator Matic indicator.Indicator displays trend movement. Indicator helps to buy and sell. The indicator shows the movement of sak1 and sak2 Stddevchannel, Regression. Features HLper - displays indicator iHighest and iLowest period. ExtDepth - displays indicator ExtDepth. ExtDeviation - displays indicator ExtDeviation. ExtBackstep - displays indicator ExtBackstep. zak1_ST_RE - displays indicator zak1,Stddevchannel,Regression.(true,false) zak2_ST_RE - displays indicator zak2,Stddevchannel
This indicator Matic Pro indicator.Indicator displays trend movement. Indicator helps to buy and sell. The indicator shows the movement of sak1 and sak2 Stddevchannel, Regression + zak2 indicator. Features HLper - displays indicator iHighest and iLowest period. ExtDepth - displays indicator ExtDepth. ExtDeviation - displays indicator ExtDeviation. ExtBackstep - displays indicator ExtBackstep. p - line indicator bars back.(bars back= zak2) m - regression.(1-8),the best(2-3) i0 -line indicator bar
This indicator Super Neuro Trend indicator.Indicator displays trend movement. Indicator helps to buy and sell. Features FiltPer- displays indicator period. deviation - displaus indicator deviation. Trend - displaus indicator trend.( true,false) Rectangle - displaus indicator rectangle. (true,false)  How to understand the status: If the trend color is green, trend is up. I f the trend color is red, trend is down. I f the trend waiting,trend waiting.     ///////////////////////////////////////////
This indicator Mega Super Neuro Trend indicator.Indicator displays trend movement. Indicator helps to buy and sell.Trend1= line1 > < line1,trend2=line1 > < line2,trend3 = line1,line2  > < line3. Features Trend - displaus indicator trend.( true,false) How to understand the status: If the trend color is green, trend is up. I f the trend color is red, trend is down. ///////////////////////////////////////////////////////////////////////////////////////////////////////////////////////////////////
This indicator XRX Master indicator.Indicator displays trend movement. Indicator helps to buy and sell. Features FiltPer- displays indicator period. deviation - displaus indicator deviation. deviation2 - displaus indicator deviation 2. HL_period - displaus indicator Highest and Lowest period. HL_period2 - displaus indicator Highest 2 and Lowest 2 period. How to understand the status: If the trend color arrow is green, trend is up. I f the trend color arrow is red, trend is down. ///////////
This indicator XXX Master indicator.Indicator displays trend movement. Indicator helps to buy and sell. Features per- displays indicator period. Step- displays indicator step. line- true (false) How to understand the status: If the trend color arrow is green, trend is up. I f the trend color arrow is red, trend is down. //////////////////////////////////////////////////////////////////////////////////////////////////////////////////////////////////////////////////// /////////////////////////////
Фильтр:
Нет отзывов
Ответ на отзыв