• Обзор
  • Отзывы
  • Обсуждение

SuperTrend Pluss

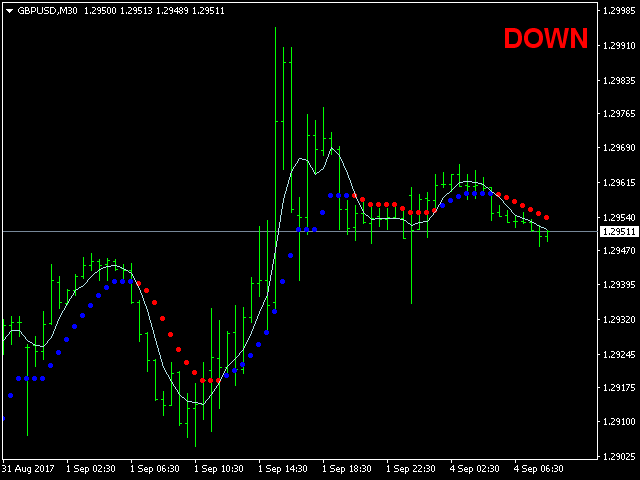
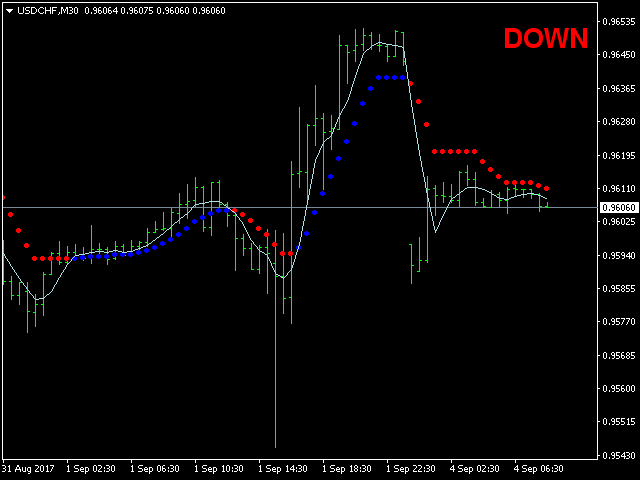
Индикатор для определения преобладающего тренда. Синяя линия и красная линия изменяются при усилении трендов.


Параметры

  • ki: задержка.
  • per: >отображает период индикатора.
  • Trend: отображает надпись о направлении движения тренда. true/false
  • X: смещает надпись о направлении тренда влево/вправо.
  • Y: смещает надпись о направлении тренда вверх/вниз.

Интерпретация статусов:

  • Если стрелка синего цвета, тренд растущий.
  • Если стрелка красного цвета, тренд падающий.
Рекомендуем также
This indicator Mega Super indicator.Indicator displays trend movement. Indicator helps to buy and sell.In dicator displays arrow and line. Features per - displays indicator period. How to understand the status: If the arrow color is green, trend is up. I f the arrow color is red, trend is down. //////////////////////////////////////////////////////////////////////////////////////////////////////////////////////////////////////////////////// //////////////////////////////////////////////
This indicator is an upgrade of traditional MACD on MT4. Macd Base line cross above Macd signal line the color of histogram change is red color and entry order Sell. Macd Base line cross below Macd signal line the color of histogram change is green color and entry order Buy. For above histogram of Macd can change color to good looking by can change color above zero line and lower line.
This indicator Pluuto Alert Pro indicator.Indicator displays trend movement. Indicator calculates automatically line.Alert = (FiltPer1,Line1_Arrow).When the alert is up the next alert is down,when the alert is down the next alert is up (new bar). Features FiltPer1 - displays indicator period.Per1 FiltPer2 - displays indicator period.Per2. FiltPer3 - displays indicator period.Per3. Multiplier1_per1 - displays indicator multiplier.(FlitPe1,step) Multiplier2_line1 - displays indicator multiplier.(L
This indicator Master XR indicator.Indicator displays trend movement. Indicator calculates automatically line. Features FiltPer - displays indicator period. deviation - displays indicator deviation. deviation2 - displays indicator deviation. How to understand the status: If (Timeframe M1-H1) FiltPer = 100; If ( Timeframe H4-MN) FiltPer = 5-20; ////////////////////////////////////////////////////////////////////////////////////////////////////////////////////////////////////////////////////// /
Этот индикатор с несколькими таймфреймами и несколькими символами предупреждает об изменениях цвета Heiken Ashi Smoothed. В качестве бонуса он также может сканировать изменения тренда (цвета) скользящей средней корпуса. В сочетании с вашими собственными правилами и методами этот индикатор позволит вам создать (или улучшить) вашу собственную мощную торговую систему. Функции Может одновременно отслеживать все символы, отображаемые в окне "Обзор рынка". Примените индикатор только к одному графику
Heiken Ashi candle chart is an improved version of The Japanese candle chart, which can effectively filter the market "noise" of the Japanese candle chart. It is favored by many traders for its simplicity and intuition. For trend traders, the HA candle chart is a magic tool. Unlike the traditional Japanese candle chart, Heikenashi does not reflect the opening price, high price, low price and closing price of the market. Instead, Heikenashi calculates the value of a single K line in the dominant
This indicator Super MA Pluss indicator.Indicator displays trend movement. Indicator calculates automatically line. Features FiltPer - displays indicator period. How to understand the status: If the arrow is green, trend is up. If the arrow is red, trend is down. /////////////////////////////////////////////////////////////////////////////////////////////////////////////////////////////////////////////////// //////////////////////////////////////////////////////////////////////////////////////
Индикатор R 2EMA Color для MT4 дает надежные торговые сигналы, основанные на пересечении двух EMA. Ключевые моменты Когда цена пересекает и закрывается выше двух зеленых EMA, это создает торговый сигнал на покупку. Когда цена пересекает и закрывается выше двух красных EMA, это создает торговый сигнал на продажу. Индикатор R 2EMA Color Forex позволяет еще проще определить, когда пора покупать и продавать. Сигнал на покупку возникает, когда две линии EMA становятся зелеными. Сигнал на продажу
This indicator Pluuto Alert Plus indicator.Indicator displays trend movement. Indicator calculates automatically line.Alert = FiltPer.When the alert is up the next alert is down,when the alert is down the next alert is up (new bar). Features FiltPer - displays indicator period.Line1. FiltPer2 - displays indicator period.Line2. Multiplier - displays indicator multiplier.(FlitPer,Line1;step) Deviation1 - displays indicator deviation.(Line2) Deviation2 - displays indicator deviation.(Line2) Deviat
The KCCi uses a Grid method with a breakeven feature, its based around the CCI and Kijun-Sen of the Ichimoku indicator. Its recommended to be used with a cent account as it requires a high volume of capital along with a broker that allows numerous open positions, along with this low spreads are desired. All major pairs can be traded with this EA, including commodities and on all TFs though before any usage please optimize . IMPORTANT: These parameters will need to be increased to the max o
Простая, но эффектиная система для определения форекс-тренда. Представляет собой  два индикатора в одном:  Heiken Ashi и Heiken Ashi Smoothed Moving Average (сглаженная скользящая средняя). Heiken Ashi (HA) и Heiken Ashi Smoothed (HAS) рассчитываются в рамках одного события с необходимыми буферами и циклом, повышая скорость их работы, улучшая оптимизацию и эффективность . По вашему выбору на графике могут отображаться одновременно оба индикатра или только один. Входные параметры Display Heiken
Noize Absorption Index - is the manual trading system that measures the difference of pressure between bears forces and bulls forces. Green line - is a noize free index that showing curent situation. Zero value of index shows totally choppy/flat market.Values above zero level shows how powerfull bullish wave is and values below zero measures bearish forces.Up arrow appears on bearish market when it's ready to reverse, dn arrow appears on weak bullish market, as a result of reverse expectation. S
YK-Fibo Pivot Indicator: Trade Smarter with Fibonacci Pivot Points The YK-Fibo Pivot Indicator is a powerful technical analysis tool that combines the precision of Fibonacci retracements with the insights of Pivot Points. Whether you're a novice or seasoned trader, this indicator empowers you to spot profitable opportunities in the market with ease. Why Choose YK-Fibo Pivot? Pinpoint Support & Resistance: By calculating Fibonacci levels based on the previous day's high, low, and close prices, y
Chart Patterns Detect 15 patterns (Ascending Triangle, Descending Triangle, Rising Wedge, Falling Wedge, Bullish Flag, Bearish Flag, Bullish Rectangle, Bearish Rectangle Symmetrical triangle, Head and Shoulders, Inverted Head and Shoulders, Triple top, Triple Bottom, Double Top, Double Bottom) Use historical data to calculate the probability of each pattern to succeed (possibility to filter notification according to the chance of success) gives graphic indication about the invalidation level and
Сигнальный трендовый индикатор. Определяет направление тренда и  окрашивается в соответствующий цвет. Имеет встроенные звуковые и визуальные оповещение о смене тренда. Может отправлять уведомления на ваш телефон или на емеил. Позволяет вести трендовую и контр трендовую торговлю. Работает на всех таймфреймах, на всех валютных парах, металлах, индексах и криптовалюте. Можно использовать при работе с бинарными опционами. Отличительные особенности Не перерисовывается; Простые и понятные настройки;
Intraday Levels показывает сетку внутридневных уровней для внутридневной торговли Показывает сетку для дневных уровней, дает ориентир для распознания тренда и для измерения внутридневных сделок (стоп-лосс и тейк-профит). Параметры: Levels Mode - Режим уровней: Basic mode: Базовый режим, показывает самый высокий, самый низкий и средний уровни. Advanced mode: Расширенный режим, показывает самый высокий, самый низкий, средний и промежуточные уровни. Fibonacci mode: Режим Фибоначчи, показывает у
Индикаторы [ZhiBiCCI] подходят для всех циклов использования, а также подходят для всех разновидностей рынка. [ZhiBiCCI] Зеленая сплошная линия - разворот бычьей дивергенции. Зеленая пунктирная линия - классическая бычья дивергенция. [ZhiBiCCI] Сплошная линия к красному - обратная медвежья дивергенция. Красная пунктирная линия - классическая медвежья дивергенция. [ZhiBiCCI] можно установить в параметрах (Предупреждение, Отправить почту, Отправить уведомление), установить на (true) для отпр
Power Renko is an indicator which plots Renko bricks underneath the chart using a histogram. You can select the brick size and the timeframe of the Renko bricks as well as whether or not to use the close price or the high/low price of the candles. Renko bricks are based on price alone, not time, therefor the Renko bricks will not be aligned with the chart's time. They are extremely useful for trend trading and many different strategies can be formed from them. Buffers are provided allowing you t
Усовершенствованная версия бесплатного индикатора HMA Trend (для MetaTrader 4) , с возможностью статистического анализа. HMA Trend - трендовый индикатор, базирующийся на скользящей средней Хала (Hull Moving Average - HMA) с двумя периодами. HMA с медленным периодом определяет тренд, HMA с быстрым периодом - краткосрочные движения и сигналы в сторону тренда. Главные отличия от бесплатного варианта: Возможность предсказать вероятность разворота тренда с помощью анализа исторических данных; Постр
Madx Cobra Indicator. Create to traders both experienced and inexperienced to use it because it is a basic indicator How to use : Setting Indicator 1. MA Fast  : Moving Average fast (10) 2. MA Slow :  Moving Average Slow control trend markets.(200) 3. ADX : Control trend(5) 4. For alert you can set to alert Next bar or instant bars.  When arrow sky blue show or arrow up, you can entry order "Buy" or "Long" and arrow red show or arrow down, you can entry order "Sell" or "Short" Setting s
Индикатор поддержки и сопротивления для бинарных опционов Этот индикатор разработан специально для торговли бинарными опционами и отлично показывает откаты от уровней поддержки и сопротивления. Сигналы появляются на текущей свече. Красная стрелка, направленная вниз, указывает на потенциальную возможность продажи, а синяя стрелка, направленная вверх, предлагает возможности для покупки. Все, что вам нужно настроить, это цвет сигнальных стрелок. Рекомендуется использовать его на таймфреймах M1-M5,
This indicator Pluuto Alert indicator.Indicator displays trend movement. Indicator calculates automatically line.Alert = arrow.When the alert is up the next alert is down,when the alert is down the next alert is up (new bar). Features FiltPer - displays indicator period.Line1. FiltPer2 - displays indicator period.Line2. Multiplier - displays indicator multiplier.(FlitPer,Line1;step) Deviation1 - displays indicator deviation.(Line2) Deviation2 - displays indicator deviation.(Arrow) Trend - displ
Прежде всего стоит подчеркнуть, что эта торговая система является индикатором без перерисовки, без перекрашивания и без задержек, что делает ее идеальной для профессиональной торговли. Онлайн-курс, руководство пользователя и демонстрация. Торговая система "Умная система торговли на уровнях поддержки и сопротивления" является продвинутым индикатором, созданным для новичков и опытных трейдеров. Он дает трейдерам точность и уверенность на рынке Форекс. Эта всесторонняя система объединяет 7+ ст
This indicator takes input from the RSI from multiple time frames (M/W/D/H4/H1/M30), and presents the output as lines above or below the price, on the main chart. Great for scalping. Features alerts for the current time frame's RSI (the Arrows). Settings: RSI period settings for M/W/D/H4/H1/M30/Current. (Set to your preference) PSar settings for trend determination; for current chart's time frame. How to use: Simply attach to M5 (Scalping - zoom chart out completely on M5) or use on higher time
Strong Retracement Points Pro demo edition! SRP (Strong Retracement/Reversal Points) is a powerful and unique support and resistance indicator. It displays the closest important levels which we expect the price retracement/reversal! If all level are broken from one side, it recalculates and draws new support and resistance levels, so the levels might be valid for several days depending on the market! If you are still hesitating to start using this wonderful tool, you can check this link to see h
The Volumebyprice.com Indicator for MetaTrader 4 features Volume Profile and Market Profile TPO (Time Price Opportunity). Volume and TPO histogram bar and line charts. Volume Footprint charts. TPO letter and block marker collapsed and split structure charts. Static, dynamic and flexible range segmentation and compositing methods with relative and absolute visualizations. Session hours filtering and segment concatenation with Market Watch and custom user specifications. Graphical layering, posit
Прежде всего стоит подчеркнуть, что этот Торговый Инструмент является Неперерисовывающимся Нерепейнтинговым Индикатором, что делает его идеальным для профессиональной торговли. Онлайн-курс, руководство пользователя и демонстрация. Индикатор Концепций Умного Действия Цены - очень мощный инструмент как для новичков, так и для опытных трейдеров. Он объединяет более 20 полезных индикаторов в одном, комбинируя передовые торговые идеи, такие как анализ Inner Circle Trader и стратегии торговли конц
Determined Trend - это стрелочный индикатор для определения тренда.  Нужно понимать, что любой стрелочный индикатор – это только визуальная форма сигнала. Как правило, такие индикаторы Форекс содержат в себе целую торговую систему, обрабатывают информацию от нескольких технических инструментов и появление его «стрелки» ? конечный результат расчета. Индикатор сам оценивает, насколько сильный сигнал возникает на рынке, сигнализирует об этом, а трейдеру остается только принять торговое решение. 
Sto Signal AM
Andriy Matviyevs'kyy
5 (1)
Данный индикатор отображает на графике цены сигналы Stochastic osc и предоставляет возможность пользователю получать уведомления о таких сигналах. Индикатор  Stochastic является классическим и проверенным индикатором технического анализа рынков. Несмотря на свой возраст актуален и на данный момент.  В зависимости от настроек индикатор позволяет эффективно работать на различных TF и любых рынках. Сигналы подаются на полностью сформированных барах и не перерисовываются.   Настраиваемые параметры
FREE
С этим продуктом покупают
Gann Made Easy - это профессиональная, но при этом очень простая в применении Форекс система, основанная на лучших принципах торговли по методам господина У.Д. Ганна. Индикатор дает точные BUY/SELL сигналы, включающие в себя уровни Stop Loss и Take Profit. Пожалуйста, напишите мне после покупки! Я поделюсь своими рекомендациями по использованию индикатора. Также вас ждет отличный бонусный индикатор в подарок! Вероятно вы уже не раз слышали о торговли по методам Ганна. Как правило теория Ганна от
Прежде всего стоит подчеркнуть, что этот торговый индикатор не перерисовывается, не перерисовывает и не отставает, что делает его идеальным как для ручной, так и для роботизированной торговли. Руководство пользователя: настройки, вводы и стратегия. Атомный аналитик - это индикатор ценового действия PA, который использует силу и импульс цены, чтобы найти лучший край на рынке. Оборудованный расширенными фильтрами, которые помогают убирать шумы и ложные сигналы, и повышают торговый потенциал. Испо
Инновационный индикатор, использующий эксклюзивный алгоритм для быстрого и точного определения тренда. Индикатор автоматически рассчитывает время открытия и закрытия позиций, а также подробную статистику работы индикатора на заданном отрезке истории, что позволяет выбрать наилучший торговый инструмент для торговли. Вы также можете подключить свои пользовательские стрелочные индикаторы к Scalper Inside Pro для проверки и расчета их статистики и прибыльности. Scalper Inside PRO инструкция и настро
Currency Strength Wizard — очень мощный индикатор, предоставляющий вам комплексное решение для успешной торговли. Индикатор рассчитывает силу той или иной форекс-пары, используя данные всех валют на нескольких тайм фреймах. Эти данные представлены в виде простых в использовании индексов валют и линий силы валют, которые вы можете использовать, чтобы увидеть силу той или иной валюты. Все, что вам нужно, это прикрепить индикатор к графику, на котором вы хотите торговать, и индикатор покажет вам ре
В настоящее время скидка 20%! Лучшее решение для новичка или трейдера-эксперта! Эта приборная панель работает на 28 валютных парах. Он основан на 2 наших основных индикаторах (Advanced Currency Strength 28 и Advanced Currency Impulse). Он дает отличный обзор всего рынка Forex. Он показывает значения Advanced Currency Strength, скорость движения валюты и сигналы для 28 пар Forex на всех (9) таймфреймах. Представьте, как улучшится ваша торговля, когда вы сможете наблюдать за всем рынком с пом
Reversal First Impulse levels (RFI)        INSTRUCTIONS     RUS    -      ENG           Рекомендуем использовать с  индикатором -  TPSpro  TREND PRO -  Version MT5 Важным ключевым элементом в трейдинге являются зоны или уровни, от которых принимаются решения о покупке или продаже торгового инструмента. Несмотря на попытки крупных игроков скрыть свое присутствие на рынке, они неизбежно оставляют следы. Наша задача заключалась в том, чтобы научиться находить эти следы и правильно их интерпретирова
Получайте ежедневную информацию о рынке с подробностями и скриншотами через наш утренний брифинг здесь, на mql5 , и в Telegram ! FX Power MT4 NG - это новое поколение нашего популярного измерителя силы валют FX Power. Что же предлагает этот измеритель силы нового поколения? Все, что вы любили в оригинальном FX Power ПЛЮС Анализ силы GOLD/XAU Еще более точные результаты расчетов Индивидуально настраиваемые периоды анализа Настраиваемый предел расчета для еще более высокой производительности Спец
M1 Arrow
Oleg Rodin
4.73 (15)
Внутридневная стратегия, основанная на двух фундаментальных принципах рынка. В основе алгоритма лежит анализ объемов и ценовых волн с применением дополнительных фильтров. Интеллектуальный алгоритм индикатора дает сигнал только тогда, когда два рыночных фактора объединяются в одно целое. Индикатор рассчитывает волны определенного диапазона, а уже для подтверждения волны индикатор использует анализ по объемам. Данный индикатор - это готовая торговая система. Все что нужно от трейдера - следовать с
Gold Channel is a volatility-based indicator, developed with a specific timing algorithm for the XAUUSD pair, which consists of finding possible corrections in the market. This indicator shows two outer lines, an inner line (retracement line) and an arrow sign, where the theory of the channel is to help identify overbought and oversold conditions in the market. The market price will generally fall between the boundaries of the channel. If prices touch or move outside the channel it is a tra
FX Volume
Daniel Stein
4.61 (36)
Получайте ежедневную информацию о рынке с подробностями и скриншотами в нашем утреннем брифинге здесь, на mql5 , и в Telegram ! FX Volume - это ПЕРВЫЙ и ЕДИНСТВЕННЫЙ индикатор объема, который дает РЕАЛЬНОЕ представление о настроении рынка с точки зрения брокера. Он дает потрясающее представление о том, как институциональные участники рынка, такие как брокеры, позиционируют себя на рынке Forex, гораздо быстрее, чем отчеты COT. Видеть эту информацию прямо на своем графике - это настоящий геймчей
В НАСТОЯЩЕЕ ВРЕМЯ СКИДКА 26% Лучшее решение для новичка или трейдера-эксперта! Этот индикатор является уникальным, высококачественным и доступным торговым инструментом, поскольку мы включили в него ряд собственных функций и новую формулу. С помощью всего лишь ОДНОГО графика вы можете определить силу валюты для 28 пар Форекс! Представьте, как улучшится ваша торговля, потому что вы сможете точно определить точку запуска нового тренда или возможность скальпирования? Руководство пользователя:
The AT Forex Indicator MT4 is a sophisticated trading tool designed to provide traders with a comprehensive analysis of multiple currency pairs. This   powerful indicator   simplifies the complex nature of the forex market, making it accessible for both novice and experienced traders. AT Forex Indicator uses   advanced algorithms   to detect trends, patterns and is an essential tool for traders aiming to enhance their forex trading performance. With its robust features, ease of use, and reliabl
TPSproTREND PrO
Roman Podpora
4.78 (18)
TPSpro TRENDPRO   —  трендовый индикатор, который автоматически анализирует рынок и предоставляет информацию о тренде и каждой его смене а также дающий сигналы для входа в сделки без перерисовки! Индикатор использует каждую свечу, анализируя их отдельно. относя к разным импульсам – импульс вверх или вниз. Точные точки входа в сделки  для  валют, крипты, металлов, акций, индексов! -  Version MT5             ПОЛНОЕ ОПИСАНИЕ ИНДИКАТОРА           Рекомендуем использовать с  индикатором -  RFI LEVE
" All in One Chart Patterns"  Текущая цена будет действовать только первые 3 дня, окончательная цена составит 150$. Этот индикатор объединяет несколько графических паттернов в один единый инструмент для MetaTrader 4 (MT4). Он предоставляет возможность включать или отключать каждый паттерн прямо с графика, что позволяет настраивать и проводить анализ более эффективно. Вот подробное описание индикатора и включенных в него паттернов: Включенные паттерны: Паттерн 1-2-3 Описание : Этот паттерн испол
Advanced Supply Demand
Bernhard Schweigert
4.92 (313)
Этот индикатор является уникальным, качественным и доступным инструментом для торговли, включающим в себя наши собственные разработки и новую формулу. В обновленной версии появилась возможность отображать зоны двух таймфреймов. Это означает, что вам будут доступны зоны не только на старшем ТФ, а сразу с двух таймфреймов - таймфрейма графика и старшего: отображение вложенных зон. Обновление обязательно понравится всем трейдерам, торгующим по зонам спроса и предложения. Важная информация Для мак
PZ Day Trading
PZ TRADING SLU
3.67 (3)
Этот индикатор обнаруживает разворот цены зигзагообразно, используя только анализ ценового действия и канал Дончиана. Он был специально разработан для краткосрочной торговли, без перекраски или перекраски вообще. Это фантастический инструмент для проницательных трейдеров, стремящихся увеличить сроки своих операций. [ Руководство по установке | Руководство по обновлению | Устранение неполадок | FAQ | Все продукты ] Удивительно легко торговать Это обеспечивает ценность на каждом таймфрейме Ре
Cycle Sniper
Elmira Memish
4.41 (37)
NEW YEAR SALE PRICE FOR LIMITED TIME!!! Please contact us after your purchase and we will send you the complimentary indicators to complete the system Cycle Sniper is not a holy grail but when you use it in a system which is explained in the videos, you will feel the difference. If you are not willing to focus on the charts designed with Cycle Sniper and other free tools we provide, we recommend not buying this indicator. We recommend watching the videos about the indiactor and system before pu
Dear Traders this is my another tool called " Swing Master Indicator ". As the name above the indicator is designed to help you in swing trading by capturing the low and highs of the price. You may us this tool with any trading strategy and style from scalping to position trading. It is made for level of traders including newbies and advanced traders even prop-firms, hedge funds and banks to help them make sold market analysis. I create tools for serious traders who want to make a difference in
Представляем       Quantum Breakout PRO   , новаторский индикатор MQL5, который меняет ваш способ торговли в зонах прорыва! Разработанная командой опытных трейдеров с опытом торговли более 13 лет,   Quantum Breakout PRO   предназначена для того, чтобы вывести ваше торговое путешествие на новые высоты благодаря своей инновационной и динамичной стратегии зон прорыва. Quantum Breakout Indicator покажет вам сигнальные стрелки на зонах прорыва с 5 целевыми зонами прибыли и предложением стоп-лос
ECM Elite Channel is a volatility-based indicator, developed with a specific time algorithm, which consists of finding possible corrections in the market. This indicator shows two outer lines, an inner line (retracement line) and an arrow sign, where the channel theory is to help identify overbought and oversold conditions in the market. The market price will generally fall between the boundaries of the channel. If prices touch or move outside the channel, it's a trading opportunity. The
Best Currency Strength Indicator
Tumelo Patrick Rakotsoane
4.6 (47)
Advanced Currency Strength Indicator The Advanced Divergence Currency Strength Indicator. Not only it breaks down all 28 forex currency pairs and calculates the strength of individual currencies across all timeframes , but, You'll be analyzing the WHOLE forex market in 1 window (In just 1 minute) . This indicator is very powerful because it reveals the true movements of the market.  It is highly recommended to  analyze charts knowing the performance of individual currencies or the countries ec
Legacy of Gann
Pavel Zamoshnikov
4.85 (13)
Индикатор очень точно определяет уровни возможного окончания тренда и фиксации профита. Метод определения уровней основан на идеях В.Д.Ганна (W.D.Gann), с использованием алгоритма, разработанного его последователем Кириллом Боровским. Чрезвычайно высокая достоверность достижения уровней (по словам К.Боровского  – 80-90%) Незаменим для любой торговой стратегии – каждому трейдеру необходимо определить точку выхода из рынка! Точно определяет цели на любых таймфремах и любых инструментах (форекс, ме
Индикатор для ручной торговли и технического анализа для Forex. Состоит из трендового индикатора с уровнем открытия торгового дня и стрелочного индикатора для определения точек входа. Индикатор не перекрашивается, работает по закрытию свечи. Содержит несколько типов оповещений для сигнальных стрелок. Можно настроить для работы на любом графике, торговом инструменте или тайм-фрейме. Стратегия работы базируется на поиске движений цены по тренду. Для совершения сделок " Buy ": Трендова
TrendMaestro
Stefano Frisetti
5 (3)
note: this indicator is for METATRADER4, if you want the version for METATRADER5 this is the link:  https://www.mql5.com/it/market/product/108106 TRENDMAESTRO ver 2.4 TRENDMAESTRO recognizes a new TREND in the bud, he never makes mistakes. The certainty of identifying a new TREND is priceless. DESCRIPTION TRENDMAESTRO identifies a new TREND in the bud, this indicator examines the volatility, volumes and momentum to identify the moment in which there is an explosion of one or more of these data a
СЕЙЧАС СКИДКА 31% !!! Лучшее решение для новичка или трейдера-эксперта! Этот индикатор является уникальным, высококачественным и доступным торговым инструментом, поскольку мы включили в него ряд собственных функций и секретную формулу. Всего на ОДНОМ графике он выдает алерты по всем 28 валютным парам. Представьте, как улучшится ваша торговля, ведь вы сможете точно определить точку запуска нового тренда или возможность скальпирования! Построенный на новых базовых алгоритмах, он позволяет е
Индикатор CandlestickPatterns для MetaTrader 4 (MT4) представляет собой комплексный инструмент, предназначенный для идентификации и выделения ключевых свечных моделей на торговых графиках. Этот индикатор обладает высокой настраиваемостью, позволяя трейдерам выбирать, какие модели отображать и как их представлять, что повышает их способность принимать обоснованные торговые решения на основе технического анализа. Особенности Настраиваемые свечные модели Индикатор идентифицирует 12 основных свечных
NAM Order Blocks
NAM TECH GROUP, CORP.
5 (1)
Индикатор обнаружения блоков ордеров мультитаймфреймов MT4. Функции - Полностью настраиваемая панель управления графиком, обеспечивает полное взаимодействие. - Скрыть и показать панель управления где угодно. - Обнаружение OB на нескольких таймфреймах. - Выберите количество OB для отображения. - Различные пользовательские интерфейсы OB. - Различные фильтры по OB. - Оповещение о близости OB. - Линии ADR High и Low. - Служба уведомлений (Экранные оповещения | Push-уведомления).
PipFinite Exit Scope
Karlo Wilson Vendiola
4.95 (21)
Did You Have A Profitable Trade But Suddenly Reversed? Exiting a trade is equally important as entering! Exit Scope helps maximize your current trade profit and avoid turning winning trades to losers. Attention Exit Signals are NOT to be used in entering a trade! Exit means closing your trades to avoid correction/reversal which can wipe out existing profit or haunt break-even orders. Please watch presentation (Click Here) Features Generates instant exit signals based on price action, volat
ICT, SMC, SMART MONEY CONCEPTS, SMART MONEY, Smart Money Concept, Support and Resistance, Trend Analysis, Price Action, Market Structure, Order Blocks, BOS/CHoCH,   Breaker Blocks ,  Momentum Shift,   Supply&Demand Zone/Order Blocks , Strong Imbalance, HH/LL/HL/LH,    Fair Value Gap, FVG,  Premium  &   Discount   Zones, Fibonacci Retracement, OTE, Buy Side Liquidity, Sell Side Liquidity, BSL/SSL Taken, Equal Highs & Lows, MTF Dashboard, Multiple Time Frame, BigBar, HTF OB, HTF Market Structure, 
Indicator : RealValueIndicator Description : RealValueIndicator is a powerful tool designed specifically for trading on the EURUSD pair. This indicator analyzes all EUR and USD pairs, calculates their real currency strength values, and displays them as a single realistic value to give you a head start on price. This indicator will tell you moves before they happen if you use it right. RealValueIndicator allows you to get a quick and accurate overview of the EURUSD currency pair tops and bottoms,
Другие продукты этого автора
Индикатор отображает движения уровни Фибоначчи и треугольники на таймфреймах M1-W1. Параметры InDepth: параметр глубины. InDeviation: параметр отклонения. InBackstep: количество баров в истории. Fibonacci Expansion: отображать уровни Фибоначчи. true/false Triangle: отображать треугольники. true/false Интерпретация статусов: Если треугольник зеленого цвета, тренд направлен вверх. Если треугольник красного цвета, тренд направлен вниз.
Этот индикатор отображает направление движения тренда. Параметры Trend: отображать надпись о направлении движения тренда, true/false. X: смещает надпись о направлении тренда влево/вправо. Y: смещает надпись о направлении тренда вверх/вниз. Интерпретация статусов: M1 – минутный таймфрейм. Если квадрат зеленого цвета, тренд направлен вверх. Если квадрат красного цвета, тренд направлен вниз. M5 – пятиминутный таймфрейм. Если квадрат зеленого цвета, тренд направлен вверх. Если квадрат красного цве
Индикатор отображает направление движения тренда. Параметры XRMultiplier: множитель XR. Line: движение линии (true/false). XRzak: движения XRzak (true/false). Arrow1: движения стрелки (true/false). Arrow2: движения стрелки вверх и вниз (true/false). Trend: движения тренда (true/false). X: переместить тренд влево/вправо. Y: переместить тренд вверх/вниз. Расшифровка: Зеленая стрелка – восходящий тренд. Красная стрелка – нисходящий тренд.
Индикатор отображает направление движения тренда. Параметры XRMultiplier1: множитель XR 1. XRMultiplier2: множитель XR 2. Line1: движение линии 1 (true/false). Line2: движение линии 2 (true/false). XRTrend: тренд XR отображает движения линий 1 и 2 (true/false). X: переместить тренд влево/вправо. Y: переместить тренд вверх/вниз. Расшифровка: Зеленая линия - восходящий тренд. Красная линия - нисходящий тренд.
This indicator zone indicator.Indicator displays high and low zone. Features Green color - Shows movement on the high zone. Red colr - Shows movement on the low zone. Yellow colr - Shows movement on the zero zone.    How to understand the status: If the bar is higher than the yellow color line , trend is up. If the bar is lower than the yellow color line , trend is down.
This indicator super indicator.Indicator displays trend movement. Indicator calculates automatically bars Features FiltPer - displays indicator period. Multiplier - displays indicator multiplier. How to understand the status: If the indicator bar is higher , trend is up. If the indicator bar is lower , trend is down. IIIIIIIIIIIIIIIIIIIIIIIIIIIIIIIIIIIIIIIIIIIIIIIIIIIIIIIIIIIIIIIIIIIIII
This indicator displays super power trend movement. Features Multiplier - displays multiplier movement. Multiplier2 - displays multiplier2 movement. Trend - displays indicator trend 1 and trend 2 (true/false). separate_windor - displays trend separate window.(0-1....) X - move the trend left and right. Y - move the trend up and down. How to understand the status: If the Trend color is green, trend is up. If the Trend color is red, trend is down.
This indicator displays Super Power  Beeta trend movement.Indicator is version 2 . Features Multiplier - displays multiplier movement. Multiplier2 - displays multiplier2 movement. Trend - displays indicator trend 1 and trend 2 (true/false). Background:color - displays background color (true/false). separate_window - displays trend separate window.(0-1....) separate_window2 - displays trend (background color )separate window.(1-2....) X - move the trend left and right. Y - move the trend up
This indicator displays XR Power Trend movement.Indicator displays Moving Average period 5,Moving Average period 26,Moving Average period 52,Commodity Channel Index,MACD,Average Directional Movement Index,Bulls Power,Bears Power,Stochastic Oscillator,Relative Strength Index,Force Index,Momentum,DeMarker,average movement.Indicators period is standard period.    Features X - move the trend left and right. Y - move the trend up and down. How to understand the status: If the Trend color is green
This indicator Master XR indicator.Indicator displays trend movement. Indicator calculates automatically line. Features FiltPer - displays indicator period. deviation - displays indicator deviation. deviation2 - displays indicator deviation. How to understand the status: If (Timeframe M1-H1) FiltPer = 100; If ( Timeframe H4-MN) FiltPer = 5-20; ////////////////////////////////////////////////////////////////////////////////////////////////////////////////////////////////////////////////////// /
This indicator Super MA Pluss indicator.Indicator displays trend movement. Indicator calculates automatically line. Features FiltPer - displays indicator period. How to understand the status: If the arrow is green, trend is up. If the arrow is red, trend is down. /////////////////////////////////////////////////////////////////////////////////////////////////////////////////////////////////////////////////// //////////////////////////////////////////////////////////////////////////////////////
This indicator Super Channel Arrow and zak indicator.Indicator displays trend movement. Indicator calculates automatically line. Features FiltPer - displays indicator channel period. FiltPer2 - displays indicator period. deviation - displays indicator channel deviation. How to understand the status: If the arrow is green, trend is up. If the arrow is red, trend is down. best FiltPer ,period timeframe M1-H1 (100);H4-MN (50) best FiltPer2, period timeframe M1-H1 (50);H4-MN (25) /////////////////
This indicator Super Channel Pro indicator.Indicator displays trend movement. Indicator calculates automatically line. Features FiltPer - displays indicator channel period. deviation - displays indicator channel deviation. deviation2 - displays indicator channel deviation. How to understand the status: If the arrow is green, trend is up. If the arrow is red, trend is down. //////////////////////////////////////////////////////////////////////////////////////////////////////////////////////////
This indicator Super Channel Pro Pluss indicator.Indicator displays trend movement. Indicator calculates automatically line. Features FiltPer - displays indicator channel period. deviation - displays indicator channel deviation. deviation2 - displays indicator channel deviation. deviation3 - displays indicator channel deviation. How to understand the status: If the arrow is up and line color Teal ;trend is up. If the arrow is down and line color Red; trend is down. If the arrow is Yellow close
This indicator Super XT indicator.Indicator displays trend movement. Indicator calculates automatically line. Features FiltPer - displays indicator period. Window - displays indicator trend (true/false). Trend - displays indicator trend (true/false). X - move the trend left and right. Y - move the trend up and down.     How to understand the status: If the Trend color is green, trend is up. If the Trend color is red, trend is down. ///////////////////////////////////////////////
This indicator Super Turbo indicator.Indicator displays trend movement. Indicator calculates automatically line. Features FiltPer - displays indicator period. Step - displays indicator Step. Trend - displays indicator trend (true/false). X - move the trend left and right. Y - move the trend up and down. How to understand the status: If the Trend color is green, trend is up. If the Trend color is red, trend is down. ////////////////////////////////////////////////////////////////////
This indicator Pluuto Alert indicator.Indicator displays trend movement. Indicator calculates automatically line.Alert = arrow.When the alert is up the next alert is down,when the alert is down the next alert is up (new bar). Features FiltPer - displays indicator period.Line1. FiltPer2 - displays indicator period.Line2. Multiplier - displays indicator multiplier.(FlitPer,Line1;step) Deviation1 - displays indicator deviation.(Line2) Deviation2 - displays indicator deviation.(Arrow) Trend - displ
This indicator Pluuto Alert Plus indicator.Indicator displays trend movement. Indicator calculates automatically line.Alert = FiltPer.When the alert is up the next alert is down,when the alert is down the next alert is up (new bar). Features FiltPer - displays indicator period.Line1. FiltPer2 - displays indicator period.Line2. Multiplier - displays indicator multiplier.(FlitPer,Line1;step) Deviation1 - displays indicator deviation.(Line2) Deviation2 - displays indicator deviation.(Line2) Deviat
This indicator Pluuto Alert Pro indicator.Indicator displays trend movement. Indicator calculates automatically line.Alert = (FiltPer1,Line1_Arrow).When the alert is up the next alert is down,when the alert is down the next alert is up (new bar). Features FiltPer1 - displays indicator period.Per1 FiltPer2 - displays indicator period.Per2. FiltPer3 - displays indicator period.Per3. Multiplier1_per1 - displays indicator multiplier.(FlitPe1,step) Multiplier2_line1 - displays indicator multiplier.(L
This indicator XX Power indicator.Indicator displays trend movement. Indicator helps to buy and sell.In dicator displays arrow and line. Features FiltPer - displays indicator period. How to understand the status:   If the Trend color is green, trend is up. I f the Trend color is red, trend is down.    //////////////////////////////////////////////////////////////////////////////////////////////////////////////////////////////////////////////////// ///////////////////////////////////////
This indicator Matrix X indicator.Indicator displays Stochastic oscillator,Williams Percent Range,DeMarker,Relative Strength Index,Matrix trend movement. Indicator helps to buy and sell.Matrix trend = (Stochastic+WPR+DeMarker+RSI)/4. Features KPeriod - displays Stochastic K period. DPeriod - displays Stochastic D period. Slowing- displays Stochastic Slowing. Stochastic_Method - displays Stochastic Method. Stochastic_price - displays Stochastic Price. WPR_per - displays WPR period. Dem_per - dis
This indicator Mega Super indicator.Indicator displays trend movement. Indicator helps to buy and sell.In dicator displays arrow and line. Features per - displays indicator period. How to understand the status: If the arrow color is green, trend is up. I f the arrow color is red, trend is down. //////////////////////////////////////////////////////////////////////////////////////////////////////////////////////////////////////////////////// //////////////////////////////////////////////
This indicator Matic indicator.Indicator displays trend movement. Indicator helps to buy and sell. The indicator shows the movement of sak1 and sak2 Stddevchannel, Regression. Features HLper - displays indicator iHighest and iLowest period. ExtDepth - displays indicator ExtDepth. ExtDeviation - displays indicator ExtDeviation. ExtBackstep - displays indicator ExtBackstep. zak1_ST_RE - displays indicator zak1,Stddevchannel,Regression.(true,false) zak2_ST_RE - displays indicator zak2,Stddevchannel
This indicator Matic Pro indicator.Indicator displays trend movement. Indicator helps to buy and sell. The indicator shows the movement of sak1 and sak2 Stddevchannel, Regression + zak2 indicator. Features HLper - displays indicator iHighest and iLowest period. ExtDepth - displays indicator ExtDepth. ExtDeviation - displays indicator ExtDeviation. ExtBackstep - displays indicator ExtBackstep. p - line indicator bars back.(bars back= zak2) m - regression.(1-8),the best(2-3) i0 -line indicator b
This indicator Super Neuro Trend indicator.Indicator displays trend movement. Indicator helps to buy and sell. Features FiltPer- displays indicator period. deviation - displaus indicator deviation. Trend - displaus indicator trend.( true,false) Rectangle - displaus indicator rectangle. (true,false)  How to understand the status: If the trend color is green, trend is up. I f the trend color is red, trend is down. I f the trend waiting,trend waiting.     /////////////////////////////////////////
This indicator Mega Super Neuro Trend indicator.Indicator displays trend movement. Indicator helps to buy and sell.Trend1= line1 > < line1,trend2=line1 > < line2,trend3 = line1,line2  > < line3. Features Trend - displaus indicator trend.( true,false) How to understand the status: If the trend color is green, trend is up. I f the trend color is red, trend is down. ////////////////////////////////////////////////////////////////////////////////////////////////////////////////////////////////
This indicator XRX Master indicator.Indicator displays trend movement. Indicator helps to buy and sell. Features FiltPer- displays indicator period. deviation - displaus indicator deviation. deviation2 - displaus indicator deviation 2. HL_period - displaus indicator Highest and Lowest period. HL_period2 - displaus indicator Highest 2 and Lowest 2 period. How to understand the status: If the trend color arrow is green, trend is up. I f the trend color arrow is red, trend is down. //////
Фильтр:
Нет отзывов
Ответ на отзыв