• Обзор
  • Отзывы (1)
  • Обсуждение (36)
  • Что нового

ACB Breakout Arrows MT5

5

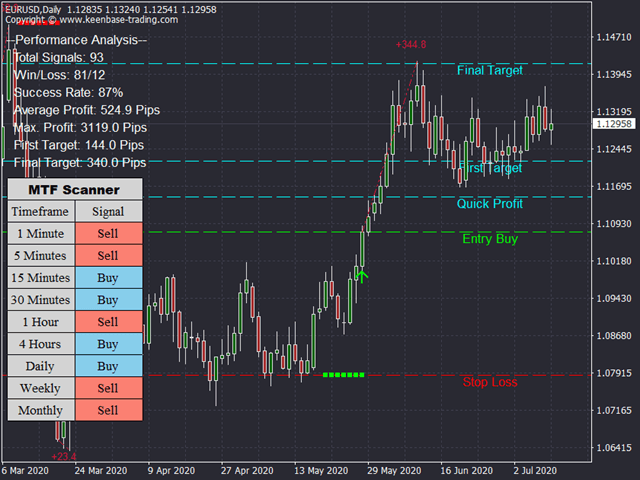
Индикатор ACB Breakout Arrows формирует важные сигналы на вход в рынок, определяя специальные паттерны пробоя. Индикатор постоянно сканирует график, ожидая появления импульса в одном направлении, и генерирует точный сигнал входа прямо перед большим движением.

Основные возможности:

  • Не перерисовывается!
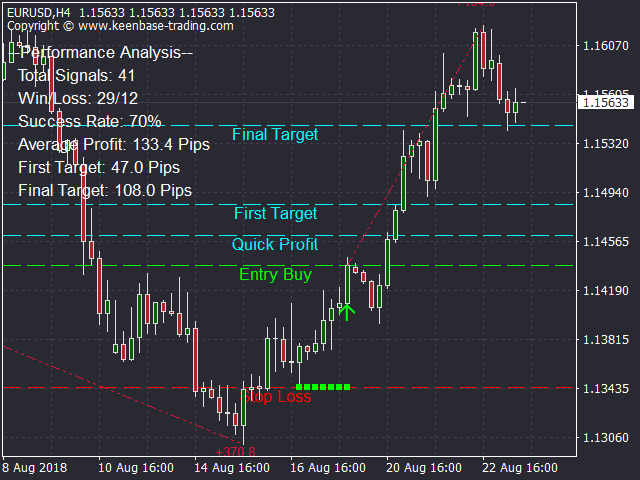
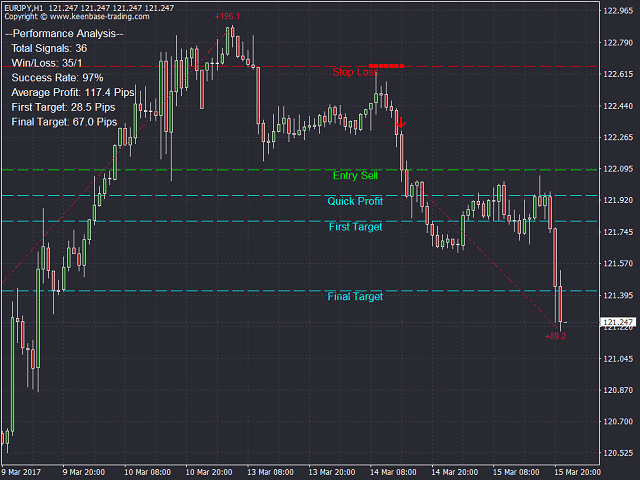
  • Показывает уровни стоп-лосс и тейк-профит.
  • Подходит для внутридневых трейдеров, свинг-трейдеров и скальперов.
  • Оптимизированный алгоритм для повышения точности сигналов.
  • Предварительно рассчитываемое соотношения риска к прибыли по каждой сделке.
  • Рекомендации по размеру лота при помощи заранее определенного процента риска по каждой сделке.
  • Специальный уровень для упрощения перемещения в безубыток или скальпинга цели (линия быстрой прибыли).


Подтверждение сделок

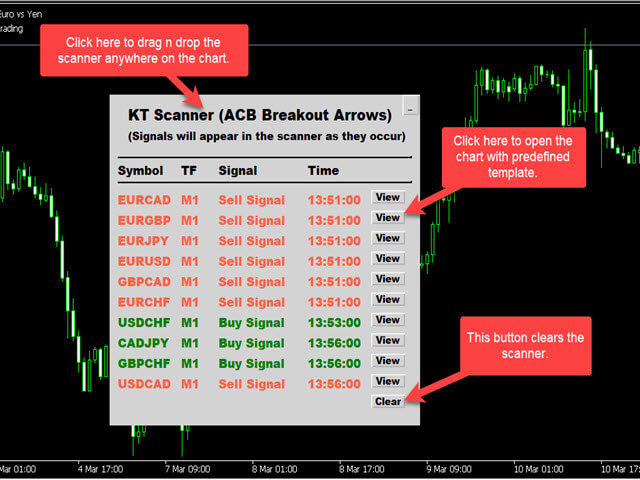
Используйте "индикатор ACB Trade Filter", чтобы отфильтровывать сделки с низкой вероятностью успеха.
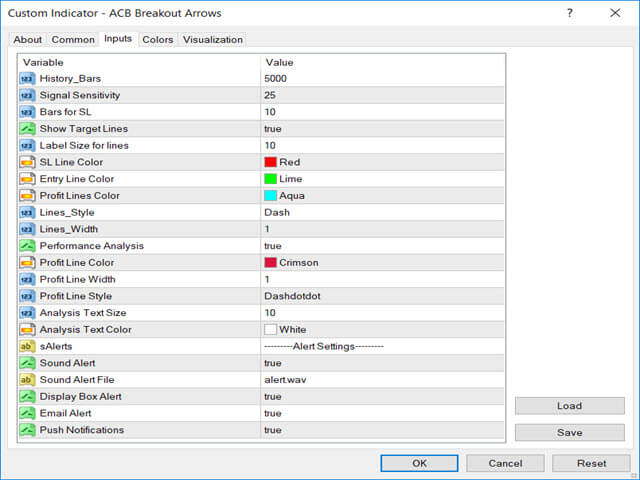

Входные параметры

  • History Bars: количество баров для расчета индикатора.
  • Signal Sensitivity: чувствительность стрелок (сила сигнала).
  • Bars for SL: количество баров для расчета стоп-лосса.
  • Display Information: показать/скрыть информацию о сигнале в верхнем левом углу графика.
  • Lot Size Information: показать/скрыть расчет размера лота для последнего сигнала.
  • Risk per trade: процент риска на сделку.
  • Show Target Lines: показать/скрыть уровни стоп-лосс, тейк-профит и быстрой прибыли.
  • Show Max Profit: включить/выключить показ линии максимальной прибыли: максимально благоприятное движение в пипсах для последнего сигнала.
  • Alert Settings: настройки оповещений - сообщение, email, push-уведомление и звуковой сигнал.


Для разработчиков

Используйте следующий код для применения индикатора в эксперте.

// Определить массив

double Buy_Arrow[];
double Sell_Arrow[];
double Buy_SL[];
double Sell_SL[];

// Определить хэндл индикатора

int ACB_handle = iCustom(_Symbol,0,"Market/ACB Breakout Arrows");


// Копировать буферы в массивы

CopyBuffer(ACB_handle,0,1,1,Buy_Arrow);
CopyBuffer(ACB_handle,1,1,1,Sell_Arrow);
CopyBuffer(ACB_handle,2,1,1,Buy_SL);
CopyBuffer(ACB_handle,3,1,1,Sell_SL);


if(Buy_Arrow[0]!=0) // Условие входа для Buy
if(Sell_Arrow[0]!=0) // Условие входа для Sell

Buy_SL[0]; // Стоп-лосс для Buy
Sell_SL[0]; // Стоп-лосс для Sell

// Получение целевых уровней с графика

double Quick_Profit = NormalizeDouble(ObjectGetDouble(0,"FirstTarget",OBJPROP_PRICE),_Digits);
double First_Target = NormalizeDouble(ObjectGetDouble(0,"Target1",OBJPROP_PRICE),_Digits);
double Final_Target = NormalizeDouble(ObjectGetDouble(0,"Target2",OBJPROP_PRICE),_Digits);
Отзывы 1
MarketWatch27378757
152
MarketWatch27378757 2022.01.05 19:20 
 

...

Рекомендуем также
The Penta-O is a 6-point retracement harmonacci pattern which usually precedes big market movements. Penta-O patterns can expand and repaint quite a bit. To make things easier this indicator implements a twist: it waits for a donchian breakout in the right direction before signaling the trade. The end result is an otherwise repainting indicator with a very reliable trading signal. The donchian breakout period is entered as an input. [ Installation Guide | Update Guide | Troubleshooting | FAQ | A
Усовершенствованная Мультитаймфреймовая версия скользящей средней Хала (Hull Moving Average - HMA). Особенности Две линии индикатора Халла разных таймфреймов на одном графике. Линия HMA старшего таймфрейма определяет тренд, а линия HMA текущего таймфрейма - краткосрочные ценовые движения. Графическая панель с данными индикатора HMA на всех таймфреймах одновременно. Если на каком-либо таймфрейме HMA переключил свое направление, на панели отображается вопросительный или восклицательный знак с тек
KT Renko Patterns MT5
KEENBASE SOFTWARE SOLUTIONS
KT Renko Patterns scans the Renko chart brick by brick to find some famous chart patterns that are frequently used by traders across the various financial markets. Compared to the time-based charts, patterns based trading is easier and more evident on Renko charts due to their uncluttered appearance. KT Renko Patterns features multiple Renko patterns, and many of these patterns are extensively explained in the book titled Profitable Trading with Renko Charts by Prashant Shah. A 100% automate
Финансовый Индикатор SolarTrade Suite: Jupiter Market Indicator - Ваш Надежный Проводник в Мире Финансовых Рынков! Это трендовый индикатор, который использует особые инновационные и передовые алгоритмы для рассчета своего значения, а также имеет приятный глазу дизайн. Понять показания этого индикатора очень просто: синий цвет - покупка, красный продажа. Проверьте другие наши продукты из серии SolarTrade Suite внизу описания. Хотите уверенно ориентироваться в мире инвестиций и финансовых
ATrend
Zaha Feiz
4.67 (3)
ATREND: Как это работает и как его использовать Как это работает Индикатор "ATREND" для платформы MT5 разработан для предоставления трейдерам надежных сигналов на покупку и продажу с использованием комбинации методов технического анализа. Этот индикатор в первую очередь использует среднюю истинную амплитуду (ATR) для измерения волатильности, наряду с алгоритмами обнаружения тренда для выявления потенциальных движений рынка. Оставьте сообщение после покупки и получите специальный бонусный подаро
Версия MT4   |   FAQ Индикатор Owl Smart Levels – это полноценная торговая система внутри одного индикатора, которая включает в себя такие популярные инструменты анализа рынка как усовершенствованные фракталы Билла Вильямса , Valable ZigZag, который строит правильную волновую структуру рынка, а также  уровни Фибоначчи, которые   отмечают точные уровни входа в рынок и места взятия прибыли. Подробное описание стратегии Инструкция по работе с индикатором Советник-помошник в торговле Owl Helper При
Upgraded - Stars added to indentify Areas you can scale in to compound on your entry  when buying or selling version 2.4 Upgraded Notifications and alerts added version 2.3 *The indicator is suitable for all pairs fromm  Deriv pairs (Vix,jump,boom & crash indices) , Currencies, cryptos , stocks(USA100, USA30 ), and metals like gold etc. How does it work? Increasing the period make it more stable hence will only focus on important entry points However  lowering the period will mean the indica
Price Breakout pattern Scanner - это полностью автоматический и мощный анализ для трейдеров и инвесторов. Он определяет следующие паттерны на графике. Голова и Плечи - Распространенный паттерн для торговли. Обратная Голова и Плечи - эта модель обратна паттерну Голова и плечи. Двойная вершина - когда цена дважды достигает уровня сопротивления и снизится к уровню поддержки, трейдер может ожидать внезапный медвежий прорыв уровня поддержки. Двойное дно - двойное дно является противоположностью формы
In MetaTrader, plotting multiple   horizontal lines   and then tracking their respective price levels can be a hassle. This indicator automatically plots multiple horizontal lines at equal intervals for setting price alerts, plotting support and resistance levels, and other manual purposes. This indicator is suitable for Forex traders who are new and looking for chances to make quick profits from buying and selling. Horizontal lines can help traders find possible areas to start trading when the
To download MT4 version please click here . This is the exact conversion from TradingView: "WaveTrend [LazyBear]" By "zeusuk3". One of the coolest indicators out there to detect overbought and oversold zones. It can be used as a part of more complicated strategy and for confirming a potential trade setup. There are buffers to use in EAs also. The indicator is loaded light and non-repaint. - You can message in private chat for further changes you need. Thanks for downloading 
МТФ-индикатор уровней поддержки и сопротивления, построенных на экстремумах индикаторов Advanced ZigZag Dynamic и/или Extended Fractals с отключаемым ценовым значением в виде меток. Для режима МТФ можно выбрать все более старшие ТФ. По умолчанию уровни строятся на основе точек индикатора "Зигзаг", можно также использовать для построения точки индикатора Фракталов совместно с Зигзагом или вместо него. Для упрощения работы и экономии процессорного времени расчёт происходит один раз на каждом баре
Способ применения Pair Trading Station Рекомендуется использовать Pair Trading Station на таймфрейме H1 с любой валютной парой. Чтобы получить сигналы на покупку и продажу, следуйте указанным ниже инструкциям по применению Pair Trading Station в терминале MetaTrader. При загрузке Pair Trading Station на график индикатор оценит доступные исторические данные на вашей платформе MetaTrader для каждой валютной пары. В самой начале на графике отобразятся исторические данные, доступные для каждой валют
Renko Gold
Ignacio Agustin Mene Franco
Renko Gold! clearly indicates the floors and ceilings where it goes from 4 lines, the line below that marks the floor in green confirming with the thinnest line clarifies the purchase entry, the same is for sale, the top line marks the ceiling and the thinnest red line marks the sale, This indicator works for all temporalities! For Forex and Synthetic Indices markets! It also works for crypto markets! Good profit! World Investor.
Прежде всего стоит подчеркнуть, что этот торговый индикатор не перерисовывается, не перерисовывает и не отставает, что делает его идеальным как для ручной, так и для роботизированной торговли. Руководство пользователя: настройки, вводы и стратегия. Атомный аналитик - это индикатор ценового действия PA, который использует силу и импульс цены, чтобы найти лучший край на рынке. Оборудованный расширенными фильтрами, которые помогают убирать шумы и ложные сигналы, и повышают торговый потенциал. Испо
No Demand No Supply MT5
Trade The Volume Waves Single Member P.C.
No Demand No Supply   This indicator identifies   No Demand –No Supply candles to your chart and plots volume bars colored according to the signal. It can be applied to all timeframes or to a specific one only. It can also be used as regular volume indicator  with exceptional future of WEIGHTED VOLUME. Furthermore is has an alert notification, sound and email when a signals occurs. The indicator does not repaint but the alert will come on two candles back due to the definition of No Demand No Su
Повысьте свой опыт торговли с Wamek Trend Consult! Разблокируйте силу точного входа на рынок с нашим передовым торговым инструментом, разработанным для выявления ранних и продолжающихся трендов. Wamek Trend Consult дает трейдерам возможность войти на рынок в идеальный момент, используя мощные фильтры, которые уменьшают ложные сигналы, повышают точность сделок и, в конечном итоге, увеличивают прибыльность. Основные характеристики: 1. Точная идентификация тренда: Индикатор Trend Consult испол
Этот индикатор покажет вам значения TP и SL (в этой валюте), которые вы уже установили для каждого ордера на графиках (закрытые от линии транзакции/ордера), что очень поможет вам оценить вашу прибыль и убыток для каждого ордера. И он также показывает вам значения PIP. Показанный формат - «Валютные значения нашей прибыли или убытка / значений PIP». Значение TP будет отображаться зеленым цветом, а значение SL — красным. По любым вопросам или для получения дополнительной информации, пожалуйста,
Your Trend Friend
Luigi Nunes Labigalini
5 (1)
The trend is your friend! Look at the color of the indicator and trade on that direction. It does not  repaint. After each candle is closed, that's the color of the trend. You can focus on shorter faster trends or major trends, just test what's most suitable for the symbol and timeframe you trade. Simply change the "Length" parameter and the indicator will automatically adapt. You can also change the color, thickness and style of the lines. Download and give it a try! There are big movements
Noize Absorption Index - is the manual trading system that measures the difference of pressure between bears forces and bulls forces. Green line - is a noize free index that showing curent situation. Zero value of index shows totally choppy/flat market.Values above zero level shows how powerfull bullish wave is and values below zero measures bearish forces.Up arrow appears on bearish market when it's ready to reverse, dn arrow appears on weak bullish market, as a result of reverse expectation.
Профиль Рынка (Market Profile) определяет ряд типов дней, которые помогают трейдеру распознать поведение рынка. Ключевая особенность - это область значений (Value Area), представляющая диапазон ценового действия, в котором произошло 70% торговли. Понимание области значений может помочь трейдерам вникнуть в направление рынка и установить торговлю с более высокими шансами на успех. Это отличное дополнение к любой системе, которую вы возможно используете. Blahtech Limited представляет сообществу Me
Inventory Retracement Trade it is designed based on one of the most popular tradingview indicator.  This is mostly combined with other popurlar trend indicator to confirm the strength of the movement. Definition Inventory Retracement Trade is quickly becoming one of the most popular ways to identify where short-term counter trend institutional inventory has subsided and when it’s time to re-enter into a trade’s original trend direction.
Terra Infinity — индикатор флета. Эта улучшенная версия индикатора CalcFlat имеет три дополнительные линии, значительно повышающие его эффективность. В отличие от своего предшественника с двумя статическими уровнями, Terra Infinity добавляет три динамические линии над основной гистограммой, которые интерпретируются следующим образом: базовая сигнальная линия, минимальная сигнальная линия, максимальная сигнальная линия. Эти линии формируются с помощью дополнительного параметра Avg, представл
Линии тренда являются наиболее важным инструментом технического анализа в торговле на рынке Форекс. К сожалению, большинство трейдеров рисуют их неправильно. Индикатор Automated Trendlines — это профессиональный инструмент для серьезных трейдеров, который поможет вам визуализировать трендовое движение рынков. Есть два типа линий тренда: бычьи линии тренда и медвежьи линии тренда. В восходящем тренде линия тренда Форекс проводится через самые низкие точки колебания ценового движения. Сое
Indicator and Expert Adviser  EA Available in the comments section of this product. Download with Indicator must have indicator installed for EA to work. Mt5 indicator alerts for bollinger band and envelope extremes occurring at the same time. Buy signal alerts occur when A bullish candle has formed below both the lower bollinger band and the lower envelope  Bar must open and close below both these indicators. Sell signal occur when A bear bar is formed above the upper bollinger band and upp
Индикатор Trend Detect сочетает в себе особенности как трендовых индикаторов, так и осцилляторов. Индикатор является удобным инструментом для выявления краткосрочных рыночных циклов и определения уровней перекупленности или перепроданности рынка. Длинную позицию можно открывать, когда индикатор начинает выходить из зоны перепроданности и пробивает нулевой уровень снизу вверх. Короткую позицию можно открывать, когда индикатор начинает выходить из зоны перекупленности и пробивает нулевой урове
The new update makes this indicator a complete tool for studying, analyzing and operating probabilistic patterns. It includes: On-chart Multi-asset percentage monitor. Configurable martingales. Twenty-one pre-configured patterns, including Mhi patterns and C3. An advanced pattern editor to store up to 5 custom patterns. Backtest mode to test results with loss reports. Trend filter. Hit operational filter. Martingale Cycles option. Various types of strategies and alerts. Confluence between patter
KT Pin Bar MT5
KEENBASE SOFTWARE SOLUTIONS
KT Pin Bar identifies the pin bar formation which is a type of price action pattern which depicts a sign of reversal or rejection of the trend. When combined with support and resistance, BRN and other significant levels, Pin Bar pattern proved to be a very strong sign of reversal. Basically, a pin bar is characterized by a small body relative to the bar length which is closed either in upper or lower 50% part of its length. They have very large wicks and small candle body. A pin bar candlest
PipFinite Trend PRO MT5
Karlo Wilson Vendiola
4.85 (573)
Стратегия пробоя для торговли по тренду, фильтрация и все необходимые функции, встроенные в один инструмент! Интеллектуальный алгоритм индикатора Trend Pro с точностью определяет тренд, отфильтровывает рыночный шум и генерирует входные сигналы и уровни выхода. Новые функции с расширенными правилами статистического расчета улучшают общую производительность этого индикатора. Важная информация Для максимального использования потенциала Trend Pro прочитайте полное описание www.mql5.com/en/blogs/
This Indicator draws Fibonacci Fan levels in two different ways. You can select whether to draw Fibonacci Fan levels based on your favourite ZigZag settings or you can let the indicator to draw Fan levels based on given number of bars or candles.  You can also set Mobile and Email notification for your favourite Fan  levels individually. With this indicator you will not have to feel lonely as the it can generate Voice alerts, which will keep you focused on your trading and remove boredom.  Prod
С этим продуктом покупают
Reversal First Impulse levels (RFI)          INSTRUCTIONS     RUS      -      ENG          Рекомендуем использовать с индикатором - TPSpro  TREND PRO -  Version MT4             Важным ключевым элементом в трейдинге являются зоны или уровни, от которых принимаются решения о покупке или продаже торгового инструмента. Несмотря на попытки крупных игроков скрыть свое присутствие на рынке, они неизбежно оставляют следы. Наша задача заключалась в том, чтобы научиться находить эти следы и правильно их
TPSpro TREND PRO   —  трендовый индикатор, который автоматически анализирует рынок и предоставляет информацию о тренде и каждой его смене а также дающий сигналы для входа в сделки без перерисовки! Индикатор использует каждую свечу, анализируя их отдельно. относя к разным импульсам – импульс вверх или вниз. Точные точки входа в сделки  для  валют, крипты, металлов, акций, индексов! Version MT4                ПОЛНОЕ ОПИСАНИЕ ИНДИКАТОРА          Рекомендуем использовать с  индикатором -  RFI LEVE
Прежде всего стоит подчеркнуть, что эта торговая система является индикатором без перерисовки, без повторной отрисовки и без задержки, что делает ее идеальной как для ручной, так и для роботизированной торговли. Онлайн курс, руководство и загрузка пресетов. «Smart Trend Trading System MT5» - это комплексное торговое решение, созданное для новичков и опытных трейдеров. Он объединяет более 10 премиальных индикаторов и предлагает более 7 надежных торговых стратегий, что делает его универсальным
MetaForecast M5
Vahidreza Heidar Gholami
5 (2)
MetaForecast предсказывает и визуализирует будущее любого рынка на основе гармонии в данных о ценах. Хотя рынок не всегда предсказуем, если существует узнаваемый паттерн в ценах, то MetaForecast способен предсказать будущее с наибольшей точностью. По сравнению с другими аналогичными продуктами, MetaForecast способен генерировать более точные результаты, анализируя тренды на рынке. Входные параметры Past size (Размер прошлых данных) Указывает количество баров, которые MetaForecast использует дл
FX Volume MT5
Daniel Stein
4.93 (14)
Получайте ежедневную информацию о рынке с подробностями и скриншотами в нашем утреннем брифинге здесь, на mql5 , и в Telegram ! FX Volume - это ПЕРВЫЙ и ЕДИНСТВЕННЫЙ индикатор объема, который дает РЕАЛЬНОЕ представление о настроении рынка с точки зрения брокера. Он дает потрясающее представление о том, как институциональные участники рынка, такие как брокеры, позиционируют себя на рынке Forex, гораздо быстрее, чем отчеты COT. Видеть эту информацию прямо на своем графике - это настоящий геймчей
Quantum Trend Sniper
Bogdan Ion Puscasu
4.79 (48)
Представляем       Индикатор Quantum Trend Sniper   , инновационный индикатор MQL5, который меняет способ определения разворотов тренда и торговли ими! Разработан командой опытных трейдеров со стажем торговли более 13 лет,       Снайперский индикатор Quantum Trend       разработан, чтобы вывести ваше торговое путешествие на новые высоты благодаря инновационному способу определения разворотов тренда с чрезвычайно высокой точностью. ***Купите индикатор Quantum Trend Sniper и получите индикатор
Сейчас 147 долл. США (увеличиваясь до 499 долл. США после нескольких обновлений) - неограниченные учетные записи (ПК или Mac) Руководство пользователя + Обучающие видео + Доступ к приватному Discord-каналу + VIP-статус и мобильная версия + Лицензия на 5 ПК с неограниченным количеством аккаунтов и терминалов MT4. Сколько раз вы покупали индикатор торговли с замечательными обратными тестами, доказательствами производительности на живых счетах и зашикарными цифрами и статистикой, но после испо
TPA True Price Action indicator reveals the true price action of the market makers through 100% non-repainting signals strictly at the close of a candle! TPA shows entries and re-entries, every time the bulls are definitely stronger than the bears and vice versa. Not to confuse with red/green candles. The shift of power gets confirmed at the earliest stage and is ONE exit strategy of several. There are available now two free parts of the TPA User Guide for our customers. The first "The Basics"
SwingVolumePro
Thalles Nascimento De Carvalho
Обзор SwingVolumePro — это продвинутый и универсальный индикатор, разработанный для применения к широкому спектру финансовых активов и поддержки различных стилей торговли. Разработанный на основе строгого анализа объема и цены, он предлагает четкие и точные сигналы, которые позволяют трейдерам любого уровня принимать обоснованные решения на основе высококачественных данных. Основные характеристики Универсальность: SwingVolumePro может применяться к различным активам, включая акции, форе
note: this indicator is for METATRADER4, if you want the version for METATRADER5 this is the link:  https://www.mql5.com/it/market/product/108106 TRENDMAESTRO ver 2.4 TRENDMAESTRO recognizes a new TREND in the bud, he never makes mistakes. The certainty of identifying a new TREND is priceless. DESCRIPTION TRENDMAESTRO identifies a new TREND in the bud, this indicator examines the volatility, volumes and momentum to identify the moment in which there is an explosion of one or more of these data a
Gartley Hunter Multi - Индикатор для поиска гармонических моделей одовременно на десятках торговых инструментов и на всех возможных ценовых диапазонах. Инструкция/Мануал ( Обязательно читайте перед приобретением ) | Версия для МТ4 Преимущества 1. Паттерны: Гартли, Бабочка, Акула, Краб. Летучая мышь, Альтернативная летучая мышь, Глубокий краб, Cypher 2. Одновременный поиск паттернов на десятках торговых инструментов и на всех возможных таймфреймах 3. Поиск паттернов всех возможных размеров. От
Native Channels
BeeXXI Corporation
5 (1)
Данный индикатор распознает все уровни поддержки и сопротивления. Применены ряд уникальных высокопроизводительных методик, которые сделали возможным существование данного индикатора. Естественным образом видны все сформированные каналы:   горизонтальные линейные линейные параболические кубические (Полином 3 степени - Волна) Это происходит благодаря связке аппроксимирующих каналов. Сформированные каналы в иерархической последовательности образуют "стоячие волны". Таким образом видны все уров
The AT Forex Indicator MT5 is a sophisticated trading tool designed to provide traders with a comprehensive analysis of multiple currency pairs. This powerful indicator simplifies the complex nature of the forex market, making it accessible for both novice and experienced traders. AT Forex Indicator uses advanced algorithms to detect trends, patterns and is an essential tool for traders aiming to enhance their forex trading performance. With its robust features, ease of use, and reliable signal
Bill Williams Advanced предназначен для автоматического анализа графика по системе " Profitunity " Билла Уильямса. Индикатор анализирует сразу четыре таймфрейма. Инструкция/Мануал ( Обязательно читайте перед приобретением ) Преимущества 1. Автоматически анализирует график по системе "Profitunity" Билла Уильямса. Найденные сигналы помещает в таблицу в углу экрана. 2. Оснащён трендовым фильтром по индикатору Аллигатор. Большинство сигналов системы рекомендуется использовать только по тренду.
Следуйте тренду. Да, дождитесь сигнала на вход, будь то покупка или продажа, на 15-минутном фрейме и проверьте сигнал, если он появится на 30-минутном фрейме (иногда для появления сигнала требуется час или больше. Вы можете вернуться на 15-минутный фрейм и вернитесь к 30-минутному фрейму и повторяйте это до тех пор, пока у вас не появится основной сигнал. Если сигнал появляется на 30-минутном фрейме, входите по цене и фиксируйте прибыль при изменении линии рисунка. , фиксируется прибыль или при
Ищете мощный индикатор для торговли на рынке Форекс, который поможет вам с легкостью определить прибыльные торговые возможности? Не ищите ничего, кроме Beast Super Signal. Этот простой в использовании индикатор, основанный на тренде, постоянно отслеживает рыночные условия, ищет новые развивающиеся тренды или отслеживает уже существующие. Beast Super Signal дает сигнал на покупку или продажу, когда все внутренние стратегии совпадают и на 100% совпадают друг с другом, что устраняет необходимость
Volatility Trend System - торговая система дающая сигналы для входов. Система волатильности дает линейные и точечные сигналы в направлении тренда, а также сигналы выхода из него, без перерисовки и запаздываний. Трендовый индикатор следит за направлением среднесрочной тенденции, показывает направление и ее изменение. Сигнальный индикатор основан на изменении волатильности, показывает входы в рынок. Индикатор снабжен несколькими типами оповещений. Может применяться к различным торговым инс
Представляем       Quantum Breakout PRO   , новаторский индикатор MQL5, который меняет ваш способ торговли в зонах прорыва! Разработан командой опытных трейдеров со стажем торговли более 13 лет,       Квантовый прорыв PRO       разработан, чтобы поднять ваше торговое путешествие к новым высотам с его инновационной и динамичной стратегией зоны прорыва. Quantum Breakout Indicator покажет вам сигнальные стрелки на зонах прорыва с 5 целевыми зонами прибыли и предложением стоп-лосса на основе по
WHY IS OUR FXACCCURATE LS MT5 THE PROFITABLE ? PROTECT YOUR CAPITAL WITH RISK MANAGEMENT Gives entry, stop and target levels from time to time. It finds Trading opportunities by analyzing what the price is doing during established trends. POWERFUL INDICATOR FOR A RELIABLE STRATEGIES We have made these indicators with a lot of years of hard work. It is made at a very advanced level. Established trends provide dozens of trading opportunities, but most trend indicators completely ignore them!
Прежде всего стоит подчеркнуть, что эта торговая система является индикатором без перерисовки, без перекрашивания и без задержек, что делает ее идеальной для профессиональной торговли. Онлайн-курс, руководство пользователя и демонстрация. Торговая система "Умная система торговли на уровнях поддержки и сопротивления" является продвинутым индикатором, созданным для новичков и опытных трейдеров. Он дает трейдерам точность и уверенность на рынке Форекс. Эта всесторонняя система объединяет 7+ стр
Allows multiple indicators to be combined into a single indicator, both visually and in terms of an alert. Indicators can include standard indicators, e.g. RSI, CCI, etc., and also Custom Indicators, even those purchased through Market, or where just have the ex4 file. An early alert is provided, say when 4 out 5 indicators have lined up, and a confirmed alert when all are in agreement. A‌lso features a statistics panel reporting the success of the combined indicator by examining the current cha
Cryo
Sabina Fik
5 (1)
Cryo использует в своей основе процесс выявления скорости изменения роста цены и позволяет найти точки входа и выхода с рынка. Фундаментальный технический индикатор,который позволяет дать оценку текущей рыночной ситуации,чтобы в войти в рынок выбранной валютной пары в тренд и с минимальным риском. Индикатор Cryo был создан на основе оригинальных индикаторов поиска экстремумов, индикатор хорошо подходит для определения разворота или большого резкого рывка в одну из сторон благодаря ему вы буде
MT4 Version   Order Blocks ICT   Kill Zones   SMT Divergences ICT Breakers The ICT Breakers indicator is a powerful tool for traders looking to gain an edge in the market. This indicator is based on the order flow and volume analysis, which allows traders to see the buying and selling pressure behind the price action. This information can be extremely valuable in identifying key levels of support and resistance, as well as potential turning points in the market. Breaker blocks are areas where i
Это, пожалуй, самый полный индикатор автоматического распознавания гармонического ценообразования, который вы можете найти для платформы MetaTrader. Он обнаруживает 19 различных паттернов, воспринимает проекции Фибоначчи так же серьезно, как и вы, отображает зону потенциального разворота (PRZ) и находит подходящие уровни стоп-лосс и тейк-профит. [ Руководство по установке | Руководство по обновлению | Устранение неполадок | FAQ | Все продукты ] Он обнаруживает 19 различных гармонических цен
Elliot Waves Analyzer Pro calculates Elliot Waves to Help Identify Trend direction and Entry Levels. Mainly for Swing Trading Strategies. Usually one would open a Position in trend direction for Wave 3 or a Correction for Wave C . This Indicator draws Target Levels for the current and next wave. Most important Rules for Elliot Wave Analysis are verified by the Indicator.  The Pro version analyzes Multiple Timeframes and shows the Subwaves and Target-Levels.   For an Overview  " Elliot Waves Anal
Excessive Momentum Indicator – один из немногих индикаторов, измеряющий чрезмерный импульс на финансовом рынке с использованием ценового поведения. Индикатор полностью разработан Янгом Хо Сео (Young Ho Seo). Этот показатель демонстрирует концепцию и практическое применение Равновесной фрактальной волны (Equilibrium Fractal Wave). Чрезмерный импульс на рынке может рассказать о психологии толпы и помочь спрогнозировать направление цены. Таким образом, вы можете основывать свои торговые решения на
Introduction to Fractal Pattern Scanner Fractal Indicator refers to the technical indicator that makes use of the fractal geometry found in the financial market. Fractal Pattern Scanner is the advanced Fractal Indicator that brings the latest trading technology after the extensive research and development work in the fractal geometry in the financial market. The most important feature in Fractal Pattern Scanner is the ability to measure the turning point probability as well as the trend probabil
IVISTscalp5
Vadym Zhukovskyi
5 (5)
Что нового в индикаторе прогнозов iVISTscalp5 (Версия 10)? iVISTscalp5 – это авторская система прогнозов для любого финансового инструмента на неделю вперед (для быстрого скальпинга по уровням времени). iVISTscalp5 – инструмент для простого изучения и понимания финансового рынка. 1)     Индикатор прогнозов iVISTscalp5 полностью переписан на другой язык программирования ( C ++), что ускорило загрузку и обработку данных. Разное графическое отображение прогнозов на графике будет еще проще для п
VTrende Pro
Andrii Diachenko
5 (1)
VTrende Pro - МТФ индикатор для трендовой торговли с панелью индикации для МТ5 !!! - Подробное описание на русском языке под видео (на Youtube) - !!! Хотя сигналы индикатора VTrende Pro можно использовать, как сигналы полноценной торговой системы, рекомендуется применять их в связке с ТС Билла Вильямса. VTrende Pro - это расширенная версия индикатора VTrende . Отличие Pro версии от VTrende: - Временные зоны - Сигнал V - сигнал 1-2 волн Основная задача индикатора - определить точки изм
«Пиранья» - автономная торговая система, определяющая уровни перекупленности и перепроданности на графике. Красная и синяя зоны отображают уровни перекупленности и перепроданности соответственно. Вход в сделку обозначен стрелками: стрелка вниз в красной зоне для "sell" и стрелка вверх в синей зоне для "buy". Уровень Тейк профита обозначен зеленой средней скользящей. Важные особенности: Регулировка уровня Тейк профита при изменении положения зеленой средней скользящей. Возможность усреднения пр
Другие продукты этого автора
ACB Trade Filter MT4
KEENBASE SOFTWARE SOLUTIONS
5 (1)
Индикатор ACB Trade Filter отфильтровывает маловероятные торговые сигналы в торговой стратегии. Продукт использует сложный алгоритм фильтрации на основе рыночных настроений и трендов. Заявки Хорошо сочетается с другим нашим индикатором ACB Breakout Arrows . Отфильтровывает маловероятные сигналы любого индикатора. Избегает слишком частых сделок и минимизирует убытки. Торгует в направлении рыночных настроений. Хорошо справляется с волатильностью. Инструкция по применению Покупайте, если гистог
KT Momentum Arrows MT5
KEENBASE SOFTWARE SOLUTIONS
5 (2)
KT Momentum Arrows Indicator is based on a momentary breakout which is calculated using the bands deviation and emerging volatility in a certain direction. A buy signal is generated when the price closes above the upper band and a sell signal is generated when the price closes below the lower band. A magnitude coefficient is used as the input which affects the band deviation and volatility at the same time. The coefficient value should be carefully selected and analyzed based on the instrument a
KT CCI Divergence robot is a 100% automated expert advisor that trades regular and hidden divergence built between the price and Commodity Channel Index (CCI) oscillator. The divergence signals are fetched from our freely available CCI divergence indicator. Not every divergence ends up in a successful price reversal, that is why this ea combines the raw divergences signals with its inbuilt technical analysis module to exploit the price inefficiency that occurs after some selected divergence s
Use of support and resistance in systematic trading is very subjective. Every trader has their own idea and way to plotting the support and resistance levels on the chart. KT Support and Resistance indicator take out this ambiguity out of the situation and automatically draws support and resistance levels following an algorithmic approach using a unique multi-timeframe analysis. When launched on the chart, It immediately scan the most significant extreme points across all the available timefr
ACB Breakout Arrows
KEENBASE SOFTWARE SOLUTIONS
4.15 (34)
The ACB Breakout Arrows indicator provides a crucial entry signal in the market by detecting a special breakout pattern. The indicator constantly scans the chart for a settling momentum in one direction and provide the accurate entry signal right before the major move.  Get multi-symbol and multi-timeframe scanner from here - Scanner for ACB Breakout Arrows MT4 Key features Stoploss and Take Profit levels are provided by the indicator. Comes with a MTF Scanner dashboard which tracks the brea
KT Momentum Arrows
KEENBASE SOFTWARE SOLUTIONS
KT Momentum Arrows Indicator is based on a momentary breakout which is calculated using the bands deviation and emerging volatility in a certain direction. A buy signal is generated when the price close above the upper band and a sell signal is generated when the price close below the lower band. A magnitude coefficient is used as the input which affects the band deviation and volatility at the same time. The coefficient value should be carefully selected and analyzed based on the instrument and
KT COG Advanced MT4
KEENBASE SOFTWARE SOLUTIONS
1 (1)
KT COG is an advanced implementation of the center of gravity indicator presented by John F. Ehlers in the May 2002 edition of Technical Analysis of Stocks & Commodities magazine. It's a leading indicator which can be used to identify the potential reversal points with the minimum lag. The COG oscillator catches the price swings quite effectively. MT5 version of the same indicator is available here KT COG Advanced MT5 Calculation of COG The COG indicator is consist of the two lines. The mai
KT Pin Bar
KEENBASE SOFTWARE SOLUTIONS
KT Pin Bar identifies the pin bar formation which is a type of price action pattern which depicts a sign of reversal or rejection of the trend. When combined with support and resistance, BRN and other significant levels, Pin Bar pattern proved to be a very strong sign of reversal. Basically, a pin bar is characterized by a small body relative to the bar length which is closed either in upper or lower 50% part of its length. They have very large wicks and small candle body. A pin bar candlest
KT Trend Magic
KEENBASE SOFTWARE SOLUTIONS
KT Trend Magic shows the trend depiction on chart using the combination of market momentum and volatility. A smoothing coefficient is used to smooth out the noise from the signal.It can be used to find out the new entries or confirm the trades produced by other EA/Indicators. Usage Drag n drop MTF scanner which scans for the new signals across multiple time-frames. Find new entries in the trend direction. Improve the accuracy of other indicators when used in conjunction. Can be used as a dyna
KT Auto Fibo
KEENBASE SOFTWARE SOLUTIONS
KT Auto Fibo draws Fibonacci retracement levels based on the ongoing trend direction. The Highs and Lows are automatically selected using the Maximum and Minimum points available on the chart. You can zoom in/out and scroll to adjust the Fibonacci levels accordingly. Modes Auto:  It draws the Fibonacci levels automatically based on the chart area. Manual: It draws the Fibonacci levels only one time. After that, you can change the anchor points manually. Usage: Helps to predict the future pr
KT Psar Arrows
KEENBASE SOFTWARE SOLUTIONS
KT Psar Arrows plots the arrows on chart using the standard Parabolic SAR indicator. A bullish arrow is plotted when the candle's high touch the SAR. A bearish arrow is plotted when the candle's low touch the SAR. The signals are generated in the real-time without waiting for the bar close.  Features A beneficial tool for traders who want to experiment with the trading strategies that include the use of Parabolic Sar indicator.  Can be used to find turning points in the market. Use custom PSA
KT Ichimoku Trader
KEENBASE SOFTWARE SOLUTIONS
1 (1)
KT Ichimoku Trader is a fully automated expert advisor that offers five popular trading strategies based on the Ichimoku indicator. Each strategy has it's own entry and exit method without any interference to other strategies. The Ichimoku system can be applied to all major currency pairs and metals. However, we found that it performs reasonably well mainly on two pairs.   MT5 Version is available here  https://www.mql5.com/en/market/product/35043 Features Trade up to 5 famous trading strate
KT Volatility oscillator analyze the past and current market data with a mathematical formula to display the result in a form of an oscillator. The growing and deteriorating waves are equivalent to high and low volatility in the asset.  In a nutshell, volatility is simply a measurement of the price fluctuation of an asset over a certain period of time. Without volatility, there would not much movement in the market and traders would not be able to profit from the price movements. Use of Volati
KT COG Robot
KEENBASE SOFTWARE SOLUTIONS
KT COG Robot is a fully automated Expert Advisor based on the KT COG Indicator . The COG indicator was originally presented by John F. Ehlers in the May 2002 edition of Technical Analysis of Stocks & Commodities magazine. The EA fires a long trade when COG line cross above the signal line and a short trade is fired when the COG line cross below the signal line.  Adaptive Filtration Our adaptive filtration algorithm combines the original COG formula with the major trend direction and market ac
ACB Breakout Arrows EA
KEENBASE SOFTWARE SOLUTIONS
This is a 100% automated expert advisor based on our custom indicator named "ACB Breakout Arrows" . The entries are based on a breakout pattern that constantly occurs in a bi-directional manner. The intensity of entry signals can be manipulated using the external input called "Signal Sensitivity". MT5 Version is available here  https://www.mql5.com/en/market/product/35785 Trades Confirmation ACB Breakout Arrows EA provides an ability to filter the entries using our another custom indicator n
KT Asian Breakout
KEENBASE SOFTWARE SOLUTIONS
4 (1)
KT Asian Breakout carefully analyzes the range-bound market during the Asian session and then fires a long or short trade after doing some preassessment based on its inbuilt technical analysis module. The executed orders are closed within a day before the completion of the next day session. The inbuilt technical analysis module checks for the session range and compares it with the last 20 days price movement. If it finds any erratic price movement within the session, the orders are not execute
KT London Breakout
KEENBASE SOFTWARE SOLUTIONS
First thirty minutes are essential for a trading session. The early reaction of traders and market players sets a path for the rest of the day. KT London Breakout EA takes advantage of this phenomenon, and after analyzing the first thirty minutes of London session, it places two bidirectional pending orders. One of pending order is eventually canceled after realizing the market direction with certainty. It has been strictly tested and developed for EUR/JPY using 30-Min Time Frame. You can ex
If you trade Forex, having detailed information about the currency strength and currency pairs correlation can take your trading to new heights. The correlation will help to cut your risk in half, and strength analysis will help to maximize the profits. This indicator provides a hybrid approach for selecting the most appropriate currency pairs using the strength analysis and currency pairs correlation. How to use the Currency Strength Analysis Suppose your trading strategy provides a buying o
MACD Divergence Seeker
KEENBASE SOFTWARE SOLUTIONS
KT MACD Divergence Seeker trades the regular and hidden divergence signals generated by our free indicator named KT MACD Divergence indicator. Trading the standalone divergences can be a risky affair that's why the KT MACD Divergence Seeker combines the standard divergence signals with an advanced analysis module to exploit the price inefficiencies on some FX pairs. What is the Divergence exactly? As a general conception if the price is making higher highs, then macd should also be making
KT Asian Breakout indicator scans and analyzes a critical part of the Asian session to generate bi-directional buy and sell signals with the direction of a price breakout. A buy signal occurs when the price breaks above the session high, and a sell signal occurs when the price breaks below the session low. MT5 Version is available here https://www.mql5.com/en/market/product/41704 Things to remember If the session box is vertically too wide, a new trade should be avoided as most of the price
MACD Divergence MT4
KEENBASE SOFTWARE SOLUTIONS
KT MACD Divergence shows the regular and hidden divergences build between the price and oscillator. If your trading strategy anticipates the trend reversal, you can include the MACD regular divergence to speculate the potential turning points. And if your trading strategy based on the trend continuation, MACD hidden divergence would be a good fit. Limitations of KT MACD Divergence Using the macd divergence as a standalone entry signal can be a risky affair. Every divergence can't be interpr
KT Bollinger Bands Trader is a 100% automated expert advisor that's incorporated a mean reversion trading strategy using the Bollinger bands during the period of low volatility. Price often reacts at the upper or lower line of Bollinger bands, but a reversal not always occurs. However, there is more chance of price reversal during the time of low volatility. Entries A buy trade is activated when price correctly aligns below the bottom line of Bollinger bands. A sell trade is activated when pri
KT CCI Divergence MT4
KEENBASE SOFTWARE SOLUTIONS
KT CCI Divergence shows the regular and hidden divergence created between the price and CCI oscillator. Divergence is one of the vital signals that depicts the upcoming price reversal in the market. Manually spotting the divergence between price and CCI can be a hectic and ambiguous task. Limitations of KT CCI Divergence   Using the CCI divergence as a standalone entry signal can be risky. Every divergence can't be interpreted as a strong reversal signal. For better results, try to combine it
KT Heiken Ashi Smoothed is a smoothed version of the standard Heiken Ashi. Moreover, it also plots buy/sell arrows on a trend change. A buy arrow is plotted when it change to a bullish state from bearish state. A sell arrow is plotted when it change to a bearish state from bullish state. Mobile notifications, Email, Sound and Pop-up alerts included. What exactly is Heiken Ashi Smoothed? It filters out the false signals and noise in the standard Heiken Ashi. It applies the set of two moving a
KT MA Crossover MT4
KEENBASE SOFTWARE SOLUTIONS
KT MA Crossover draws the buy and sell arrows based on the crossover of chosen moving averages. Moreover, it also generates the appropriate alerts and displays the MFE (Most Favorable Excursion) for each successive signal. The moving average crossover is one of the primary strategies followed by traders around the world. Usually, it consists of a fast and slow moving average to find a buy and sell entry signal according to the crossover direction. Buy signal - when fast MA crosses above the slo
KT Round Numbers MT4
KEENBASE SOFTWARE SOLUTIONS
KT Round Numbers plots the round number levels which are also commonly known as psychological levels in the Forex world. In the context of Forex trading, round number levels are those levels in which there are two or more zeroes at the end. They are named as 00 levels on the chart. Some traders also consider the halfway points as a valid round number level. They are named as 50 levels on the chart. Use of round number levels in trading Round number levels work as strong support and resistan
Despite the popularity of inside bar pattern among the traders, using it as a standalone signal doesn't provide any edge in the market. KT Inside Bar Advanced indicator solves this problem by combining the classic inside bar pattern with the "ECE" cycle and Fibonacci extensions. Using this indicator in place of our classic inside bar indicator will provide a tremendous advantage and edge in the market. What is the ECE cycle? In financial markets, the price never moves in a straight line bu
KT Inside Bar Hunter MT4
KEENBASE SOFTWARE SOLUTIONS
Despite the popularity of inside bar pattern among traders, using it as a standalone entry signal doesn't provide any evidentiary advantage. KT Inside Bar Hunter trades only selected inside bar patterns using some preassessment and ECE price action cycle. Trading Strategy On successful detection of the required pattern, EA places a pending order in the direction of the forecasted price expansion phase. Pending orders are canceled if they are not triggered within the next bar. Once triggered,
Divergence is one of the vital signals that depicts the upcoming price reversal in the market. KT Stoch Divergence shows the regular and hidden divergences build between the price and stochastic oscillator. Limitations of KT Stoch Divergence Using the Stochastic divergence as a standalone entry signal can be risky. Every divergence can't be interpreted as a strong reversal signal. For better results, try to combine it with price action and trend direction. Features Marks regular and hidde
KT CCI Surfer MT4
KEENBASE SOFTWARE SOLUTIONS
KT CCI Surfer uses a mean reversion trading strategy with a combination of extreme overbought/oversold zone detection using the Commodity Channel Index (CCI). Developed by Donald Lambert in 1980, CCI is a leading indicator that helps to identify the overbought/oversold region in the market without any lag. Obviously, not every overbought/oversold signal turns out into a price reversal. However, when combined with a well-planned mean reversion strategy, it produces excellent results. Recomme
Фильтр:
MarketWatch27378757
152
MarketWatch27378757 2022.01.05 19:20 
 

...

Ответ на отзыв
Версия 5.5 2022.03.10
- speed optimizations.
- Added the Light Mode which disables everything except the arrows and basic alerts.
- Added compatibility for our upcoming multi-symbol and multi-timeframe scanner.
Версия 5.1 2020.08.24
- fixed a bug that causes the data overflow in the performance analysis metrics.
- fixed the decimal precision for ASX200.
Версия 5.0 2020.07.13
- added a multi-timeframe scanner dashboard.
- added Max. Profit value in the performance analysis statistics.
- minor changes in the alerts.
Версия 4.8 2019.10.07
- added an ability to choose the quick profit, first target or final target as a success rate criterion.
- source code optimization.
Версия 4.6 2019.05.23
- bugs removal
Версия 4.5 2019.01.02
- added a more comprehensive performance analysis.
- source code optimization
- bugs removal
- added old-style text information instead of the moveable panel.
Версия 4.2 2018.10.04
- bugs removal.
Версия 4.1 2018.10.03
A panel related bug has been fixed.
Версия 4.0 2018.09.26
- Added a statistic panel to show the indicator performance metrics in real time.
- Old display information has been removed.
- Some other information has been removed which is not beneficial anymore.
- Source code optimization for faster execution.
Версия 3.1 2017.07.13
- Добавлены данные о символе и таймфрейме в алертах, отсылаемых по электронной почте и в виде push-сообщений.
- Улучшена скорость работы индикатора путем оптимизации алгоритма сигнала.
- Исправлены ошибки.