Elliott Wave Trend MT4
- Индикаторы
- Young Ho Seo
- Версия: 11.5
- Обновлено: 2 марта 2022
- Активации: 5
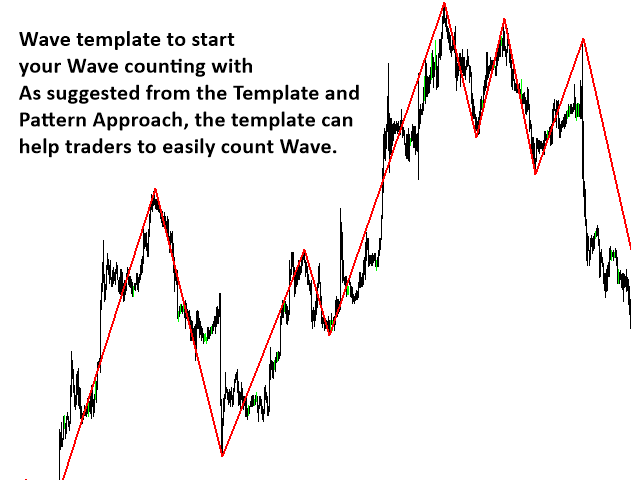
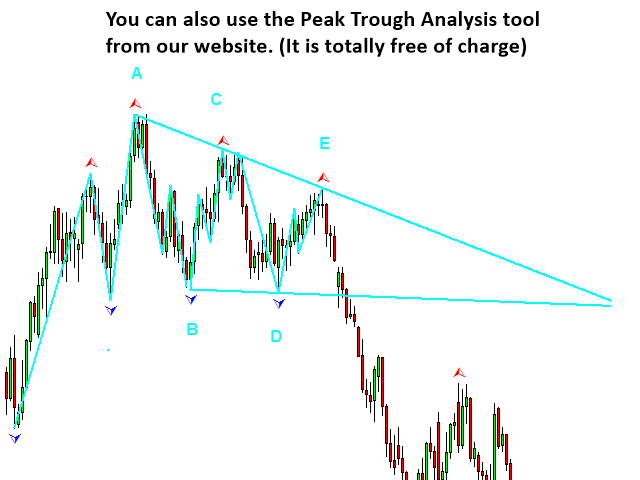
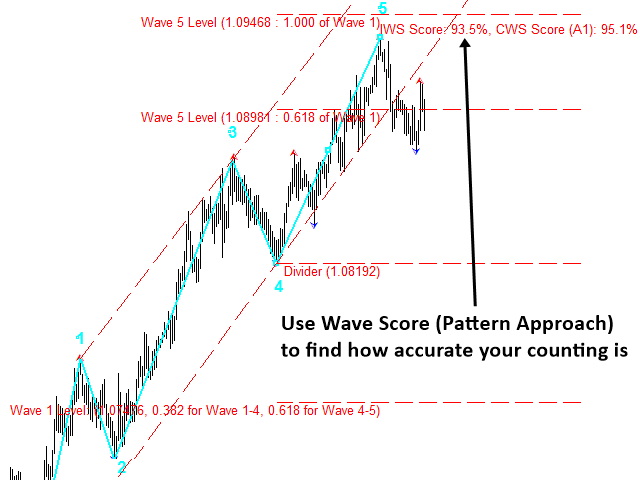
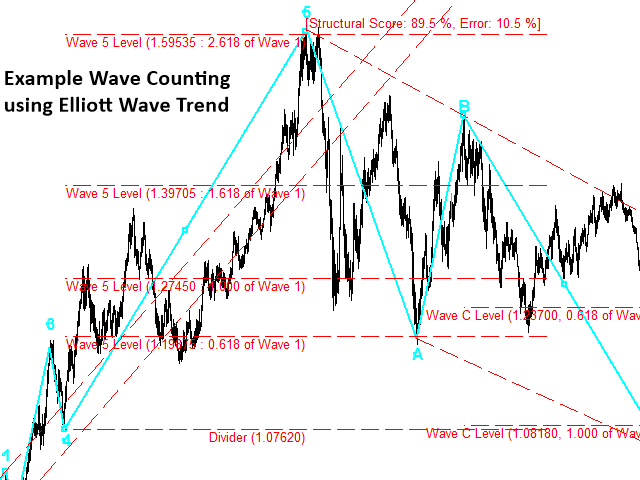
Индикатор Elliott Wave Trend был разработан для научного подсчета волн на основе шаблонов и паттернов, впервые разработанных Чжон Хо Сео. Индикатор нацелен на максимальное устранение нечеткости классического подсчета волн Эллиотта с использованием шаблонов и паттернов. Таким образом индикатор Elliott Wave Trend в первую очередь предоставляет шаблон для подсчета волн. Во-вторых, он предлагает структурный подсчет волн Wave Structural Score, которые помогает определить точное формирование волны. Он считает отдельно импульсные и корректирующие волны. Структурная оценка отображает качество волновых паттернов. 100% означает хороший волновой паттерн. Значения ниже 80% или отрицательные значения означают, что в анализе могут быть ошибки. Elliott Wave Trend исправляет очевидные ошибки в разметках волн, если вдруг расчет ведется с несоблюдением трех правил, предложенных Ральфом Эллиоттом.
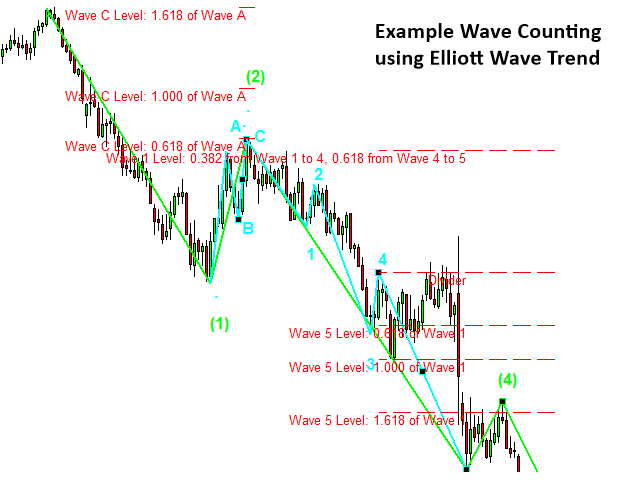
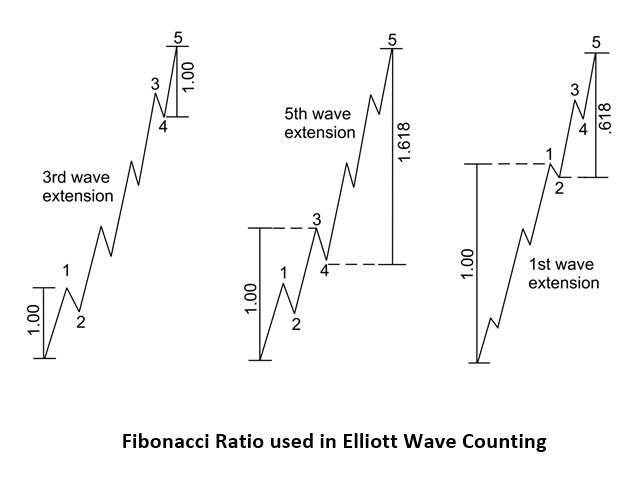
Но это не все мощные особенности индикатора Elliott Wave Trend. Как только волновая разметка будет выполнена, индикатор автоматически предоставит всю важную информацию для торговли. Во-первых, он автоматически определит все важные уровни коррекции Фибоначчи в разметке волн. Во-вторых, он автоматически построит основной канал, канал ускорения и канал замедления. Кроме того, он автоматически определит некоторые важные конверты для вашей торговой сессии.
Обратите внимание, что даже несмотря на то, что в индикаторе много автоматических функций, некоторые ручные операции по-прежнему необходимы для разметки волн. Кроме того, вам потребуется дисциплина и знания волн Эллиотта. Изучив волны, вы сможете использовать всю мощь волнового анализа Эллиотта, где субъективность волновой разметки полностью контролируется.
Работа с кнопками
Индикатор Elliott Wave Trend работает в основном с помощью кнопок и мыши. Список кнопок, позволяющих точно определять на графике волновые паттерны.
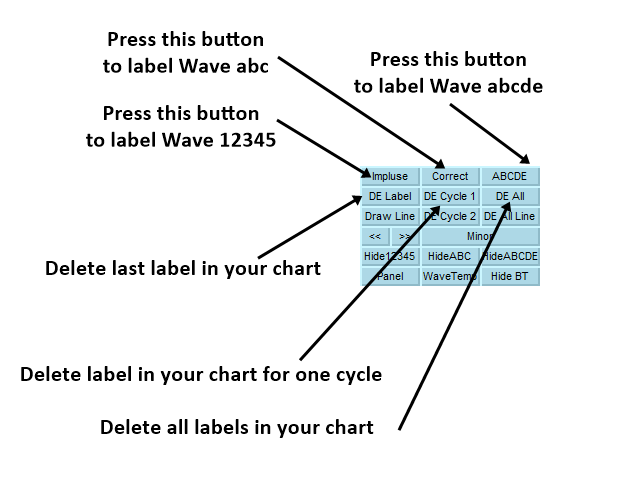
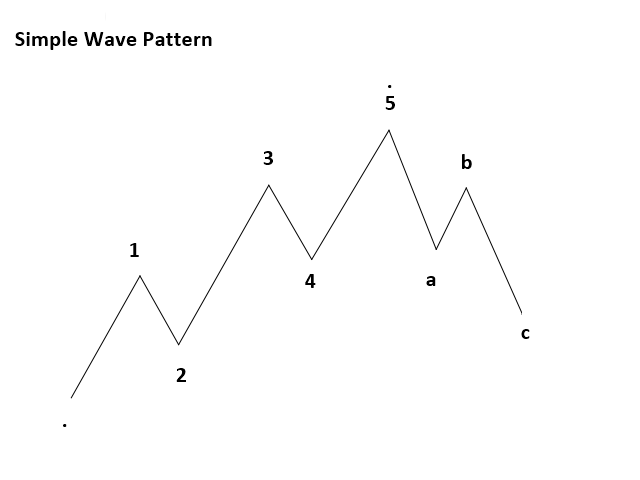
- Impulse: Нажмите эту кнопку, чтобы начать размечать импульсные волны на графике. Если кнопка отключена, вы не сможете на графике размечать импульсные волны. После нажатия на кнопку дважды щелкните на графике для размещения каждой импульсной волны (т.е. волны 1, 2, 3, 4 и 5). После окончания разметки импульсной волны снова нажмите на эту кнопку. После первого двойного клика на графике появится начало волны (.). Затем будут добавлены метки 1, 2, 3, 4 и 5.
- Correct: Для начала разметки на графике волн коррекции нажмите на эту кнопку. Если кнопка отключена, вы не сможете на графике размечать волны коррекции. После нажатия на кнопку дважды щелкните на графике для размещения каждой волны коррекции (т.е. волны A, B и C). После окончания разметки импульсной волны снова нажмите на эту кнопку. После первого двойного клика на графике появится начало волны (.). Затем будут добавлены метки A, B и C .
- DE Label: кнопка удаления метки. При нажатии на кнопку с графика удалится последняя добавленная метка.
- DE Cycle 1: кнопка удаления цикла 1. При нажатии на эту кнопку будут удалены все метки текущего цикла. Если нажата кнопка impulse, нажатие на кнопку DE Cycle 1 удалит все метки импульсной волны текущего цикла, останутся только метки волны коррекции. Если нажата кнопка correct, нажатие на кнопку DE Cycle 1 удалит все метки волны коррекции текущего цикла.
- DE ALL: удалить всё. При нажатии на эту кнопку будут удалены все метки.
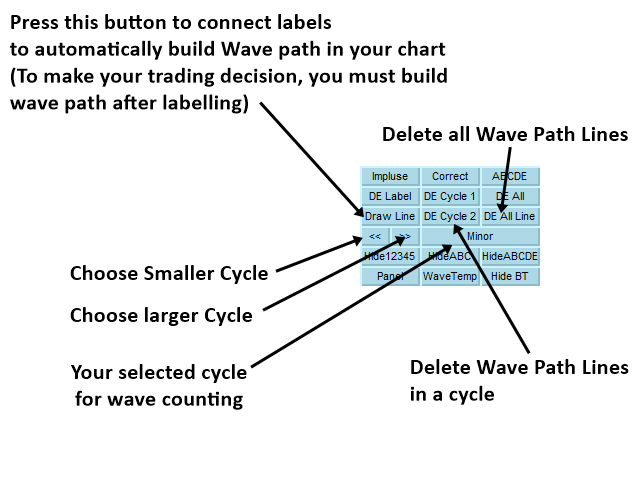
- Draw Line: Нажмите на эту кнопку после размещения всех меток на графике. Линия автоматически соединит метки.
- DE Cycle 2: кнопка удаления цикла 2. При нажатии на эту кнопку будут удалены все линии текущего цикла. Если нажата кнопка impulse, нажатие на кнопку DE Cycle 2 удалит все линии импульсной волны текущего цикла, останутся только линии волны коррекции. Если нажата кнопка correct, нажатие на кнопку DE Cycle 2 удалит все линии волны коррекции текущего цикла.
- DE All Line: удалить все линии. При нажатии на эту кнопку будут удалены все линии.
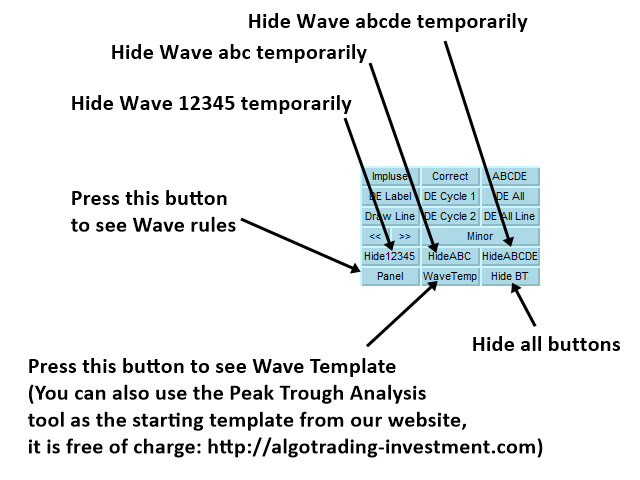
- Panel: кнопка показывает/скрывает панель информации. На панели отображаются правила расчета волн.
- WaveTrend: кнопка показывает/скрывает индикатор тренда на графике. Вы можете использовать индикатор тренда в качестве дополнительного помощника.
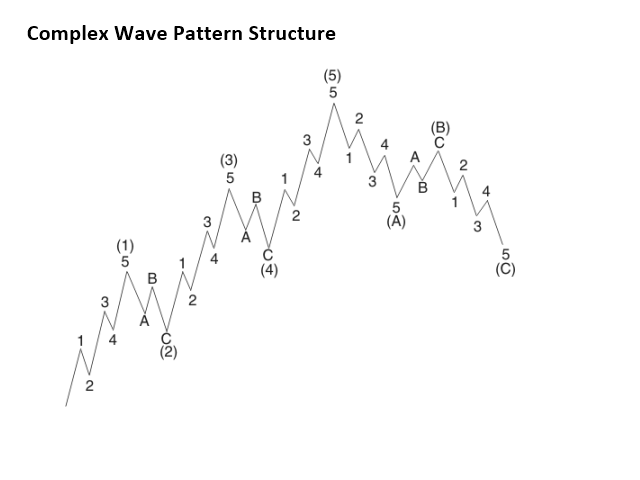
- << : уменьшение цикла
- >> : увеличение цикла


Precise indicator... will help you understand Elliot Waves... essential. Good work