• Обзор
  • Отзывы (2)
  • Обсуждение (3)
  • Что нового

Quantum Volume Point of Control Indicator

5

Индикатор Quantum VPOC был разработан для расширения двумерного изучения объема и цены до трехмерного, включающего время. Соотношение объем/цена/время предоставляет реальное понимание внутренней работы рынка и сердцебиение настроения и риска, который соответственно движет ценовым действием.

Индикатор Quantum VPOC отображает несколько ключевых элементов информации на графике следующим образом:

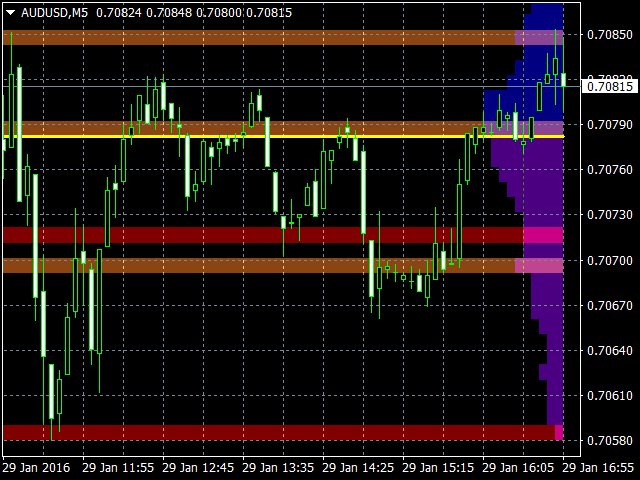
  • Volume Profile - показывается в виде гистограммы по объему на вертикальной оси цены на правой стороне графика. Пики и впадины четко отображаются, подчеркивая максимумы и минимумы узлов объемов.
  • High volume node (HVN) - здесь наблюдается выпуклость в профиле объема, как правило, в результате длительной фазы скопления цены. В результате, когда рынок приближается к этим областям на графике, ценовое действие может стать заболоченным со вполне вероятным последующим накоплением, а узел будет действовать в роли сильной области поддержки или сопротивления. Так как ранее наблюдалось сильное принятие цены на этом уровне, это скорее всего повторится, а рынок будет колебаться в данном диапазоне. В конечном счете, рынок может отойти от этих уровней, а любое движение через них будет подтверждать текущее настроение.
  • Low volume node (LVN) - здесь наблюдается низкий объем в профиле объема. В этих зонах рынок останавливается только временно - другими словами, это зона, в которой цена ранее отклонялась. Таким образом, рынок вероятнее всего быстро пройдет через эти области с небольшим сопротивлением или поддержкой, действующих для предотвращения дальнейшего снижения цены. Текущее настроение скорее всего продолжит движение и быстро вырастет после этих уровней.
  • Support and Resistance Zones - рисуются на узлах максимумов и минимумов для обозначения различных уровней HVN и LVN на оси цен.
  • Volume Point of Control Line - рисуется в виде одной линии на максимальном объеме высокообъемного узла (High Volume Node) таймфрейма и четко определяет переломную точку настроения. Передвигается динамически и показывается точку опоры настроения рынка. Если она выше ценового действия, то текущее настроение рынка является медвежьим. Если она ниже ценового действия, то текущее настроение рынка является бычьим. Линия VPOC показывает этот баланс просто, быстро и четко, позволяя судить о настроении рынка с точностью и уверенностью.

Индикатор Quantum VPOC обладает несколькими уникальными особенностями, каждая из которых разработана, чтобы помочь вам видеть внутреннюю часть рынка и торговать по течению, а не против него.

  • Индикатор является динамическим, что означает постепенно меняющийся вывод информации при появлении новых данных об объемах, так что вы можете быть уверены, что вы получите только самые релевантные сигналы.
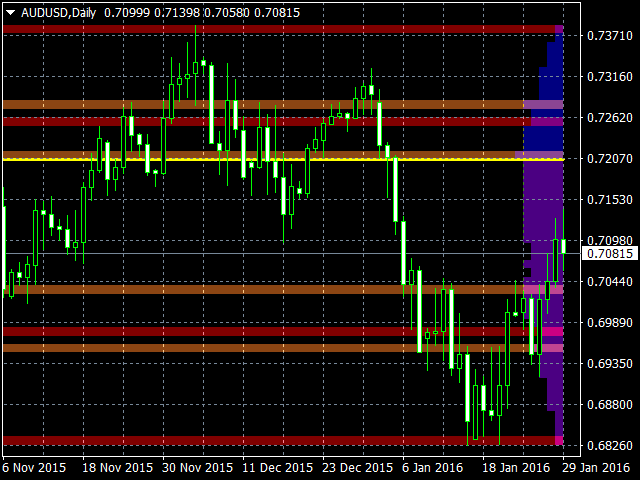
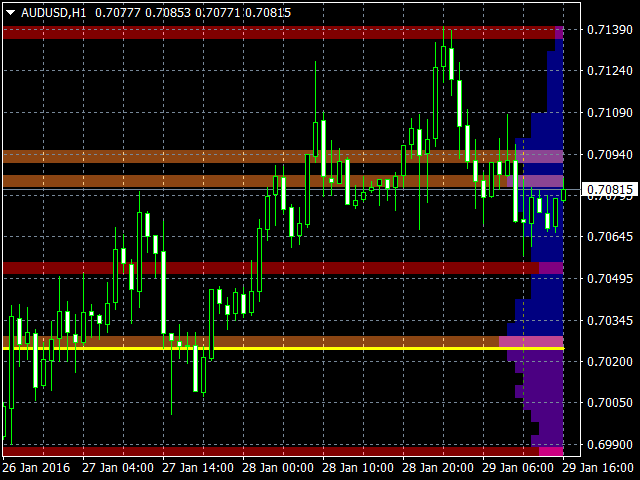
  • Расширенный функция включает в себя возможность изменения таймфрейма источника данных, который отлично подходит для мульти-таймфреймового анализа. Это дает вам возможность увидеть различные таймфреймы быстро и легко с соответствующим VPOC.
  • Обе стороны профиля объема окрашены по-разному и разделяются линией точки контроля объема для интуитивного и быстрого анализа графика. Верхняя сторона синяя по умолчанию, а нижняя сторона фиолетовая по умолчанию.
  • Создаются два типа зон поддержки и сопротивления, а затем они снова окрашиваются по-разному для увеличения скорости. Высокообъемные узлы (HVN) окрашиваются более светлым оттенком оранжевого - низкообъемные узлы (LVN) окрашиваются более темным оттенком оранжевого.
  • Количество зон поддержки и сопротивления регулируется, для них дан рекомендуемый диапазон.
  • Бары профиля объема могут быть точно настроены, чтобы сделать их шире или уже.
  • Период (количество обрабатываемых баров) можно настроить по усмотрению.
  • Профиль объема, зоны поддержки и сопротивления, а также линии точки контроля объема могут быть включены или выключены по вашему усмотрению.
  • Цвета профиля объема, зон поддержки и сопротивления, а также линии точки контроля объема могут быть настроены по вашим предпочтениям.

Индикатор Quantum VPOC indicator является динамичным, он постоянно меняется с каждым поступающим тиком. Он работает на всех таймфреймах и обеспечивает мощное и намного более глубокое понимание поддержки и сопротивления через призму объема и связанных с ними высоко- и низкообъемных узлов, с самой точкой контроля, действующей в качестве точки опоры рынка.

Отзывы 2
elite luis
3331
elite luis 2023.03.26 19:39 
 

Agreed with Peterson! Amazing indicator! and very useful tool, Big Thank you to Author :)

Peterson Ndugga
264
Peterson Ndugga 2017.02.25 08:13 
 

The VPOC is Very powerful & accurate...I mostly use it for support & resistance levels & it has never predicted any wrong level. Thanx much💪💪💪

Рекомендуем также
Данный копировщик был изначально разработан для профессионального управления ордерами команды трейдеров и поэтому, в первую очередь, в него был вшит риск менеджер. Для простой работы вам нужно настроить такие параметры: Для мастера! 1.   Выбираем тип программы  ''Program mode'' - master (поставщик сигналов)   2. Вводим новое имя для папки ''Folder name'', в которую советник будет записывать информацию по работе с ордерами. Имя должно быть одинаковым как для мастера так и для слейва!!!  3. В
KopierMaschine - локальный копировщик сделок между различными счетами MetaTrader 4 и MetaTrader 5 в любом направлении расположенных на одном компьютере с интуитивно понятным интерфейсом. Направления копирования: MT4 --> MT5 MT4 --> MT4 MT5 --> MT5 MT5 --> MT4 для копирования между терминалами MetaTrader 4 и MetaTrader   5 необходимо приобрести версию продукта KopierMaschine  для  MetaTrader   5 Особенности Программа работает в двух режимах Master и Slave На один подчиненный счет можно копирова
Trade with Gann on your side!! MASTER CIRCLE 360 CIRCLE CHART, originally created by Gann admitted that this is “The Mother of all charts”. It is one of the last studies that this great trader left for us. The numeric tab le is apparently quite simple like all the tables and is based on square numbers, the SQUARE OF 12 and is by evolution, one of the most important square numbers. Here we can find CYCLE, PRICE AND TIME thanks to angles and grades, to show past and future support and resistance.
Daily Candle Predictor - это индикатор, который предсказывает цену закрытия свечи. Прежде всего индикатор предназначен для использования на графиках D1. Данный индикатор подходит как для традиционной форекс торговли, так и для торговли бинарными опционами. Индикатор может использоваться как самостоятельная торговая система, так может выступать в качестве дополнения к вашей уже имеющейся торговой системе. Данный индикатор производит анализ текущей свечи, рассчитывая определенные факторы силы внут
Noize Absorption Index - is the manual trading system that measures the difference of pressure between bears forces and bulls forces. Green line - is a noize free index that showing curent situation. Zero value of index shows totally choppy/flat market.Values above zero level shows how powerfull bullish wave is and values below zero measures bearish forces.Up arrow appears on bearish market when it's ready to reverse, dn arrow appears on weak bullish market, as a result of reverse expectation. S
Introduction It is common practice for professional trades to hide their stop loss / take profit from their brokers. Either from keeping their strategy to the themselves or from the fear that their broker works against them. Using this indicator, the stop loss / take profit points will be drawn on the product chart using the bid price. So, you can see exactly when the price is hit and close it manually.  Usage Once attached to the chart, the indicator scans the open orders to attach lines fo
Trend Trading - это индикатор, предназначенный для получения максимальной прибыли от трендов, происходящих на рынке, путем определения времени отката и прорыва. Он находит торговые возможности, анализируя, что делает цена во время установленных тенденций. [ Руководство по установке | Руководство по обновлению | Устранение неполадок | FAQ | Все продукты ] Торгуйте на финансовых рынках с уверенностью и эффективностью Прибыль от устоявшихся тенденций без проволочек Признать прибыльные откаты,
VR Cub
Vladimir Pastushak
VR Cub это индикатор что бы получать качественные точки входа. Индикатор разрабатывался с целью облегчить математические расчеты и упростить поиск точек входа в позицию. Торговая стратегия, для которой писался индикатор, уже много лет доказывает свою эффективность. Простота торговой стратегии является ее большим преимуществом, что позволяет успешно торговать по ней даже начинающим трейдерам. VR Cub рассчитывает точки открытия позиций и целевые уровни Take Profit и Stop Loss, что значительно повы
Индикатор строит текущие котировки, которые можно сравнить с историческими и на этом основании сделать прогноз ценового движения. Индикатор имеет текстовое поле для быстрой навигации к нужной дате. Параметры : Symbol - выбор символа, который будет отображать индикатор; SymbolPeriod - выбор периода, с которого индикатор будет брать данные; IndicatorColor - цвет индикатора; Inverse - true переворачивает котировки, false - исходный вид; Далее идут настройки текстового поля, в которое можн
Matrix - стрелочный индикатор Форекс. Отображает сигналы просто и наглядно! Стрелки показывают направление заключения сделки, и окрашиваются соответственно что видно на скриншотах. Как видите торговать с таким индикатором легко. Дождался появления стрелки в нужном направлении – открыл сделку. Сформировалась стрелка в обратную сторону – закрыл сделку. Также индикатор отображает линии с помощью которых формируются сигналы стрелок, с учетом внутренних вильтров.
What are Heiken Ashi Candles? Heiken Ashi, derived from the Japanese term 'Heikin Ashi,' translates to average price bars. It's an indicator depicting price bars on a chart. Formula for Heiken Ashi candles: - Heiken Ashi opening price: (previous candle's opening + closing price) / 2 - Closing price Heiken Ashi: (opening + high + low + closing) / 4 - Heiken Ashi peak: Max of high, opening, or closing price - Heiken Ashi bottom price: Min of low, opening, or closing price How to Read Heik
PipFinite Razor Scalper
Karlo Wilson Vendiola
4.44 (50)
Pipfinite creates unique, high quality and affordable trading tools. Our tools may or may not work for you, so we strongly suggest to try the Demo Version for MT4 first. Please test the indicator prior to purchasing to determine if it works for you. We want your good reviews, so hurry up and test it for free...we hope you will find it useful. Combo Razor Scalper with Trend Laser Strategy: Scalp in the direction of the trend Watch Video: (Click Here) Features Scalping indicator using a confir
Профиль Рынка (Market Profile) определяет ряд типов дней, которые помогают трейдеру распознать поведение рынка. Ключевая особенность - это область значений (Value Area), представляющая диапазон ценового действия, в котором произошло 70% торговли. Понимание области значений может помочь трейдерам вникнуть в направление рынка и установить торговлю с более высокими шансами на успех. Это отличное дополнение к любой системе, которую вы возможно используете. Blahtech Limited представляет сообществу Me
Owl smart levels
Sergey Ermolov
4.63 (54)
Версия MT5  | Как установить?  | FAQ Индикатор Owl Smart Levels   – это полноценная торговая система внутри одного индикатора, которая включает в себя такие популярные инструменты анализа рынка как усовершенствованные   фракталы Билла Вильямса , Valable ZigZag, который строит   правильную волновую структуру   рынка, а также  уровни Фибоначчи,   которые   отмечают точные уровни входа в рынок и места взятия прибыли. Подробное описание стратегии Инструкция по работе с индикатором Советник-помошник
"Тренд - друг трейдера" . Это одна из самых известных пословиц в трейдинге, потому что правильное определение тренда может помочь заработать. Однако проще сказать о торговле по тренду, чем сделать, потому что многие индикаторы основаны на развороте цены, а не на анализе тренда. Они не очень эффективны при определении периодов тренда или в определении того, сохранится ли этот тренд. Мы разработали индикатор Trendiness Index , чтобы попытаться решить эту проблему. Индикатор определяет силу и напра
Indicator function This index buys and sells according to the color, using time is one hour,Please run the test on a 30-minute cycle It is best to use 1H for testing   About update questions In order to be more suitable for market fluctuations, the company regularly updates the indicators   Product cycle and trading time applicable to indicators Applicable mainstream currency pair EUR/USD GBP/USD NZD/USD AUD/USD USD/JPY USD/CAD USD/CHF Applicable mainstream cross currency pair EUR/JPY EUR/GBP E
Это трендовый индикатор без перерисовки Разработан вместо стратегии бля бинарках опционов (по цвету свечи мартингейл) Так же хорошо работает в торговле на рынке форекс Когда открывать сделки ( бинарные опционы ) Сигнал появится в месте с свечой сигналит на текущую свечу  Открывать сделку стоит на одну свечу текущего таймфрейма рекомендуется м1 и М5 При появлении синей точки открываем сделку вверх При появлении красной точки открываем сделку в низ. Как открывать сделки на Форекс. При полу
Master scalping M1 -инновационный индикатор, использующий алгоритм для быстрого и точного определения тренда.Индикатор рассчитывает время открытия и закрытия позиций, алгоритмы индикатора позволяют находить идеальные моменты для входа в сделку (покупки или продажи актива), повышающие успешность сделок у большинства трейдеров. Преимущества индикатора: Прост в использовании, не перегружает график не нужной информацией. Возможность использования  как фильтр для любой стратегии. Работает на рынке
Order Book
Thomas Bradley Butler
В сочетании с диаграммой Delta Footprint Chart вы получите полное представление о профиле объема рынка: https://www.mql5.com/en/market/product/94153 Индикатор «Книга ордеров» отображает гистограмму на ценовом графике, представляющую кластеры объема спроса и предложения.   Индикатор анализирует исторические ценовые данные и рассчитывает кластеры объемов спроса и предложения для каждого ценового уровня в пределах заданного количества баров. Кластеры объема предложения показаны синим цветом, а
It will be the best tool for you to make a profit! Through unique algorithms You're going to see an amazing amount of right trading signals Make huge profits every day and realize more possibilities!   Like the car no money to buy it, the love of the girls dare not to pursue?Or the credit card bill is not paid, the rent does not have the extra money to settle?Or are you fed up with being bossed around by your boss and Hope to get more people's respect?Can't afford to buy the things you want ? wa
The Chaikin Oscillator is a technical indicator developed by Marc Chaikin that combines price and volume data to measure the accumulation and distribution of a financial instrument. It aims to identify potential buying and selling opportunities in the market. The Chaikin Oscillator is calculated by subtracting a 10-day exponential moving average of the Accumulation Distribution Line (ADL) from a 3-day exponential moving average of the ADL. Here's how to use the Chaikin Oscillator indicator in tr
PipFinite Energy Beam
Karlo Wilson Vendiola
3.94 (17)
Pipfinite creates unique, high quality and affordable trading tools. Our tools may or may not work for you, so we strongly suggest to try the Demo Version for MT4 first. Please test the indicator prior to purchasing to determine if it works for you. We want your good reviews, so hurry up and test it for free...we hope you will find it useful. Combo Energy Beam with Swing Control Strategy: Confirm swing pullback signals Watch Video: (Click Here) Energy Beam with Trend Laser Strategy: Confirm Tr
SUPER SALE! --> BUY Trend Reader Indicator with -$180 OFF and GET a BONUS EA: News Scope EA PRO with AMAZING results! NOTE: Trend Reader Indicator PROMO price: $117 (The next price $297) - The offer ends soon! Click here to check News Scope EA PRO results and learn more about the promotion! Trend Reader Indicator is a revolutionary trading indicator designed to empower forex traders with the tools they need to make informed trading decisions. This cutting-edge indicator utilizes complex mathema
Fibonacci retracement and extension line drawing tool Fibonacci retracement and extended line drawing tool for MT4 platform is suitable for traders who use  golden section trading Advantages: There is no extra line, no too long line, and it is easy to observe and find trading opportunities Trial version: https://www.mql5.com/zh/market/product/35884 Main functions: 1. Multiple groups of Fibonacci turns can be drawn directly, and the relationship between important turning points
For sure, this indicator has become very popular amongst traders. Through coding this indicator will give you the most accurate levels possible for your trading analysis. We have also added in the ability for you to receive alerts when the price breaks above or below a Support or Resistance lines! HOW TO USE The red rectangles represent your resistance/supply zone. The green rectangles represent your support/demand zone.  BONUS FEATURES We coded this indicator with the ability to switch between
This is an arrow indicator without a future function,developed based on the most advanced profit trading algorithms.It has the most innovative and advanced dual trend analysis module, as well as the latest and highly effective market trend prediction algorithm.Trends are your friends, and following larger trends can earn the maximum profit in foreign exchange. This indicator helps traders identify current trends and track them. Someone once made a profit of 10 times in a week by relying on it.No
Requirements Optimized to work with   EURUSD-EURCHF-USDJPY, AUDUSD-CADJPY-AUDNZD, CHFJPY-NZDJPY-NZDUSD For timeframe 4H. *(Minimum recommended deposit is $300 for each Pair) for initial lot set to 0.10, My favorite Pair are (CHFJPY-NZDJPY-EURUSD-AUDNZD-USDJPY) Warning it will be SALE only 5 Copys at 60$ Then it will be update up to 200$  You can use it the way it is, For new Set Files will be add on (Comments) ECN broker with low spread is recommended to get better results. Setup is
Gold Bricks FX USES THE TREND WAVE INDICATOR AND IT CAN IDENTIFY THE BEGINNING AND THE END OF A NEW WAVE TREND MOVEMENT. AS AN OSCILLATOR, THE INDICATOR IDENTIFIES THE OVERBOUGHT AND OVERSOLD ZONES. IT WORKS GREAT TO CATCH THE SHORT TERM PRICE REVERSALS AND USES A MARTINGALE STRATEGY TO CLOSE ALL TRADES IN PROFIT. USE DEFAULT SETTINGS ON H1 OR HIGHER TIME FRAME ON ANY PAIR FOR MORE ACCURATE TRADES WHY THIS EA : Smart entries calculated by 4 great strategies The EA can be run on even a
The Th3Eng PipFinite indicator is based on a very excellent analysis of the right trend direction with perfect custom algorithms. It show the true direction and the best point to start trading. With StopLoss point and Three Take Profit points. Also it show the right pivot of the price and small points to order to replace the dynamic support and resistance channel, Which surrounds the price. And Finally it draws a very helpful Box on the left side on the chart includes (take profits and Stop loss
Support and Resistance is a very important reference for trading.  This indicator provides customized support and resistance levels, automatic draw line and play music functions.  In addition to the custom RS, the default RS includes Pivot Point, Fibonacci, integer Price, MA, Bollinger Bands. Pivot Point is a resistance and support system. It has been widely used at froex,stocks, futures, treasury bonds and indexes. It is an effective support resistance analysis system. Fibonacci also known as t
С этим продуктом покупают
The AT Forex Indicator MT4 is a sophisticated trading tool designed to provide traders with a comprehensive analysis of multiple currency pairs. This   powerful indicator   simplifies the complex nature of the forex market, making it accessible for both novice and experienced traders. AT Forex Indicator uses   advanced algorithms   to detect trends, patterns and is an essential tool for traders aiming to enhance their forex trading performance. With its robust features, ease of use, and reliabl
Indicator : RealValueIndicator Description : RealValueIndicator is a powerful tool designed specifically for trading on the EURUSD pair. This indicator analyzes all EUR and USD pairs, calculates their real currency strength values, and displays them as a single realistic value to give you a head start on price. This indicator will tell you moves before they happen if you use it right. RealValueIndicator allows you to get a quick and accurate overview of the EURUSD currency pair tops and bottoms,
В настоящее время скидка 20%! Лучшее решение для новичка или трейдера-эксперта! Эта приборная панель работает на 28 валютных парах. Он основан на 2 наших основных индикаторах (Advanced Currency Strength 28 и Advanced Currency Impulse). Он дает отличный обзор всего рынка Forex. Он показывает значения Advanced Currency Strength, скорость движения валюты и сигналы для 28 пар Forex на всех (9) таймфреймах. Представьте, как улучшится ваша торговля, когда вы сможете наблюдать за всем рынком с пом
Прежде всего стоит подчеркнуть, что этот торговый индикатор не перерисовывается, не перерисовывает и не отставает, что делает его идеальным как для ручной, так и для роботизированной торговли. Руководство пользователя: настройки, вводы и стратегия. Атомный аналитик - это индикатор ценового действия PA, который использует силу и импульс цены, чтобы найти лучший край на рынке. Оборудованный расширенными фильтрами, которые помогают убирать шумы и ложные сигналы, и повышают торговый потенциал. Испо
TrendMaestro
Stefano Frisetti
5 (3)
note: this indicator is for METATRADER4, if you want the version for METATRADER5 this is the link:  https://www.mql5.com/it/market/product/108106 TRENDMAESTRO ver 2.4 TRENDMAESTRO recognizes a new TREND in the bud, he never makes mistakes. The certainty of identifying a new TREND is priceless. DESCRIPTION TRENDMAESTRO identifies a new TREND in the bud, this indicator examines the volatility, volumes and momentum to identify the moment in which there is an explosion of one or more of these data a
JULY OFFER 80% OFF next price for unlimited version will be 17000$. This is the only time you can get this institutional and professional indicator at this price for unlimited version. Don't dare to miss this. The tool I am about to introduce to you you can't compare it with other tools due to its strategy and accuracy level in predicting the next price directional movement . This tool is designed for serious traders who have decided to make a difference through trading. Be the next person to wi
Enigmera
Ivan Stefanov
5 (4)
ЭНИГМЕРА: ядро рынка https://www.enigmera.com Введение Этот индикатор и торговая система представляют собой удивительный подход к финансовым рынкам. ENIGMERA использует фрактальные циклы для точного расчета уровней поддержки и сопротивления. Он показывает подлинную фазу накопления и дает направление и цели.  Система, которая работает независимо от того, находимся ли мы в тренде или в коррекции.  Как она работает? ENIGMERA состоит из трех линий: линии поддержки/сопротивления, линии цели и ли
Cycle Sniper
Elmira Memish
4.41 (37)
NEW YEAR SALE PRICE FOR LIMITED TIME!!! Please contact us after your purchase and we will send you the complimentary indicators to complete the system Cycle Sniper is not a holy grail but when you use it in a system which is explained in the videos, you will feel the difference. If you are not willing to focus on the charts designed with Cycle Sniper and other free tools we provide, we recommend not buying this indicator. We recommend watching the videos about the indiactor and system before pu
ZeusArrow Smart Liquidity Finder  Smart Liquidity Finder is Ai controlled indicator based on the Idea of Your SL is My Entry. It scan and draws the major Liquidity areas on chart partitioning them with Premium and Discount Zone and allows you find the best possible trading setups and help you decide the perfect entry price to avoid getting your Stop Loss hunted . Now no more confusion about when to enter and where to enter. Benefit from this one of it's kind trading tool powered by Ai an trade
Welcome to the world of SMC (Smart Money Concepts) Trading, where we empower traders with the tools and knowledge to make smarter trading decisions. Our latest addition to our suite of trading tools is the SMC Trading Pro indicator, version 1.0. Key Features: Major Market Structure Identification with BODY break. Order Block must be in Major Swing ( not Small Swing ). Order Block with Fair Value Gap Detection. Order Block in Discount | Premium zone. Filter for only Bullish, Bearish or All Order
А. Что такое A2SR?   * Это опережающий технический индикатор (без перерисовки, без запаздывания) . -- Учебники : -- на https://www.mql5.com/ru/blogs/post/734748/page4#comment_16532516   -- и https://www.mql5.com/ru/users/yohana/blog A2SR имеет особую технику определения уровней Поддержки (спроса) и Сопротивления (предложения). В отличие от обычного способа, который мы видели в сети, A2SR имеет оригинальную концепцию определения фактических уровней SR. Оригинальная техника не была взята из Инт
NAM Order Blocks
NAM TECH GROUP, CORP.
5 (1)
Индикатор обнаружения блоков ордеров мультитаймфреймов MT4. Функции - Полностью настраиваемая панель управления графиком, обеспечивает полное взаимодействие. - Скрыть и показать панель управления где угодно. - Обнаружение OB на нескольких таймфреймах. - Выберите количество OB для отображения. - Различные пользовательские интерфейсы OB. - Различные фильтры по OB. - Оповещение о близости OB. - Линии ADR High и Low. - Служба уведомлений (Экранные оповещения | Push-уведомления).
This indicator uses support and resistance, volume and some special formula to calculate the volume to filter the candles. If the volume reaches a specific value, And at the same time, Candle breaks the support/resistance line, There would be a signal and we can enter the market. Signals appear when the current candle closes. then you can enter the trade when a new candle appears. Please don't forget to follow your money management plan. MT5 Version Support/Resistance Breakout MT5 :   https:
FxBears Powers работает со всеми валютными парами, металлами, товарами, фьючерсами, индексами, энергоносителями, криптовалютой и всем ... и на всех таймфреймах от M1 до MN. Он основан на спросе и предложении и некоторых внутренних индикаторах, он дает вам очень сильную точку входа с нулевым проскальзыванием большую часть времени, вы можете проверить это в тесте. Он мгновенно отправляет вам сигналы на платформу вашего телефона, где бы вы ни находились, он содержит название пары, время, таймф
Представляем индикатор астрономии для MT4: Ваш незаменимый небесный товарищ в торговле Готовы ли вы поднять свой опыт торговли до небесных высот? Не ищите дальше, чем наш революционный индикатор астрономии для MT4. Этот инновационный инструмент выходит за рамки традиционных торговых индикаторов, используя сложные алгоритмы для предоставления вам беспрецедентных астрономических понимания и точных расчетов. Вселенская информация под рукой: Взгляните на обширную панель, раскрывающую сокровищницу ас
Gold Channel is a volatility-based indicator, developed with a specific timing algorithm for the XAUUSD pair, which consists of finding possible corrections in the market. This indicator shows two outer lines, an inner line (retracement line) and an arrow sign, where the theory of the channel is to help identify overbought and oversold conditions in the market. The market price will generally fall between the boundaries of the channel. If prices touch or move outside the channel it is a tra
Please send me Direct message on MQL5 CHAT after purchasing the Indicator for Training and Installation Support There are some additional files that is important to use with the Indicator . So be sure to contact me after purchasing the Indicator So that I can add you for training and support . If you find any difficulty with installation then send me Direct message here So that I can connect with you via Anydesk or Teamview for the product installation. " Smart Order Block Indicator " to find
Индикатор " ZigZag on Trend " представляет из себя помощника в определении направления движения цены, а так же калькулятора баров и пунктов. Состоит из трендового индикатора, следящей за направлением цены трендовой линией представленной в виде зигзага и счетчика вычисляющего число баров пройденных в направлении тренда и количество пунктов по вертикальной шкале.(расчеты ведутся по открытию бара) Индикатор не перерисовывается. Для удобства исполнен в виде окрашенных баров или в виде линий. Можно и
ECM Elite Channel is a volatility-based indicator, developed with a specific time algorithm, which consists of finding possible corrections in the market. This indicator shows two outer lines, an inner line (retracement line) and an arrow sign, where the channel theory is to help identify overbought and oversold conditions in the market. The market price will generally fall between the boundaries of the channel. If prices touch or move outside the channel, it's a trading opportunity. The
Способ применения Pair Trading Station Рекомендуется использовать Pair Trading Station на таймфрейме H1 с любой валютной парой. Чтобы получить сигналы на покупку и продажу, следуйте указанным ниже инструкциям по применению Pair Trading Station в терминале MetaTrader. При загрузке Pair Trading Station на график индикатор оценит доступные исторические данные на вашей платформе MetaTrader для каждой валютной пары. В самой начале на графике отобразятся исторические данные, доступные для каждой валют
Gann Signal - очень простой на первый взгляд индикатор, но внутри скрыт многолетний опыт изучения методов W.D.Ganna. Индикатор дает точные BUY/SELL сигналы, без перерисовки. Индикатор очень прост в применении. Вам нужно лишь прикрепить его на график и следовать его рекомендациям. Индикатор постоянно ведет анализ рынка на предмет возможностей для входа. Когда такая возможность появляется, индикатор дает сигнал в виде стрелки. Повторяюсь, все сигналы НЕ ПЕРЕРИСОВЫВАЮТСЯ! Индикатор предназначен для
Представляем удивительный форекс-индикатор "Miraculous": раскройте силу точного трейдинга Вы устали от бесконечного поиска лучшего форекс-индикатора, который действительно доставляет исключительные результаты на всех таймфреймах? Не ищите дальше! Представляем вам форекс-индикатор "Miraculous", который пришел, чтобы изменить ваш опыт трейдинга и поднять ваши прибыли на новый уровень. Основанный на передовых технологиях и годам тщательной разработки, форекс-индикатор "Miraculous" является вершиной
Этот индикатор представляет собой метод анализа рынка, основанный на статье «Математическая формула для прогнозов рынка», написанной У.Д. Ганном, в зависимости от метода квадрата девяти и квадрата 144. Руководство пользователя: Add Your review And contact us to get the user manual Вы можете купить полную версию MT5 у: https://www.mql5.com/ru/market/product/28669 Вы можете бесплатно протестировать на МТ4: https://www.mql5.com/en/market/product/15320?source=Site +Profile+Seller#!tab
3 Indicators in 1 indicator Strategy based on price action Made specifically for the best forex currency pairs Can be used in the best time frame of the market at a very reasonable price This indicator is basically 3 different indicatos . But we have combined these 3 indicators in 1 indicator so that you can use 3 indicators at the lowest price. All three strategies are based on price action. But based on different trends. Long term, medium term and short term Attributes : No repaintin
Introduction to X3 Chart Pattern Scanner X3 Cherart Pattern Scanner is the non-repainting and non-lagging indicator detecting X3 chart patterns including Harmonic pattern, Elliott Wave pattern, X3 patterns, and Japanese Candlestick patterns. Historical patterns match with signal patterns. Hence, you can readily develop the solid trading strategy in your chart. More importantly, this superb pattern scanner can detect the optimal pattern of its kind. In addition, you can switch on and off individu
Max Payne - это индикатор сигналов разворота/тренда, который подает сигналы в виде стрелки. Этот индикатор подает сигнал при закрытии одного и того же бара. Этот индикатор можно опускать на график несколько раз с разными периодами, чтобы получить двойное или тройное подтверждение сигналов. Индикатор легко настраивается, чтобы соответствовать любому стилю торговли, при этом он никогда не перерисовывается и не перерисовывается. После покупки вы получите полную систему, показанную на скриншотах, в
SNR LEVEL INDICATOR Accurate Snr level indicator will only display Fresh Levels that are close to the Current Market Price. This indicator is very accurate in mapping Support & resistance levels. there is an alert feature when the price TOUCHES the SNR LEVEL, WHEN CLOSE CANDLE BREAK/REJECT SNR LEVEL. INDICATOR MARKING : - SUPPORT LEVEL = V SHAPE - RESISTANCE LEVEL = APEX LEVEL - GAP RESISTANCE & GAP SUPPORT = OPEN CLOSE CANDLE - SUPPORT BECAME RESISTANCE & RESISTANCE BECAME SUPPORT INDICATOR
Представляем ON Trade Waves Patterns Harmonic Elliot Wolfe, передовой индикатор, разработанный для обнаружения разнообразных рыночных паттернов с использованием как ручных, так и автоматизированных методов. Вот как это работает: Гармонические паттерны: Этот индикатор может определять гармонические паттерны, появляющиеся на вашем графике. Эти паттерны важны для трейдеров, практикующих теорию гармонической торговли, как это описано в книге Скотта Карни "Гармоническая Торговля том 1 и 2". Независи
Цикличный индикатор для торговли и прогнозирования направления рынка. Показывает цикличное поведение цены в виде осциллятора. Дает сигналы открытия сделок при отбое от верхних и нижних границ осциллятора. В виде гистограммы показывает сглаженную силу тренда. Дополнит любую стратегию торговли, от скальпинга до внутри-дневной. Индикатор не перерисовывается. Подходит для использования на всех символах/инструментах. Подходящие тайм-фреймы для краткосрочного трейдинга M5, M15, M30. Для дневной и бо
Limitless MT4    - это универсальный индикатор который подойдет каждому как начинающему так и опытному трейдеру работает на всех валютных парах криптовалютах сыре акциях Limitless MT4 - уже настроен и не требует дополнительной настройки   А теперь главное Почему    Limitless MT4 ? 1 полное отсутствие перерисовки  2 два года тестирования лучшими специалистами в трейдинге 3 точность правильных сигналов превышает 80% 4 хорошо показал себя в торговле во время выхода новостей Правила торговли  1 сигн
Другие продукты этого автора
Renko is a well-known Japanese charting technique that removes time from the chart. Instead of drawing bars in constant intervals (time) as a normal chart would, a Renko chart does so only when price moves beyond a predefined amount. In a Renko chart, a bar is created when price exceeds the previous bar’s high or low by a predefined amount or what we call the Box Size. The result is a chart with equally sized bars running up or down in 45 degree angles. Such a chart offers the following advant
Trading the currency markets is a complex business, not least since we are dealing with pairs of currencies, and by inference, pairs of economies. All economies around the world are interlinked, and reflected in the constant ebb and flow of currency strength and weakness. The problem for us as traders is monitoring so many pairs simultaneously, since every pair does not move independently, but reflects the interrelated nature of this market. The Quantum Currency Heatmap delivers the informatio
Задумывались ли вы когда-нибудь, почему столько трейдеров остаются один на один со слабыми позициями не на той стороне рынка? Одна из причин этому - волатильность. Валютная пара неожиданно начинает движение на новостях или выходе экономических данных. Предвкушая быструю и легкую прибыль, на рынок сразу устремляются трейдеры. И вдруг цена разворачивается. Происходит это на всех таймфреймах и на всех символах. Закрытие свечи или бара с широким спредом сменяется резким разворотом цены, оставляя тре
Ваш успех как трейдера зависит от умения определять состояния перекупленности и перепроданности валюты или символа. То есть их силу или слабость. Именно этот подход и лежит в основе торговли на рынке Forex. Сделать это быстро и просто самому было бы практически невозможно, не будь индикатора Quantum Currency Strength - слишком много валют и символов. Вам определенно понадобится помощь! Индикатор Quantum Currency Strength был создан с единственной целью: дать вам глобальную картину по восьми осно
Валютные пары никогда не растут и не падают по прямой. Их подъемы и падения перемежаются откатами и разворотами. Каждый рост и каждое падение отражается и на вашем эмоциональном состоянии: надежда сменяется страхом, а когда он проходит, снова появляется надежда. Рынок использует ваш страх для того, чтобы не дать вам воспользоваться сильной позицией. В такие моменты вы наиболее уязвимы. Все изменится, если вы будете использовать индикатор Quantum Trend Monitor. Кроме того, в данном случае вы полу
Quantum Trends Indicator
QUANTUM TRADING SOFTWARE LIMITED
1 (1)
Один из старейших принципов торговли гласит "сделай тренд своим другом". Наверняка, вам встречалось это выражение. Однако на деле не все так просто! Во-первых, тренд сначала нужно определить, а потом еще и постараться удержаться в нем, а это не легко. Более того, максимально увеличить свою прибыль за счет этого чрезвычайно трудно. И вообще, как определить начало тренда? Если оглянуться назад, то это не составит никакого труда. Но в условиях живого рынка сделать это будет уже не так просто. Индик
Quantum Tick Volumes Indicator
QUANTUM TRADING SOFTWARE LIMITED
5 (2)
Многие Forex-трейдеры предполагают, что такого понятия как объем на валютном рынке не существует. И будут по-своему правы. Центральной биржевой площадки еще никто не создал. А даже если бы она и была, какие данные об объме она могла бы предоставить? Мы имеем дело с торговой активностью, которая выражается в тиковом объеме. Ведь в конечном итоге объем - это просто проявление активности покупателей и продавцов на рынке. То есть, для получения данных об объеме требуется анализ активности и наоборот
Quantum Dynamic Price Pivots Indicator
QUANTUM TRADING SOFTWARE LIMITED
1 (1)
Несмотря на то, что научиться интерпретировать свечной график может любой амбициозный трейдер на ценовом действии, на овладение этим навыком в совершенстве уйдут годы. Простым же смертным без помощи не обойтись. Вот где будет полезен индикатор Quantum Dynamic Price Pivots. Как ведущий индикатор, основанный исключительно на ценовом действии, он генерирует достаточное количество простых и ясных сигналов, с клинической эффективностью отмечая потенциальные точки разворота. Так же как объем и цена, п
Доллар США находится в центре всех финансовых рынков. Это основная резервная валюта и надежная гавань для инвестиций. В долларах США оцениваются все сырьевые товары. Более того, это валюта, цены на которую в самую первую очередь должен учитывать каждый трейдер! Знание ситуации по USD на валютном рынке имеет первостепенную важность при оценке рыночных настроений, рисков и денежных потоков в определенные рынки и инструменты. Зная, в каком направлении движется USD, все остальное - просто. Индикатор
Не хотелось бы констатировать очевидное, но американский доллар - это важнейшая валюта для трейдеров, и не только на рынке Forex. Без четкого представления о USD торговый процесс будет напоминать вождения автомобиля в условиях тумана. Когда произойдет авария - это лишь вопрос времени. Именно поэтому мы разработали два индекса USD. Первый называется Quantum DXY, а второй - Quantum USDX. В чем же их отличие? Толчком к созданию Quantum USDX послужил тот факт, что, по мнению многих Forex трейдеров,
Многие Forex трейдеры наслышаны и даже имели возможность убедиться на собственном горьком опыте в том, насколько опасной и нестабильной может быть торговля иеной. GBP/JPY - это, наверно, самая печально известная и непостоянная из всех пар. И неудивительно, что большинство трейдеров предпочитает не связываться с валютными парами, в состав которых входит иена. При этом они, скорее всего, не имеют четкого представления о направлении движения иены. Иначе торговля парами с иеной была бы более простой
Quantum Euro Index Indicator
QUANTUM TRADING SOFTWARE LIMITED
The Euro Currency Index or EURX , quantifies and displays strength and weakness of the single currency. As the index rises it signals strength in the single currency against a basket of currencies. As the index falls this signals weakness in the euro. The Quantum EURX is calculated from a basket of four currencies with each currency having an equal weighting of 25%. US Dollar Japanese Yen British Pound Australian Dollar The indicator can be used in one of three ways: First, to identify and con
This indicator has been developed to identify and display these trends quickly and easily, allowing you to see instantly, those currency pairs which are trending, and those which are not – and in all timeframes, with just one click. The 28 currency pairs are displayed as a fan as they sweep from strong to weak and back again, and this is why we call it the ‘currency array’. All 28 pairs are arrayed before you, giving an instant visual description of those pairs that are trending strongly, those
Trading the currency markets is a complex business, not least since we are dealing with pairs of currencies, and by inference, pairs of economies. All economies around the world are interlinked, and reflected in the constant ebb and flow of currency strength and weakness. The problem for us as traders is monitoring so many pairs simultaneously, since every pair does not move independently, but reflects the interrelated nature of this market. The Quantum Currency Heatmap delivers the informatio
The words powerful, unique and game changing are ones that are often over used when applied to trading indicators, but for the MT4/MT5 Quantum Camarilla levels indicator, they truly describe this new and exciting indicator completely. Why? Because the indicator has something to offer every trader, from the systematic to the discretionary and from swing trading to breakout trading. And it’s not an indicator which is simply used for entries. The Camarilla indicator delivers in all areas, from ge
The Quantum GBPX is the latest addition to our suite of currency indices, and one which we have been asked for many times, and even more so since Brexit. It is an index which has taken us some time to develop, and through a series of complex calculations draws its primary data from a basket of currencies based on the old style dollar index, the Dixie. This is converted to a chart for the British pound. The result is an accurate index which describes strength and weakness for the GBP currency in
If there is only one MT5 indicator you ever buy for trading forex – this has to be it. Your success as a forex trader depends on being able to identify when a currency or currency pair is oversold or overbought. If it is strong or weak. It is this concept which lies at the heart of forex trading. Without the Quantum Currency Strength indicator, it is almost impossible. There are simply too many currencies and too many pairs to do this quickly and easily yourself. You need help! The Quantum C
The Euro Currency Index or EURX , quantifies and displays strength and weakness of the single currency. As the index rises it signals strength in the single currency against a basket of currencies. As the index falls this signals weakness in the euro. The Quantum EURX is calculated from a basket of four currencies with each currency having an equal weighting of 25%. US Dollar Japanese Yen British Pound Australian Dollar The indicator can be used in one of three ways: First, to identify and con
Have you ever wondered why so many Forex traders get trapped in weak positions on the wrong side of the market? One of the easiest ways the market makers do this, is by using volatility. A currency pair moves suddenly, often on a news release or economic data. Traders jump in, expecting some quick and easy profits, but the move suddenly moves in the opposite direction. This happens in all timeframes, and in all currency pairs. The candle or bar closes, with a wide spread, but then reverses sharp
If you've been trading for any time, you will almost certainly have come across the concept of support and resistance. This powerful and simple concept lies at the heart of technical analysis. It forms the cornerstone of price action trading. Strange to consider therefore, that such a key component of the traders chart has largely been ignored. Most Forex traders still draw their lines manually, leading to a crude interpretation of these key levels. Even those companies who have developed a trad
One of the oldest maxims in trading is ‘let the trend be your friend’. You must have come across it! This is easier said than done! First, you have to identify one, then you have to stay in – not easy. Staying in a trend to maximise your profits is extremely difficult. In addition, how do you know when a trend has started? It’s very easy to look back and identify the trend. Not so easy at the live edge of the market. The Quantum Trends indicator is the ‘sister’ indicator to the Quantum Trend Mon
Of all the four principle capital markets, the world of foreign exchange trading is the most complex and most difficult to master, unless of course you have the right tools! The reason for this complexity is not hard to understand. First currencies are traded in pairs. Each position is a judgment of the forces driving two independent markets. If the GBP/USD for example is bullish, is this being driven by strength in the pound, or weakness in the US dollar. Imagine if we had to do the same thing
We don’t want to become boring, but the US dollar is the most important currency for all traders, and not just in Forex. Trading without a clear view of the US dollar is like driving in fog. Sooner or later you are going to crash – it’s just a question of when. That’s why at Quantum we have developed two US dollar indices. The first is the Quantum DXY, and the second is the Quantum USDX. So what’s the difference? Well, the reason we created the Quantum USDX is that many Forex traders believe tha
Many Forex traders have either been told, or have learnt from painful experience, that the Yen currency pairs can be both dangerous and volatile to trade. The GBP/JPY is perhaps the most infamous and volatile of all. No wonder then, that many Forex traders simply stay away from the Yen currency pairs. But then they probably don’t have a very clear idea of where the Yen itself is heading. If they did, then trading the Yen pairs would be much more straightforward. And this is where the Quantum JPY
For aspiring price action traders, reading a candle chart at speed can be learnt, but is a skill which takes years to perfect. For lesser mortals, help is required, and this is where the Quantum Dynamic Price Pivots indicator steps in to help. As a leading indicator based purely on price action, the indicator delivers simple clear signals in abundance, highlighting potential reversals with clinical efficiency. Just like volume and price, pivots are another ‘predictive’ indicator, and a leading i
Quantum Tick Volumes Indicator for MT5
QUANTUM TRADING SOFTWARE LIMITED
5 (1)
Many Forex traders assume there is no volume in the foreign exchange market. And they would be correct. There is no central exchange, not yet anyway. And even if there were, what would it report? What there is however is activity, and this is captured as tick volume. After all, volume is simply displaying activity, the buyers and sellers in the market. So for volume read activity, and for activity read volume – simple. The MT5 platform delivers tick data which the Quantum Tick Volumes indicator
Currency pairs never go up or down in a straight line. They rise and fall constantly, creating pullbacks and reversals. And with each rise and fall, so your emotions rise and fall. Hope, then fear, then hope. This is when the market will try to frighten you out of a strong position. It is when you are most vulnerable. But not if you have the Quantum Trend Monitor. And here, you even get two indicators for the price of one! The Quantum Trend Monitor has been designed to absorb these temporary pau
The Quantum VPOC indicator has been developed to expand the two dimensional study of volume and price, to a three dimensional one which embraces time. The volume/price/time relationship then provides real insight to the inner workings of the market and the heartbeat of sentiment and risk which drives the price action accordingly. The Quantum VPOC indicator displays several key pieces of information on the chart as follows: Volume Profile - this appears as a histogram of volume on the vertical pr
Фильтр:
elite luis
3331
elite luis 2023.03.26 19:39 
 

Agreed with Peterson! Amazing indicator! and very useful tool, Big Thank you to Author :)

Peterson Ndugga
264
Peterson Ndugga 2017.02.25 08:13 
 

The VPOC is Very powerful & accurate...I mostly use it for support & resistance levels & it has never predicted any wrong level. Thanx much💪💪💪

Ответ на отзыв
Версия 2.1 2018.08.16
- Made improvements to rendering the volume profile to scale properly especially after holidays/weekends.