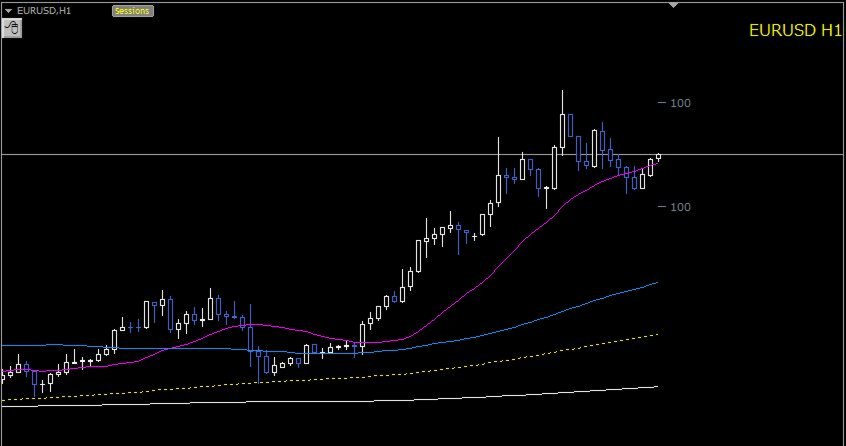
Mtf 3MA with the 200MA
- Индикаторы
- Tadanori Tsugaya
- Версия: 1.0
In addition to the MA of the set period, the MAs of the two higher timeframes with the same period are displayed on the chart simultaneously (though in a simulated way). No matter which timeframe you switch to, it will display the MA for that timeframe as well as the MAs for the two higher timeframes. Additionally, it will show the 200 MA as well!
To display the MA for the higher timeframes on the current chart, you need to set the MA calculated using the Moving Average indicator.
If you try to do this across all timeframes...
This indicator helps eliminate that hassle and makes things cleaner.
For example, for a 15-minute chart with a 21-period MA, it will simulate the 1-hour MA as a 21-period MA on the 15-minute chart, showing it as a 84-period MA. In this case, the 4-hour MA would be displayed as MA336.
The calculations for 1 week, 1 month, and 1 year are based on 5 days, 4 weeks, and 12 months, respectively.
While there may be differences from the actual higher timeframe MAs, this approach makes it easier to see how close they are.
If you're interested, please give it a try!
Important Notes: There may be issues with the proper functioning due to conflicts with other indicators. The performance might be slow or behave erratically depending on your computer's specifications, memory, etc.