• Обзор
  • Отзывы
  • Обсуждение

Volume and Tick Profile

Volume Profile Indicator – User Guide  Description:

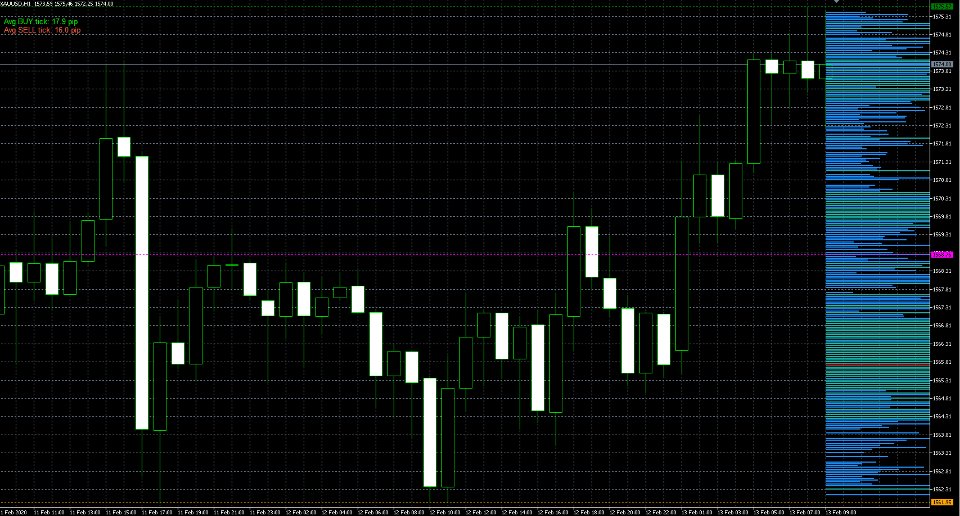
The Volume Profile Indicator is a powerful tool designed for MetaTrader 5. It visualizes market activity using volume distribution across price levels, showing:

  • Histogram of volume at each price bin

  • POC (Point of Control) – the price with the highest traded volume

  • Value Area – the range covering a configurable percentage of volume (e.g. 70%)

  • Support levels: Min, Max, and Pivot

  • Average tick size for BUY and SELL movements

 Inputs and Parameters:
Parameter Description
RefreshPeriodMinutes Time interval for indicator refresh (in minutes)
ProfileDurationMinutes How far back to calculate volume profile (in minutes)
UseTickVolume If true , uses tick volume; if false , uses real volume (if available)
ValueAreaPercent Percentage of total volume to include in Value Area
BinSizePips Size of each price bin in pips
HistogramColor Color for normal volume bars
POCColor Color for the Point of Control line/bar
VAColor Color for bars within the Value Area
 Level Settings:
Parameter Description
ShowLevels Toggle to display Min, Max, and Pivot levels
MinLevelColor Color of the Minimum price level line
MaxLevelColor Color of the Maximum price level line
PivotLevelColor Color of the Pivot line (midpoint of min and max)
LevelsLineWidth Line width for levels
LevelsLineStyle Line style (solid, dotted, dashed, etc.)
 Average Tick Stats:
Parameter Description
AvgBuyTickColor Color of the label showing average upward tick movement
AvgSellTickColor Color of the label showing average downward tick movement
 Visual Elements:
  • Volume bars are displayed horizontally on price levels.

  • POC is highlighted for easy identification.

  • Optional support levels and tick stats are shown in the upper left of the chart.

  • The indicator is designed to run in the main chart window.

 Use Cases:
  • Identifying strong price levels with high trading interest.

  • Detecting potential support/resistance zones.

  • Confirming volume-weighted market structure.

  • Analyzing market reactions to price imbalance zones.


Рекомендуем также
Market Profile 3 ForexArby com
Hussien Abdeltwab Hussien Ryad
3.93 (14)
Market Profile 3 MetaTrader 5 indicator  version 4.70— is a classic Market Profile implementation that can show the price density over time, outlining the most important price levels, value area, and control value of a given trading session. This indicator can be attached to timeframes between M1 and D1 and will show the Market Profile for daily, weekly, monthly, or even intraday sessions. Lower timeframes offer higher precision. Higher timeframes are recommended for better visibility. It is als
FREE
AvgVolumes
Marco Montemari
5 (1)
Индикатор основан на стандартном индикаторе объемов Volumes. Он рассчитывает средний объем на основе выбранных последних N баров, и если значение объема превышает указанное среднее значение в %, цвет индикатора изменится. Индикатор отображается в отдельном окне. Входные параметры Bars used to calculate the average volume - количество баров для расчета среднего объема. Threshold (in %) for changing the color of the Bar - порог в %, при котором цвет бара изменится.
FREE
Haven Volume Profile - это многофункциональный индикатор для анализа объемного профиля, который помогает определять ключевые ценовые уровни на основе распределения объема торгов. Он предназначен для профессиональных трейдеров, желающих более точно понимать рынок и выявлять важные точки для входа и выхода из сделок. Другие продукты ->  ЗДЕСЬ Основные возможности: Расчет Point of Control (POC) - уровня максимальной торговой активности, который позволяет выявить наиболее ликвидные уровни Определени
FREE
Индикатор Volume Weighted ATR - полезный инструмент для измерения рыночной активности. В его основе лежит идея индикатора Volume-Weighted ATR. Сочетание этих двух элементов помогает определить потенциальные поворотные точки или возможности для прорыва. Индикатор для классификации активности рынка использует скользящую среднюю и ее мультипликаторы. Соответственно, где находится бар VWATR (относительно скользящей средней), он маркируется как сверхнизкий, низкий, средний, высокий, очень высокий или
FREE
Индикатор вычисляет профиль объёма и выставляет метки, соответствующие уровням VAL, VAH и POC, для каждой свечи индивидуально. Особенности работы индикатора Индикатор работает на периодах от M3 до MN, но для вычислений использует исторические данные меньших периодов: M1 - для периодов от M3 до H1, M5 - для периодов от H2 до H12, M30 - для периода D1, H4 - для периода W1, D1 - для периода MN. Цвет и положение меток VAL, VAH и POC на текущей свече считаются корректными только по времени близкому
FREE
Waves Sizer
Flavio Javier Jarabeck
3.67 (6)
Wyckoff fans, enjoy! Ideally to be used with the Weis Waves indicator, but it can be easily used alone, the Waves Sizer puts the range (in resulting Price movement) done by the Price on its market swings. You can control how accurate or loose will be the swings. This tool is very helpful for visually know how much the Price has traveled in your Timeframe. This way you can confront this level of effort with the resulting Volume, etc... Weis Waves indicator: https://www.mql5.com/en/market/produc
FREE
Индикатор подчёркивает те моменты, которые профессиональный трейдер видит в обычных индикаторах. VisualVol визуально отображает разные показатели волатильности в единой шкале и общем масштабе. Подчёркивает цветом превышение показателей объёма. Одновременно могут быть отображены Тиковый и Реальный Объем, Действительный диапазон, ATR, размер свечи и ретурнс (разница open-close). Благодаря VisualVol вы увидите рыночные периоды и подходящее время для разных торговых операций. Эта версия предназначен
FREE
Aggression Volume
Flavio Javier Jarabeck
4.14 (14)
Aggression Volume Indicator is the kind of indicator that is rarely found in the MQL5 community because it is not based on the standard Volume data provided by the Metatrader 5 platform. It requires the scrutiny of all traffic Ticks requested on the platform... That said, Aggression Volume indicator requests all Tick Data from your Broker and processes it to build a very special version of a Volume Indicator, where Buyers and Sellers aggressions are plotted in a form of Histogram. Additionally,
FREE
Value Chart Candlesticks
Flavio Javier Jarabeck
4.73 (11)
The idea of a Value Chart indicator was presented in the very good book I read back in 2020 , " Dynamic Trading Indicators: Winning with Value Charts and Price Action Profile ", from the authors Mark Helweg and David Stendahl. The idea is simple and the result is pure genius: Present candlestick Price analysis in a detrended way! HOW TO READ THIS INDICATOR Look for Overbought and Oversold levels. Of course, you will need to test the settings a lot to find the "correct" one for your approach. It
FREE
Simple Vwap with the daily, weekly and monthly VWAP is the abbreviation for   volume-weighted average price , which is a technical analysis tool that shows the ratio of an asset's price to its total trade volume. It provides traders and investors with a measure of the average price at which a stock is traded over a given period of time. How it's used Identify entry and exit points:   Traders can use VWAP to determine when to buy or sell an asset.   Understand price trends :  Traders can use V
FREE
MW Volume
Martin Bittencourt
3.8 (5)
The Martinware Volume indicator plots a colored moving average over volume bars. The coloring uses three colors and can be done in different ways choosable by the user and is applied both to the average as to the volume bars. Three types of coloring are possible: None: no coloring is done Increasing or decreasing: changes the color depending on the current value being bigger or lesser than the previous one Volume relative to average: colors vary if the current volume is bigger or lesser then
FREE
Weis Waves
Flavio Javier Jarabeck
2.83 (18)
The original author is David Weis, an expert in the Wyckoff Method. The Weis Wave is a modern adaptation of the 1930's Wyckoff Method, another expert in Tape Reading techniques and Chart Analysis. Weis Waves takes market volume and stacks it into waves according to price conditions giving the trader valuable insights about the market conditions. If you want to learn more about this subject you can find tons of videos in YouTube. Just look for "The Wickoff Method", "Weis Wave" and "Volume Spread
FREE
Индикатор анализирует шкалу объёмов и разделяет её на две компоненты - объёмы продавцов и объёмы покупателей, а также вычисляет дельту и кумулятивную дельту. Индикатор не мерцает и не перерисовывает, вычисления и отрисовку производит достаточно быстро, используя при этом данные с младших (относительно текущего) периодов. Режимы работы индикатора переключаются с помощью входной переменной Mode : Buy - отображает только объёмы покупателей. Sell - отображает только объёмы продавцов. BuySell - отобр
FREE
Dual RSI
Paul Conrad Carlson
3 (1)
Indicator alerts for Dual Relative strength index rsi. Large rsi preset at 14 is below 30 small rsi preset at 4 is below 10 for buy bullish signals . Large rsi preset are 14 is above 70 small rsi preset at 4 is above 90 for sell bearish signals . Includes mobile and terminal alerts. draws lines when alerts. This indicator can help identify extremes and then the tops or bottoms of those extremes .
FREE
Tough Position Panel - Real-Time Position Insights Overview: Enhance your trading experience with the Trade Info Panel , a powerful and lightweight indicator for MetaTrader 5. This tool provides real-time insights into your open positions directly on your chart, keeping you informed at all times. Whether you're a beginner or a seasoned trader, this panel ensures you never lose track of your trades. Key Features: Always-Visible Panel: Displays critical trade information in the upper-right corner
FREE
Swiss VWAPsimple Motivation Did not find free VWAP that works, the one that I found craseh. So I created a VWAP which calculates values only for the actual day. So computer resouces are not over stressed. What is VWAP, how is it used?  VWAP stands for Volume Weighed Average Price, it calculates the running sum of tick volume and the runnung sum of price times tickvolume. The division of these sums result in a weighed price (Sum P*V/Sum V). The calculation starts normally at midnight. The values
FREE
Introduction This indicator detects volume spread patterns for buy and sell opportunity. The patterns include demand and supply patterns. You might use each pattern for trading. However, these patterns are best used to detect the demand zone (=accumulation area) and supply zone (=distribution area). Demand pattern indicates generally potential buying opportunity. Supply pattern indicates generally potential selling opportunity. These are the underlying patterns rather than direct price action. T
FREE
VWAP Indicator
LUC JACOBUS A VERHEECKE
4.13 (23)
Volume Weighted Average Price (VWAP) The volume weighted average price (VWAP) is a  trading   benchmark  used by traders that gives the average price a security has traded at throughout the day, based on both volume and price. It is important because it provides traders with insight into both the trend and value of a security. This indicator VWAP V2 is free and is the manual version of the extended Easy VWAP indicator (30 Euro), where the date and time properties are automatically entered. With
FREE
The Weis Wave first takes the market volume and then organizes it with the price into Wave charts. It is the only software that will present the true picture of the market before you. If anyone of you, has watched an intraday price movement then you must know that it unfolds in a series of selling as well as buying waves-a procedures tearing down and building up. Wave analysis is an integral part of the trading method. The indicator helps to deal with today’s volatile market. Moreover, it works
FREE
Order Book, известный также как Market Book, глубина рынка, стакан цен, Level 2, - это предоставляемая брокером динамически обновляемая таблица с данными по текущим объемам торговых заявок на покупку и продажу для различных уровней цен вблизи Bid и Ask конкретного финансового инструмента. MetaTrader 5 предоставляет возможность трансляции стакана цен , но только в реальном времени. Данный индикатор OrderBook Cumulative Indicator позволяет аккумулировать данные стакана онлайн и визуализировать их
Ловец трендов: Стратегия Ловец трендов с индикатором оповещения - это универсальный инструмент технического анализа, который помогает трейдерам определять рыночные тренды и потенциальные точки входа и выхода. Он представляет собой динамичную стратегию Ловец трендов, адаптирующуюся к рыночным условиям для четкого визуального представления направления тренда. Трейдеры могут настраивать параметры в соответствии со своими предпочтениями и уровнем риска. Индикатор помогает в идентификации тренда, с
FREE
Tapeworm
Nikolay Mitrofanov
Индикатор преобразует две скользящие средние в гистограммы и закрашивает их область пресечения. Есть настройка   shift trick  она используется для сглаживания результата расчетов. Можно увидеть изменения, если уменьшить этот параметр до 1(минимальное значение). Доступные средние: MA Simple      MA Exponential MA LinearWeighted MA Smoothed DEMA TEMA и RSI    - как бонус По умолчанию в верхней части гистограммы отображается быстрая MA, внизу - медленная. Можно поменять их местами, если хочется. sh
FREE
Tick Speed Free MT5
John Louis Fernando Diamante
Tick Speed Free povides a on-chart label of tick speed to allow you to see the ebb and flow of market activity. Observing rises and falls in tick speed may allow you to better time entries to reduce slippage and re-quotes. Options include: - colores for low-mid-high tick speeds - placement and styling - prefix & suffix to customise the speed label Troubleshooting: - Note, in the tester environment, tick timings are limited to what is supplied by the tester environment and it's speed - If there
FREE
This indicator sums up the difference between the sells aggression and the buys aggression that occurred in each Candle, graphically plotting the waves of accumulation of the aggression volumes.   Through these waves an exponential average is calculated that indicates the direction of the business flow. Note: This indicator DOES NOT WORK for Brokers and/or Markets WITHOUT the type of aggression (BUY or SELL).   Be sure to try our Professional version with configurable features and alerts:  Agre
FREE
High Low Open Close
Alexandre Borela
4.98 (43)
Если вам нравится этот проект, оставьте 5-звездочный обзор. Данный показатель рисует открытые, высокие, низкие и закрывающие цены на указанные период и его можно отрегулировать для специфического часового пояса. Это важные уровни, которые выглядят многие институциональные и профессиональные трейдеры и могут быть полезны для вас, чтобы знать места, где они могут быть больше активный. Доступные периоды: Предыдущий день. Предыдущая неделя. Предыдущий месяц. Предыдущий квартал. Предыдущий год. Или
FREE
This is a buyer and seller aggression indicator that analyzes the shape of each candle and project this data in a histogram form. There are 4 histograms in one. On the front we have two: Upper - Buyer force. Lower - Seller force. At the background we also have two histogram, both with same color. They measure the combined strenght of buyers and sellers. This histograms can be turned off in Input Parameters. It is also possible to have the real or tick volume to help on this force measurement. IN
FREE
Important Lines
Terence Gronowski
4.86 (21)
Индикатор отображает линии пивот, уровни максимума, минимума и закрытия предыдущего дня, а также минимум и максимум предыдущего часа. Нужно просто установить этот индикатор на график, чтобы отобразить все эти важные линии, нет необходимости настраивать множество отдельных индикаторов. Почему важны определенные линии Максимум и минимум предыдущего дня : эти уровни используются для торговли на дневном графике. Очень часто, если цена становится выше или ниже минимума/максимума предыдущего дня, про
FREE
Investment Castle Volatility Index
Ahmed Alaaeldin Abdulrahman Ahmed Elherzawi
5 (2)
Investment Castle Volatility Index has the following features: 1. This indicator shows the volumes of the current symbol and the market volatility. 2. This indicator is built-in in the Investment Castle EA which works as volatility index for the EA dynamic distance and opposite start. 3. Parameters available for optimization for each pairs. 4. Works with any chart.
FREE
This robot sends Telegram notifications based on the coloring rules of PLATINUM Candle indicator. Example message for selling assets: [SPX][M15] PLATINUM TO SELL 11:45. Example message for buying assets : [EURUSD][M15] PLATINUM TO BUY 11:45 AM. Before enable Telegram notifications  you need to create a Telegram bot, get the bot API Key and also get your personal Telegram chatId. It's not possible to send messages to groups or channels. You can only send messages to your user chatId. You should
FREE
VP hidden
Emr Aljnaby
4.22 (9)
The indicator works to convert normal volume into levels and determine financial liquidity control points. It is very similar in function to Fixed Volume Profile. But it is considered more accurate and easier to use than the one found on Trading View because it calculates the full trading volumes in each candle and in all the brokers present in MetaTrade, unlike what is found in Trading View, as it only measures the broker’s displayed prices. To follow us on social media platforms: telegram
FREE
С этим продуктом покупают
Раскройте силу торговли трендами с помощью индикатора Trend Screener: вашего идеального решения для торговли трендами, основанного на нечеткой логике и мультивалютной системе! Повысьте уровень своей торговли по тренду с помощью Trend Screener, революционного индикатора тренда, основанного на нечеткой логике. Это мощный индикатор отслеживания тренда, который сочетает в себе более 13 инструментов и функций премиум-класса и 3 торговые стратегии, что делает его универсальным выбором для превращения
Moneytron — профессиональный сигнальный индикатор тренда Индикатор Moneytron предназначен для тех, кто хочет зарабатывать стабильно и системно, торгуя по тренду. Он автоматически определяет: • Точки входа (Buy/Sell сигналы) • 3 уровня тейк-профита (TP1, TP2, TP3) • 3 уровня стоп-лосса (SL1, SL2, SL3) • Показывает реальную статистику успешности сделок прямо на графике Особенности: • Работает на всех валютных парах и металлах • Идеален для таймфреймов M30, H1 и выше • Подходит как для начинающи
Golden Trend Indicator MT5
Noha Mohamed Fathy Younes Badr
4.88 (17)
Golden Trend indicator  is The best indicator for predicting trend movement this indicator never lags and never repaints and never back paints    and give  arrow buy and sell    before the candle appear  and it will help you and  will make your trading decisions clearer its work on all currencies and  gold and crypto and all time frame This unique  indicator uses very secret algorithms to catch the  trends, so you can trade using this indicator and see the trend clear on charts  manual guide and
PUMPING STATION – Ваша персональная стратегия "всё включено" Представляем PUMPING STATION — революционный индикатор Forex, который превратит вашу торговлю в увлекательный и эффективный процесс! Это не просто помощник, а полноценная торговая система с мощными алгоритмами, которые помогут вам начать торговать более стабильно! При покупке этого продукта вы БЕСПЛАТНО получаете: Эксклюзивные Set-файлы: Для автоматической настройки и максимальной эффективности. Пошаговое видео-руководство: Научитесь т
Скринер поддержки и сопротивления находится в одном индикаторе уровня для MetaTrader, который предоставляет несколько инструментов внутри одного индикатора. Доступные инструменты: 1. Скринер структуры рынка. 2. Зона бычьего отката. 3. Зона медвежьего отката. 4. Ежедневные опорные точки 5. еженедельные опорные точки 6. ежемесячные опорные точки 7. Сильные поддержка и сопротивление, основанные на гармоническом паттерне и объеме. 8. Зоны уровня берега. ПРЕДЛОЖЕНИЕ ОГРАНИЧЕННОЕ ВРЕМЯ: Индикатор подд
FX Power: Анализируйте силу валют для более эффективной торговли Обзор FX Power — это ваш незаменимый инструмент для понимания реальной силы валют и золота в любых рыночных условиях. Определяя сильные валюты для покупки и слабые для продажи, FX Power упрощает принятие торговых решений и выявляет высоковероятные возможности. Независимо от того, хотите ли вы следовать за трендами или предсказывать развороты с использованием экстремальных значений дельты, этот инструмент идеально адаптируется под
FX Volume MT5
Daniel Stein
4.82 (17)
FX Volume: Оцените подлинную динамику рынка глазами брокера Краткий обзор Хотите вывести свою торговлю на новый уровень? FX Volume дает вам информацию в реальном времени о том, как розничные трейдеры и брокеры распределяют свои позиции — задолго до появления запаздывающих отчетов типа COT. Независимо от того, стремитесь ли вы к стабильной прибыли или ищете дополнительное преимущество на рынке, FX Volume поможет выявлять крупные дисбалансы, подтверждать пробои и совершенствовать управление риск
VERSION MT4        —        ИНСТРУКЦИЯ RUS         —        INSTRUCTIONS  ENG Основные функции: Точные сигналы на вход БЕЗ ПЕРЕРИСОВКИ! Если сигнал появился, он остается актуальным! Это важное отличие от индикаторов с перерисовкой, которые могут предоставить сигнал, а затем изменить его, что может привести к потере средств на депозите. Теперь вы сможете входить в рынок с большей вероятностью и точностью. Также есть функция окрашивания свечей после появления стрелки до достижения цели (take pr
Представляю Вам отличный технический индикатор GRABBER, который работает, как готовая торговая стратегия "Все включено"! В одном программном коде интегрированы мощные инструменты для технического анализа рынка, торговые сигналы (стрелки), функции алертов и Push уведомлений.  Каждый покупатель этого индикатора получает дополнительно БЕСПЛАТНО:  Grabber Утилиту для автоматического управления открытыми ордерами, Пошаговый видео-мануал : как установить, настроить и торговать, Авторские сет-файлы дл
Индикатор, который переосмыслил трейдинг, стал эталоном анализа графиков и задал новые стандарты в трейдинге. Разворотные зоны /  Зоны пикового объема  /   Активные зоны крупного игрока    ИНСТРУКЦИЯ RUS        INSTRUCTIONS  ENG    /  Рекомендуем использовать с индикатором -  TPSpro TREND PRO Каждый покупатель этого индикатора получает дополнительно БЕСПЛАТНО:  6 месяцев доступа к торговым сигналам от сервиса RFI SIGNALS — готовые точки входа по алгоритму TPSproSYSTEM. Обучающие материал
FX Levels: Исключительно точные уровни поддержки и сопротивления для всех рынков Краткий обзор Ищете надежный способ определить уровни поддержки и сопротивления для любых инструментов—валют, индексов, акций или сырьевых товаров? FX Levels сочетает традиционный «Lighthouse» метод с современным динамическим подходом, обеспечивая почти универсальную точность. Благодаря сочетанию опыта реальных брокеров и автоматических ежедневных плюс «в реальном времени» обновлений, FX Levels поможет вам выявлят
Gold Stuff mt5
Vasiliy Strukov
4.93 (178)
Gold Stuff mt5 - трендовый индикатор, разработанный специально для золота, также может использоваться на любых финансовых инструментах. Индикатор не перерисовывается и не запаздывает. Рекомендуемый тайм-фрейм H1.  Свяжитесь со мной сразу после покупки для получения   персонального бонуса!   Вы можете получить бесплатную копию нашего индикатора Strong Support and Trend Scanner, пожалуйста, в личку. мне! Настройки и мануал  здесь ПАРАМЕТРЫ Draw Arrow -   вкл.выкл. отрисовку стрелок на графике. Al
IX Power MT5
Daniel Stein
4.86 (7)
IX Power: Получите рыночные инсайты для индексов, сырьевых товаров, криптовалют и форекс Обзор IX Power — это универсальный инструмент для анализа силы индексов, сырьевых товаров, криптовалют и форекс. В то время как FX Power предлагает наивысшую точность для валютных пар, используя данные всех доступных пар, IX Power фокусируется исключительно на данных рынка базового символа. Это делает IX Power отличным выбором для некорреляционных рынков и надежным инструментом для форекса, если вам не нуж
Это, пожалуй, самый полный индикатор автоматического распознавания гармонического ценообразования, который вы можете найти для платформы MetaTrader. Он обнаруживает 19 различных паттернов, воспринимает проекции Фибоначчи так же серьезно, как и вы, отображает зону потенциального разворота (PRZ) и находит подходящие уровни стоп-лосс и тейк-профит. [ Руководство по установке | Руководство по обновлению | Устранение неполадок | FAQ | Все продукты ] Он обнаруживает 19 различных гармонических ценов
FourAverage - новое слово в обнаружении тренда. С развитием информационных технологий и большого количества участников финансовые рынки всё менее поддаются анализу устаревшими индикаторами. Обычные технические средства анализа, такие как Скользящая средняя или Стохастик, в чистом виде не способны определять направления тренда или его разворот. Может ли один индикатор указывать правильное направление будущей цены, не меняя своих параметров, на истории 14 лет? При этом не терять адекватность при б
Matrix Arrow Indicator MT5
Juvenille Emperor Limited
5 (13)
Индикатор Matrix Arrow MT5   — это уникальный индикатор тренда 10 в 1, следующий за   100% неперерисовывающимся   индикатором с несколькими таймфреймами, который можно использовать на всех символах/инструментах:   форекс ,  товары ,   криптовалюты ,   индексы ,  акции . Индикатор Matrix Arrow MT5  будет определять текущую тенденцию на ранних этапах, собирая информацию и данные от до 10 стандартных индикаторов, а именно: Индекс среднего направленного движения (ADX) Индекс товарного канала (CCI)
Индикатор Trend Line Map является дополнением к индикатору Trend Screener Indicator. Он работает как сканер всех сигналов, генерируемых скринером тренда (сигналы линии тренда). Это сканер линий тренда на основе индикатора Trend Screener. Если у вас нет индикатора Trend Screener Pro, программа Trend Line Map Pro работать не будет. It's a Trend Line Scanner based on Trend Screener Indicator. If you don't have Trend Screener Pro Indicator,     the Trend Line Map Pro will not work . Зайдя в наш
Эта панель показывает последние доступные   гармонические паттерны   для выбранных символов, так что вы сэкономите время и будете более эффективны /   MT4 версия . Бесплатный индикатор:   Basic Harmonic Pattern Колонки индикатора Symbol:   отображаются выбранные символы Trend   :   бычий или медвежий Pattern   :   тип паттерна (Гартли, бабочка, летучая мышь, краб, акула, шифр или ABCD) Entry   :   цена входа SL:   цена стоп-лосса TP1:   цена первого тейк-профита TP2:   цена второго тейк-профи
Уникальный индикатор, реализующий профессиональный и количественный подход к торговле на возврате к среднему. Он использует тот факт, что цена отклоняется и возвращается к среднему предсказуемым и измеримым образом, что позволяет использовать четкие правила входа и выхода, которые значительно превосходят неколичественные торговые стратегии. [ Installation Guide | Update Guide | Troubleshooting | FAQ | All Products ] Четкие торговые сигналы Удивительно легко торговать Настраиваемые цвета и разме
FX Dynamic: Отслеживайте волатильность и тренды с помощью настраиваемого ATR-анализа Обзор FX Dynamic — это мощный инструмент, который использует расчёты среднего истинного диапазона (ATR) для предоставления трейдерам непревзойдённой информации о дневной и внутридневной волатильности. Настраивая понятные пороги волатильности (например, 80%, 100% и 130%), вы можете быстро определять потенциальные возможности для прибыли или получать предупреждения, когда рынок выходит за типичные рамки. FX Dyna
Прежде всего стоит подчеркнуть, что этот Торговый Инструмент является Неперерисовывающимся Нерепейнтинговым Индикатором, что делает его идеальным для профессиональной торговли. Онлайн-курс, руководство пользователя и демонстрация. Индикатор Концепций Умного Действия Цены - очень мощный инструмент как для новичков, так и для опытных трейдеров. Он объединяет более 20 полезных индикаторов в одном, комбинируя передовые торговые идеи, такие как анализ Inner Circle Trader и стратегии торговли концеп
- Lifetime update free Contact me for instruction, any questions! Related Product:  Gold Trade Expert MT5 - Non-repaint - I just sell my products in Elif Kaya Profile, any other websites are stolen old versions, So no any new updates or support. Introduction The breakout and retest strategy is traded support and resistance levels. it involves price breaking through a previous level.  The break and retest strategy is designed to help traders do two main things, the first is to avoid false breako
Устали от построения линий поддержки и сопротивления? Сопротивление поддержки - это мульти-таймфреймовый индикатор, который автоматически обнаруживает и отображает линии поддержки и сопротивления на графике с очень интересным поворотом: поскольку ценовые уровни тестируются с течением времени и его важность возрастает, линии становятся более толстыми и темными. [ Руководство по установке | Руководство по обновлению | Устранение неполадок | FAQ | Все продукты ] Повысьте технический анализ в одноч
Royal Scalping Indicator is an advanced price adaptive indicator designed to generate high-quality trading signals. Built-in multi-timeframe and multi-currency capabilities make it even more powerful to have configurations based on different symbols and timeframes. This indicator is perfect for scalp trades as well as swing trades. Royal Scalping is not just an indicator, but a trading strategy itself. Features Price Adaptive Trend Detector Algorithm Multi-Timeframe and Multi-Currency Trend Low
Legend mt5
Vladyslava Shaviernieva
This is an indicator that includes the best basic forex indicators , without redrawing. Based on this data, a sell or buy signal is generated. It does not disappear anywhere after the signal, which gives us the opportunity to see the results on the history. It can be used on any currency pair, crypto, metals, stocks It is best used on an hourly chart, but other periods are also acceptable. The best results for the period H1,H4,daily If customers have any questions, I will answer them and af
Gold Trend 5
Sergei Linskii
3.5 (2)
Gold Trend – хороший биржевой технический индикатор. Алгоритм индикатора анализирует движение цены актива и отражает волатильность и потенциальные зоны для входа. Самые лучшие сигналы индикатора: Для SELL = красная гистограмма + красный указатель SHORT + желтая сигнальная стрелка в этом же направлении. Для BUY = синяя гистограмма + синий указатель LONG + аква сигнальная стрелка в этом же направлении.   Преимущества индикатора: И ндикатора выдает сигналы с высокой точностью. Подтвержденный сигна
Special offer : ALL TOOLS , just $35 each! New tools   will be   $30   for the   first week   or the   first 3 purchases !  Trading Tools Channel on MQL5 : Join my MQL5 channel to update the latest news from me Volumatic VIDYA (Variable Index Dynamic Average) — это продвинутый индикатор, предназначенный для отслеживания трендов и анализа давления покупок и продаж в каждой фазе тренда. Используя Variable Index Dynamic Average как основную технику динамического сглаживания, этот инструмент предос
Прежде всего стоит подчеркнуть, что эта торговая система является индикатором без перерисовки, без повторной отрисовки и без задержки, что делает ее идеальной как для ручной, так и для роботизированной торговли. Онлайн курс, руководство и загрузка пресетов. «Smart Trend Trading System MT5» - это комплексное торговое решение, созданное для новичков и опытных трейдеров. Он объединяет более 10 премиальных индикаторов и предлагает более 7 надежных торговых стратегий, что делает его универсальным вы
Quantum TrendPulse
Bogdan Ion Puscasu
5 (13)
Представляем   Quantum TrendPulse   , совершенный торговый инструмент, который объединяет мощь   SuperTrend   ,   RSI   и   Stochastic   в один комплексный индикатор, чтобы максимизировать ваш торговый потенциал. Разработанный для трейдеров, которые ищут точность и эффективность, этот индикатор помогает вам уверенно определять рыночные тренды, сдвиги импульса и оптимальные точки входа и выхода. Основные характеристики: Интеграция SuperTrend:   легко следуйте преобладающим рыночным тенденциям и п
Auto Order Block with break of structure based on ICT and Smart Money Concepts (SMC) Futures Break of Structure ( BoS )             Order block ( OB )            Higher time frame Order block / Point of Interest ( POI )    shown on current chart           Fair value Gap ( FVG ) / Imbalance   -  MTF      ( Multi Time Frame )    HH/LL/HL/LH  -  MTF      ( Multi Time Frame )  Choch  MTF      ( Multi Time Frame )  Volume Imbalance     ,  MTF          vIMB Gap’s Power of 3 Equal High / Low’s  
Другие продукты этого автора
PropHelper
Martin Slacka
4.21 (14)
STRATEGY DETAILS ______________________________________________________________________________________________________________ This is multiple strategy expert advisor. 3 trend strategies,1 big move strategy,1 reversal strategy. Multiple strategies make Expert advisor more stable and more better for Propfirms.There are lot od setting possibilities on different market conditions. Expert advisor have tendency be profitable in trend market conditions and stagnation or slightly loses in high volati
FREE
ScalpingMachine
Martin Slacka
3.25 (4)
STRATEGY DETAILS ______________________________________________________________________________________________________________ Indicators used: Bollinder Bands+Bulls power+Momentum+MACD Symbol: XAUUSD Timeframe: M1 Recomended: M1 No Dangerous Strategies Take profit: Fixed Stop loss: Fixed Posibble to set other money protections Possible to set Newsfilter Trading frequency: Moderate _______________________________________________________________________________________________________________ L
FREE
GoldUPtrend
Martin Slacka
5 (4)
Hi this is my first product STRATEGY DETAILS ______________________________________________________________________________________________________________ This is trend strategy,there is no fixed take profit that means that it can have lot of gain potential in strong trend market moves. Fixed stop loss and exit conditions minimalize loses when false signal occurs.It no opens trades often and positions are open usually more than one day Indicators used: Moving average+ADX+RSI+Bears power+Demarke
FREE
STRATEGY DETAILS ______________________________________________________________________________________________________________ This strategy is useful for propchalenges and real money deposits. The lot of indicators give more stability in performance but it is no miracle strategy, there can be periods of stagnation or drops Indicators used: Alligator+Alligator lips,teeth growth+Demarker+MACD(signal line crossover)+Moving average+ADX+Directional indicators Symbol: XAUUSD Timeframe: M5,M15,M30 Re
Goldenroad
Martin Slacka
4.67 (3)
STRATEGY DETAILS ______________________________________________________________________________________________________________ Indicators used: Wiliams percent range+Moving average+RVI+Awesome Oscilator+Accelerator Oscilator+Alligator+ADX+Demarker Symbol: XAUUSD Timeframe: M5,M15 Recomended: M5 No Dangerous Strategies Take profit: Fixed+Exit indicators(Envelopes+ Candle patterns) Stop loss: Fixed+Exit indicators( Envelopes, +Candle patterns ) Trading frequency: Moderate Posibble to set other m
FREE
OctoGold
Martin Slacka
5 (1)
STRATEGY DETAILS ______________________________________________________________________________________________________________ Multistrategies expert advisor. It has 16 strategies which bring more stability in performance. The lot of strategies are trend based because gold is growing till all history.  I hope that massive bactest and massive training data from different brokers will make this expert advisor profitable in next years. It is no miracle expert advisor in some periods there are some
Symbol: XAUUSD Recomended Timeframe: M15 No dangerous strategies  Fixed  Stop loss Multiple Strategies Recomended settings: deafult Recomended lot size: Normal risk Deposit    Lot size 1000€.       0.02 2000€.       0.04 5000€.       0.1 10000€.     0.2 Low risk Deposit    Lot size 1000€.       0.01 2000€.       0.02 5000€.       0.05 10000€.     0.1 High risk Deposit    Lot size 1000€.       0.03 2000€.       0.06 5000€.       0.15 10000€.     0.3 If you do prop challenge please dont use hight
Symbol: XAUUSD Recomended Timeframe: M5 No dangerous strategies  Fixed  Stop loss Recomended settings: deafult Recomended lot size: Normal risk Deposit    Lot size 1000€.       0.01 2000€.       0.02 5000€.       0.03 10000€.     0.04 Low risk Deposit    Lot size 1000€.       0.01 2000€.       0.01 5000€.       0.02 10000€.     0.03 High risk Deposit    Lot size 1000€.       0.01 2000€.       0.02 5000€.       0.03 10000€.     0.06 If you do prop challenge please dont use hight risk and set mone
The POC_Levels indicator calculates and displays the 3 most frequently occurring price levels (Points of Control – POC) based on historical candles. It is useful for identifying areas of high market interest (like support/resistance zones) across any timeframe. How It Works The indicator analyzes the last LookbackBars candles. It counts how many times each price level (based on the selected price type) appears. Then it selects the top 3 most frequent prices and draws horizontal lines at those l
FREE
Symbol: EURUSD Timeframe:M15 Recomended: M15 No dangerous strategies  Fixed  Stop loss Recomended settings: deafult Multiple strategies Recomended lot size: Deposit    Lot size 1000€.       0.01 2000€.       0.02 5000€.       0.05 10000€.     0.1 Backtest 2020-2024 till now  Please use good risk and money manegement Possible to set money and account protections If you need help or other recomendations please ask me More info:   https://www.mql5.com/en/users/martin6223 Check my other products: Ki
FREE
There are some main characteristicks of my product Symbols: USDJPY- recomended other JPY pairs - please try in backtest  Timeframe: M1,M5,M15 Recomended: M5 Money management: Fix TP and SL Past performance: -low drawdowns -stability Check screenshots Backtest 2020- 2024 till now Recomended Lot size settings: Deposit.         Lotsize 1000€.            0.01 2000€.            0.02 5000€.            0.05 10000€.          0.1 You can Multiply lot size by 2x (more risky) Recomended other settings: de
FREE
Symbols: USDJPY- recomended other JPY pairs - please try in backtest  Timeframe: M5 Recomended: M5 Money management: Fix TP and SL Backtest 2020- 2024 till now ,lot size:0.2 Recomended Lot size settings: Deposit.         Lotsize 1000€.            0.02 2000€.            0.04 5000€.            0.1 10000€.          0.2 You can Multiply lot size by 1,5x (more risky) Recomended other settings: deafult  Note: Please use good money management If you need help or other recomendations please ask me More
FREE
Symbol: EURUSD Timeframe: M1,M5,M15 Recomended: M5 No dangerous strategies  Fixed TP and SL No trade very often Recomended settings: deafult Recomended lot size: Deposit    Lot size 1000€.       0.02 2000€.       0.04 5000€.       0.1 10000€.     0.2 Backtest 2020-2024 till now  Please use good risk and money manegement Possible to set money and account protections If you need help or other recomendations please ask me More info:   https://www.mql5.com/en/users/martin6223 Check my other products
FREE
The higher timeframes minimalize news, and possible  big market manipulations, The multiple strategies based on different rules bring more stability in performance. This Expert advisor indeed 7 strategies,  the most strategies are trend based because there is high longterm predicton that gold price will go up in next years.For more experienced traders is highly recommended use Smart Money Concept for better and more profitable exit Entry indiactors used-William percent ranges, Moving averages (E
FREE
STRATEGY DETAILS ______________________________________________________________________________________________________________ This is combination  of 5 different strategies with different entry and exit rules. The different strategies make performance more stable and it opens trades more often. Some of strategies have fixed take profit and some no. This differences make stability, and smooth performance in different market conditions, but overall is more trend oriented Symbol: USDJPY,AUDJPY,NZ
Symbols: USDJPY- recomended Recomended: M15 Others Timeframes and JPY pairs - you can try backtest Combination of my best USDJPY M15 Strategies Money management: Fix TP and SL Backtest 2021- 2024 till now ,lot size:0.2 Recomended Lot size settings: Deposit.         Lotsize 1000€.            0.02 2000€.            0.04 5000€.            0.1 10000€.          0.2 You can Multiply lot size by 1,5x (more risky) or divide 2 (Low risk) Recomended other settings: deafult  Note: Please use good money man
STRATEGY DETAILS ______________________________________________________________________________________________________________ The strategy is based on multiple well balanced indicators which are optimalized on different market conditions, but this strategy is no miracle there are still periods of stagnation or slightly drops. Trades are open only few times per month usually(5-12 times) and trades are open more days. The strategy is more trend oriented. Indicators used: RSI+Comodity chanel inde
STRATEGY DETAILS ______________________________________________________________________________________________________________ indicators:RSI+RSI levels+Bull Power level+Comodity channel index+MACD+Moving average+Entry time filter Symbol: EURUSD + possibble to set and optimize for other currency pairs Timeframe: H1  + possibble to set and optimize for other currency pairs No Dangerous Strategies  Take profit: Fixed+Exit indicators(Envelopes + Candle formation + Momentum + William Percent Range)
STRATEGY DETAILS ______________________________________________________________________________________________________________ Entry indicators:MACD+Aligator+RSI+Bull power+Moving averages+Daily points Symbol: GBPUSD + possibble to set and optimize for other currency pairs Timeframe: H1  + possibble to set and optimize for other currency pairs No Dangerous Strategies  Take profit: Fixed+Exit indicators(Envelopes + Bollinder bands) Stop loss: Fixed+Exit indicators( Envelopes + Bollinder bands )
Фильтр:
Нет отзывов
Ответ на отзыв