Power Assisted Trend Following
- Индикаторы
- Andreas Alois Aigner
- Версия: 1.0
# Power Assisted Trend Following Indicator
## Overview
The PowerIndicator is an implementation of the "Power Assisted Trend Following" methodology developed by Dr. Andreas A. Aigner and Walter Schrabmair. This indicator builds upon and improves J. Welles Wilder's trend following concepts by applying principles from signal analysis to financial markets.
The core insight of this indicator is that successful trend following requires price movements to exceed a certain threshold (typically a multiple of the Average True Range). By measuring the "power" of both signal and noise components in price movements, this indicator helps traders identify when a market is in a strong enough trend to trade profitably.
## Theoretical Background
### The Problem with Traditional Trend Following
J. Welles Wilder's "Volatility System" (published in his 1978 book "New Concepts in Technical Trading Systems") uses a trailing stop-loss based on the Average True Range (ATR). The system follows new highs/lows with a trailing stop and reverses direction when the stop is triggered.
However, as demonstrated in the research, this system only works profitably when the trend's amplitude exceeds a certain multiple of the stop-loss range:
- When price fluctuations are equal to or smaller than the stop-loss (1× ATR), the system constantly gets stopped out and loses money
- At 2× ATR, the system still loses money but less than at 1× ATR
- At 3× ATR, the system breaks even
- At 4× ATR or higher, the system becomes profitable
This creates the need for a method to measure when a market is trending strongly enough to trade.
### The Power Concept
The PowerIndicator applies concepts from signal analysis, specifically the notion of "power" in signals. In physics, power for periodic signals is defined as the average energy over a period. The researchers adapted this concept to financial markets by:
1. Calculating the "power" of price movements
2. Separating this power into "signal" (trend) and "noise" (deviation from trend) components
3. Comparing these power measurements to a threshold based on the ATR
This approach provides a more accurate way to identify tradable trends than Wilder's Directional Movement indicators (DX, ADX, ADXR).
## Mathematical Foundation
The indicator calculates several key metrics:
### 1. Power of a Price Series
For a window of N periods, the power at time j is calculated as:
```
Power(j,N) = (1/N) * Σ(|P(j-n)/P(j-N+1)|²)
```
Where:
- P(j-n) is the price n periods ago
- P(j-N+1) is the price at the start of the N-period window
- The sum runs from n=0 to N-1
### 2. Power of Signal and Noise
The price series is decomposed into:
- Signal: The N-period moving average (MA)
- Noise: The deviation of price from the moving average
The power of each component is calculated as:
**Power of Signal:**
```
PowerOfSignal(j,N) = (1/N) * Σ(|MA(j-n,N)/P(j-N+1)|²)
```
**Power of Noise:**
```
PowerOfNoise(j,N) = (1/N) * Σ(|(P(j-n) - MA(j-n,N))/P(j-N+1)|²)
```
### 3. Power Threshold
The power threshold is based on the ATR normalized by the Standard Instrument Constant (SIC):
```
PowerThreshold(j) = |ATR(j)/SIC(j)|²
```
Where SIC is defined as 1% of the current price.
### 4. Power Ratios
The final metrics used for trading decisions are:
**Signal Power Ratio:**
```
R(Signal) = √((PowerOfSignal(j,N) - 1)/PowerThreshold(j))
```
**Noise Power Ratio:**
```
R(Noise) = √(PowerOfNoise(j,N)/PowerThreshold(j))
```
These ratios represent how many multiples of the ATR the signal and noise components are, respectively.
## Components of the PowerIndicator
The PowerIndicator.mq5 implementation calculates and displays five sets of metrics, each for five different time periods (10, 20, 50, 100, and 200):
### 1. Price Moving Averages (PMA)
Simple moving averages of price for different periods. These serve as the basis for the signal component.
### 2. Sum Energy (SE)
Measures the normalized squared deviations of price from its moving average. This represents the raw energy of price movements relative to the starting price of each window.
### 3. Sum Energy Moving Average (SEMA)
Measures the squared ratio of moving average to price from period days ago. This represents the energy of the trend component.
### 4. Power Ratio Noise
The square root of the ratio between Sum Energy and the power threshold. This shows how many multiples of the ATR the noise component is.
### 5. Power Ratio Signal
The square root of the ratio between the absolute difference of Sum Energy MA from 1 and the power threshold. This shows how many multiples of the ATR the signal component is.
## Interpretation and Trading Applications
### When to Use the Indicator
The research shows that the Power Ratio of Noise has a stronger relationship to profitability than the Signal Power Ratio, with the 50-day calculation showing the strongest correlation (R² = 0.37).
Based on the research findings:
1. **Trend Strength Assessment**: Higher Power Ratio values (especially above 4) indicate stronger trends that are more likely to be profitable for trend following strategies.
2. **Market Selection**: Use the Power Ratios to rank different markets or securities, focusing on those with the highest values.
3. **Entry Timing**: Consider entering trend following trades when:
- The Power Ratio Noise exceeds 4
- The trend direction is clear (price above/below moving average)
4. **Exit Considerations**: Monitor for decreasing Power Ratios as potential early warning of trend weakness.
### Optimal Settings
The research found:
- A multiplier of 4× ATR for stop-loss placement provides the best results
- The 50-day calculation period shows the strongest correlation with profitability
- Both 30-day and 100-day periods also show significant correlations
## Configuration Options
The PowerIndicator.mq5 implementation provides several configuration options:
```
input int ATR_Period = 14; // ATR Period
input bool Show_PMA = false; // Show Price Moving Averages
input bool Show_SumEnergy = false; // Show Sum Energy
input bool Show_SumEnergyMA = false; // Show Sum Energy MA
input bool Show_PowerRatioNoise = true; // Show Power Ratio Noise
input bool Show_PowerRatioSignal = true; // Show Power Ratio Signal
```
By default, only the Power Ratio Noise and Power Ratio Signal components are displayed, as these are the most directly useful for trading decisions.
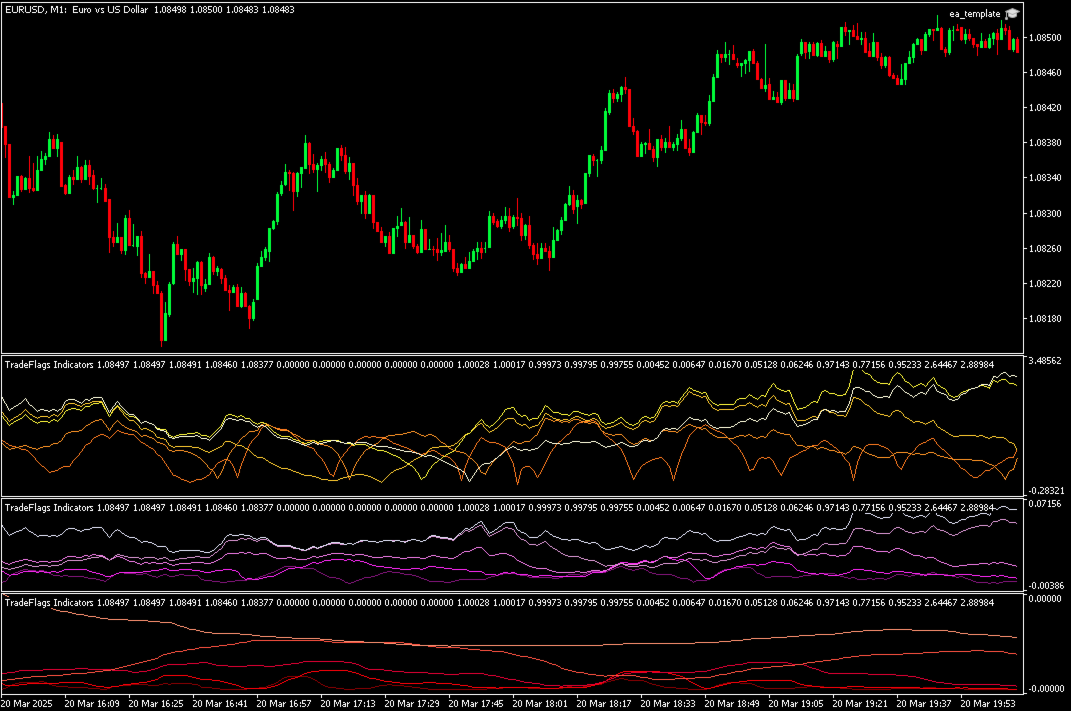
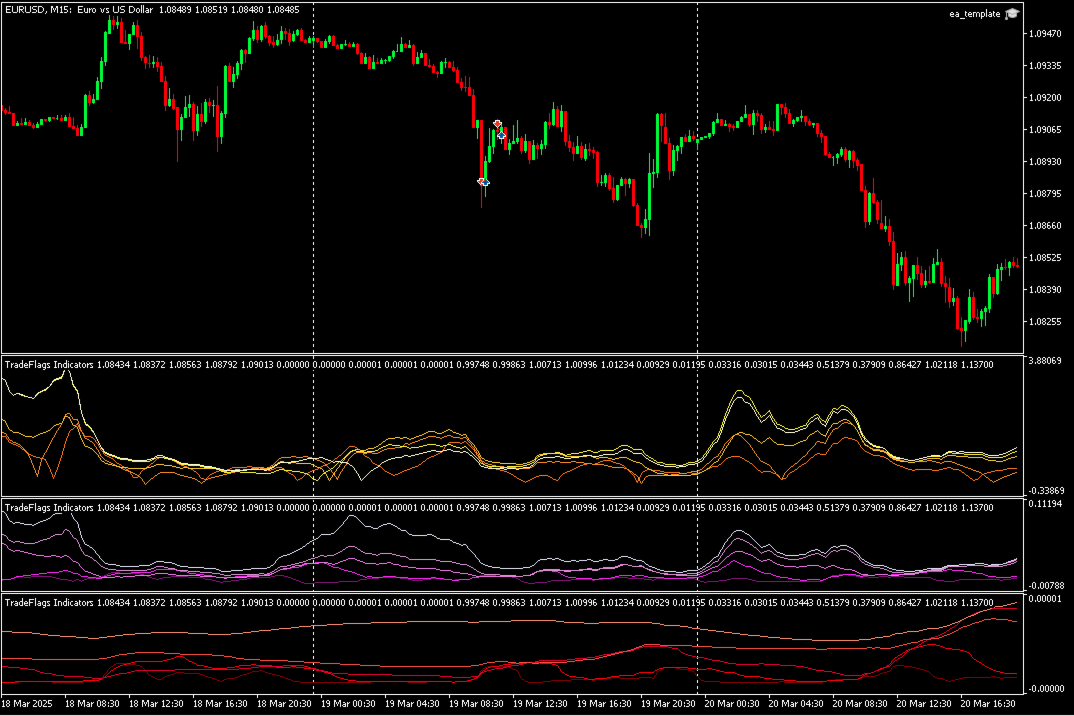
## Visual Representation
The indicator uses color coding to distinguish between different time periods:
- **Blue** color scheme for Price Moving Averages (PMA)
- **Red** color scheme for Sum Energy
- **Green** color scheme for Sum Energy MA
- **Purple/Magenta** color scheme for Power Ratio Noise
- **Orange/Yellow** color scheme for Power Ratio Signal
For each metric, darker colors represent shorter time periods (10, 20) while lighter colors represent longer time periods (100, 200).
## Advantages Over Traditional Indicators
The research demonstrates that the Power Ratio metrics outperform Wilder's traditional trend indicators:
- Power Ratio Noise (50-day): R² = 0.37
- ADX: R² = 0.06
- ADXR: R² = 0.07
- DX: R² = 0.05
This indicates that the Power Assisted Trend Following approach provides a more accurate assessment of trend strength and profitability potential.
## Conclusion
The PowerIndicator implements an advanced approach to trend following that addresses a fundamental limitation of traditional methods: determining when a trend is strong enough to trade profitably.
By applying concepts from signal analysis, the indicator provides a more robust framework for:
1. Assessing trend strength
2. Selecting markets with the strongest trends
3. Timing entries into trend following strategies
4. Setting appropriate stop-loss levels
The empirical testing shows that this approach outperforms traditional trend indicators, making it a valuable tool for traders who rely on trend following strategies.