Lowess
- Индикаторы
- Slavisa Bajcer
- Версия: 1.0
- Активации: 10
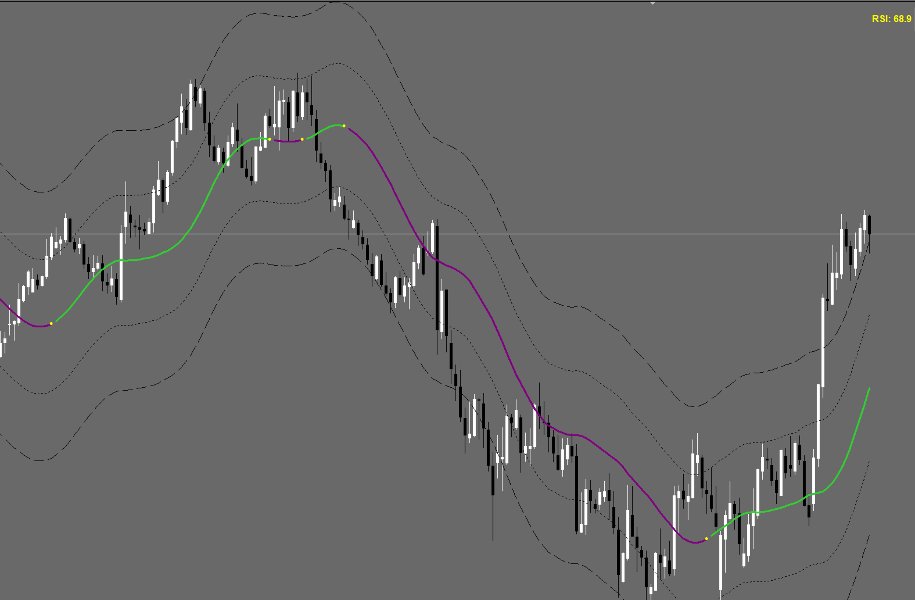
The LOWESS is a sophisticated trend-following indicator designed to help traders identify, analyze, and act on market trends with precision and minimal lag. Built around the LOWESS (Locally Weighted Scatterplot Smoothing) algorithm, it filters out market noise to reveal the underlying price direction. Enhanced with dynamic visuals, volatility-based bands, momentum insights, and features like alerts and trend strength analysis, this indicator offers a comprehensive toolkit for navigating today’s markets.
Key Features
- LOWESS Price Filtering
- Smooths price data to create a responsive midline that tracks the market’s true trend with reduced lag compared to traditional moving averages.
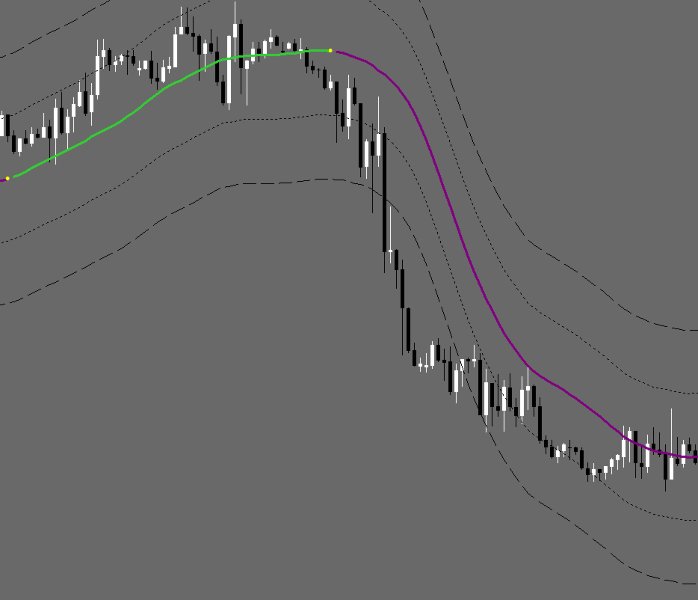
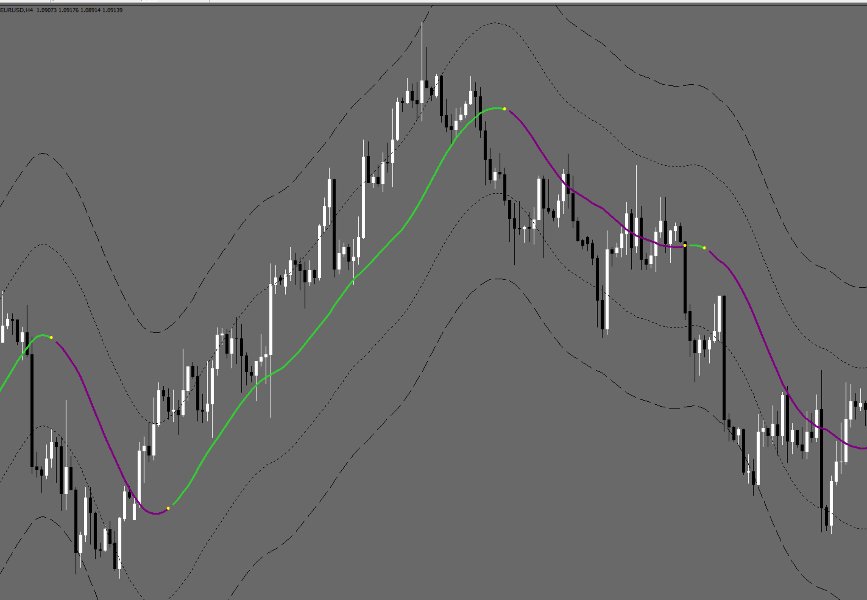
- Dynamic Trend Coloring
- The midline changes color to reflect trend direction:
- Green: Bullish (uptrend).
- Purple: Bearish (downtrend).
- Provides an instant visual cue of market bias.
- Trend Shift
- Symbols appear on the chart when the trend direction shifts, marking potential reversal points or new trend beginnings.
- Deviation-Based Bands
- Upper and lower bands, calculated using ATR (Average True Range) multipliers, surround the midline. These bands:
- Adjust to market volatility.
- Highlight overbought/oversold levels.
- Act as dynamic support and resistance.
- RSI Gauge Display (Optional)
- A right-side gauge shows the Relative Strength Index (RSI) relative to the price channel, offering:
- Confirmation of trend momentum.
- Insight into overbought/oversold conditions.
- Trend Strength Indicator
- A visual or numerical measure of trend conviction, helping traders gauge whether a trend is robust or fading.


