Oil SMT Divergence ICT Indicator MT5
- Индикаторы
- Eda Kaya
- Версия: 2.1
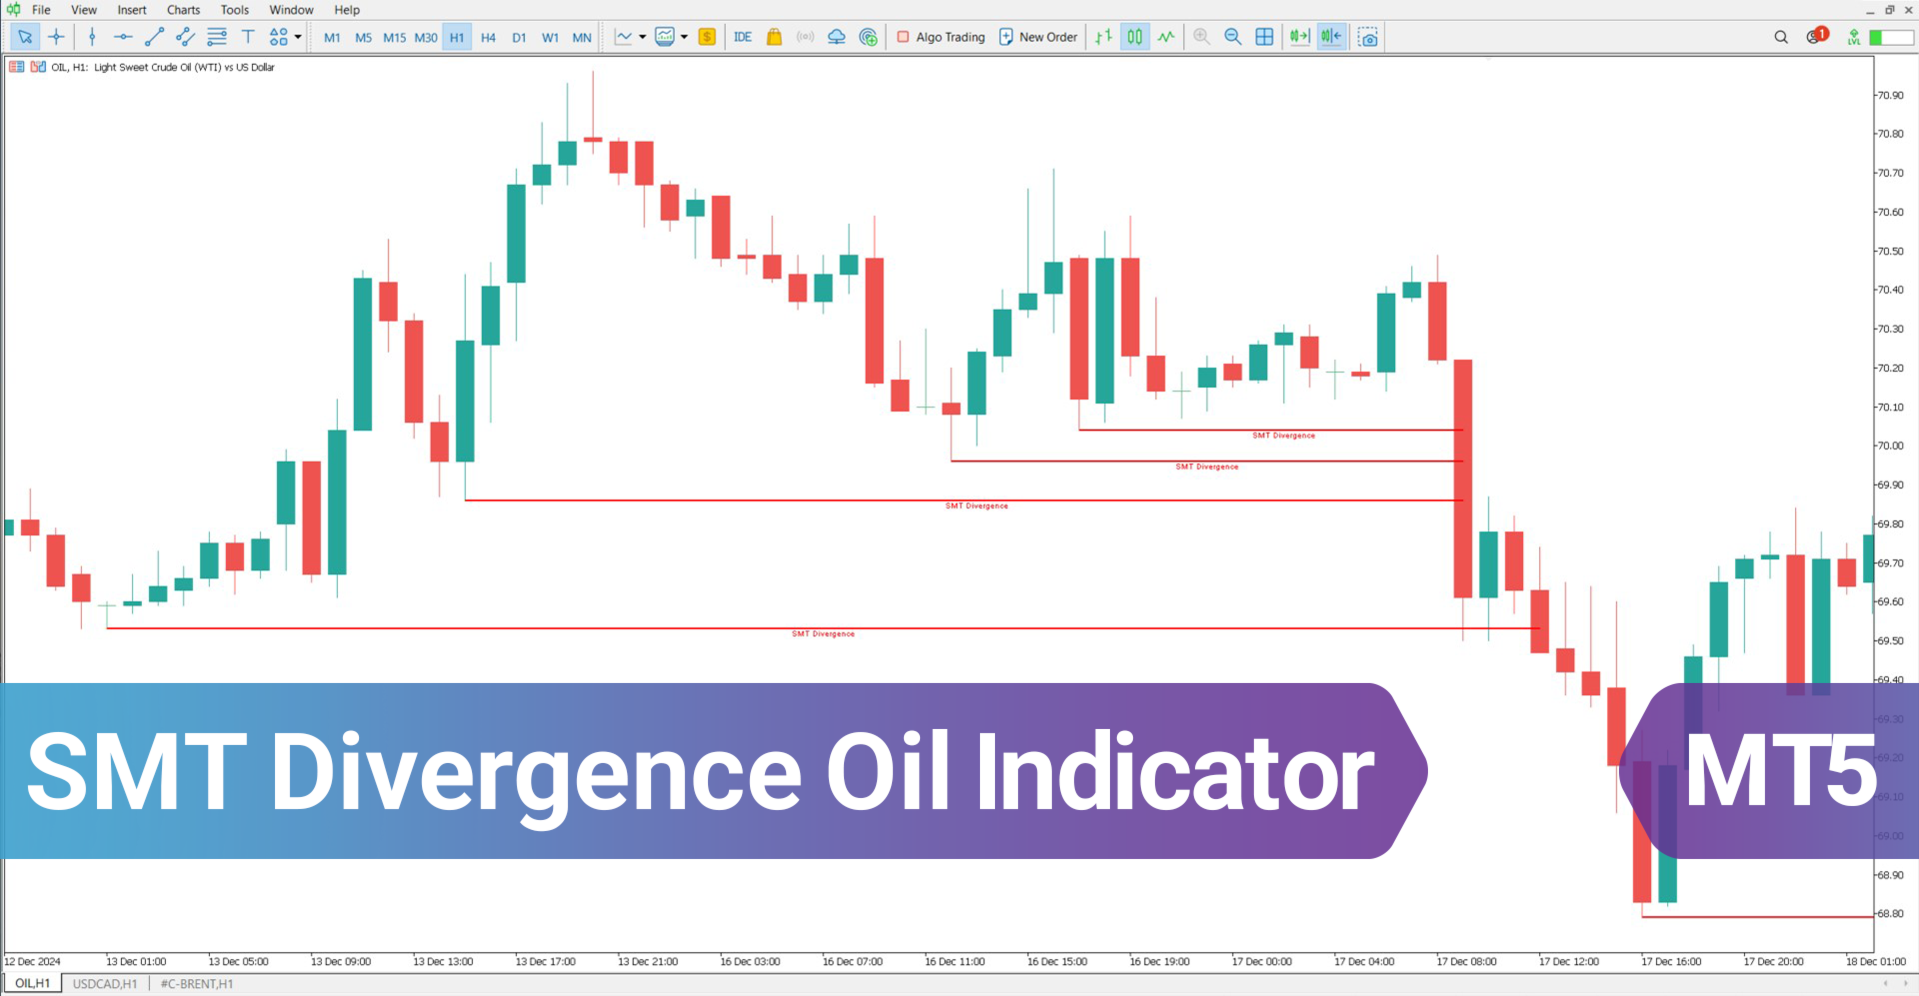
SMT Divergence Oil Indicator ICT MT5
The SMT Divergence Oil Indicator for MetaTrader 5 is designed to analyze price divergences between energy-related assets, helping traders identify potential trend reversals or continuations. By tracking deviations between correlated markets, this indicator offers valuable insights into price movements.
When a divergence is detected in the primary (mother) asset chart, the indicator automatically highlights corresponding divergences in related markets:
- Bullish divergence is represented in red, signaling a potential continuation of upward momentum.
- Bearish divergence appears in green, indicating market weakness and a possible downturn.
SMT Divergence Oil Indicator Specifications
The key attributes of the SMT Divergence Oil Indicator are summarized in the table below:
| Category | ICT - Smart Money - Trading Tool |
| Platform | MetaTrader 5 |
| Skill Level | Advanced |
| Indicator Type | Continuation – Range – Leading |
| Timeframe | Multi-timeframe |
| Trading Style | Day Trading |
| Market | Cryptocurrency - Forex - Stocks |
Overview of the Indicator
Built on ICT trading strategies, the SMT Divergence Oil Indicator tracks divergences across major energy assets such as Crude Oil (XTI/USD), Brent Crude (XBR/USD), and the US Dollar/Canadian Dollar (USD/CAD) currency pair.
The tool visually marks divergences on the price chart, allowing traders to detect subtle trends, anticipate reversals, and recognize shifts in market behavior. By analyzing the interplay between oil markets and currency pairs, this indicator provides a more comprehensive outlook on asset price movements, making it an essential tool for monitoring both commodities and forex pairs simultaneously.
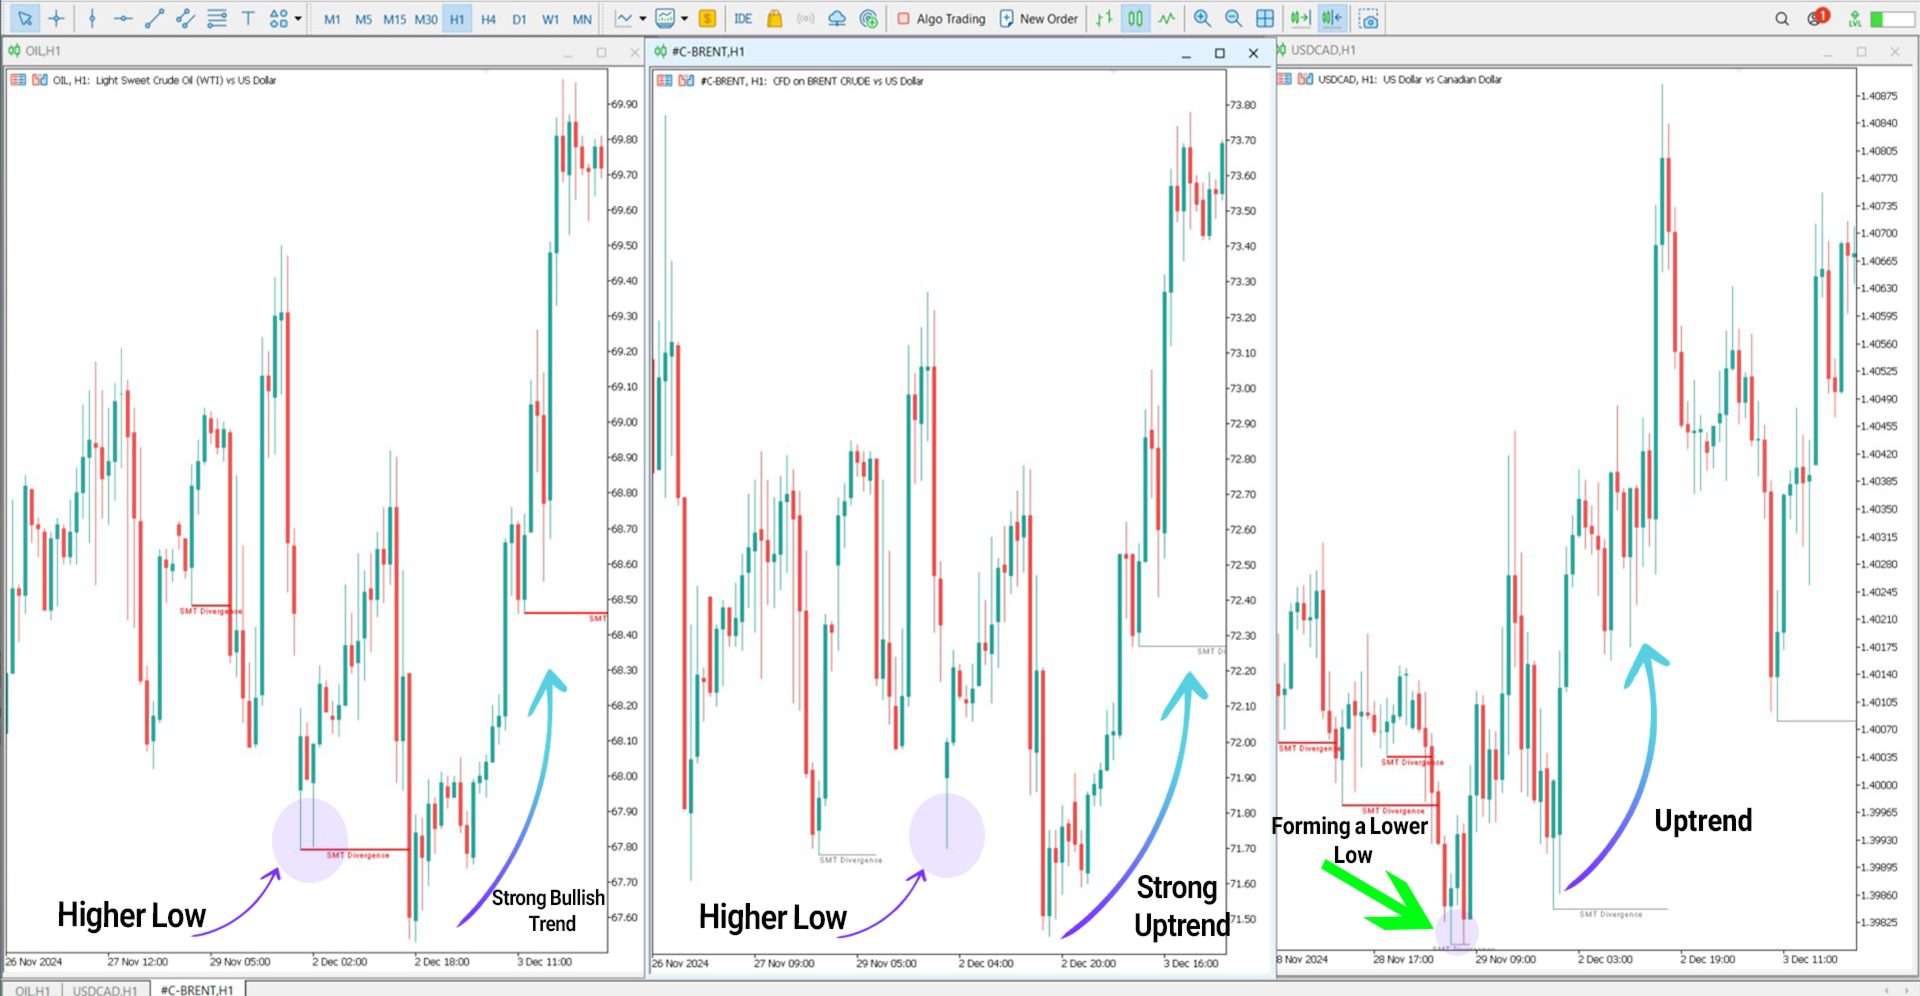
Bullish Divergence Example
The chart below illustrates how divergence develops during an uptrend. Here, both Crude Oil (XTI/USD) and Brent Crude (XBR/USD) exhibit Higher Lows, indicating a steady price increase. However, the USD/CAD pair forms a Lower Low, showing a lag in correlation with the energy markets.
This divergence suggests a possible trend continuation in oil markets, while the delayed movement in USD/CAD provides traders with an early indication of a shift in price behavior.
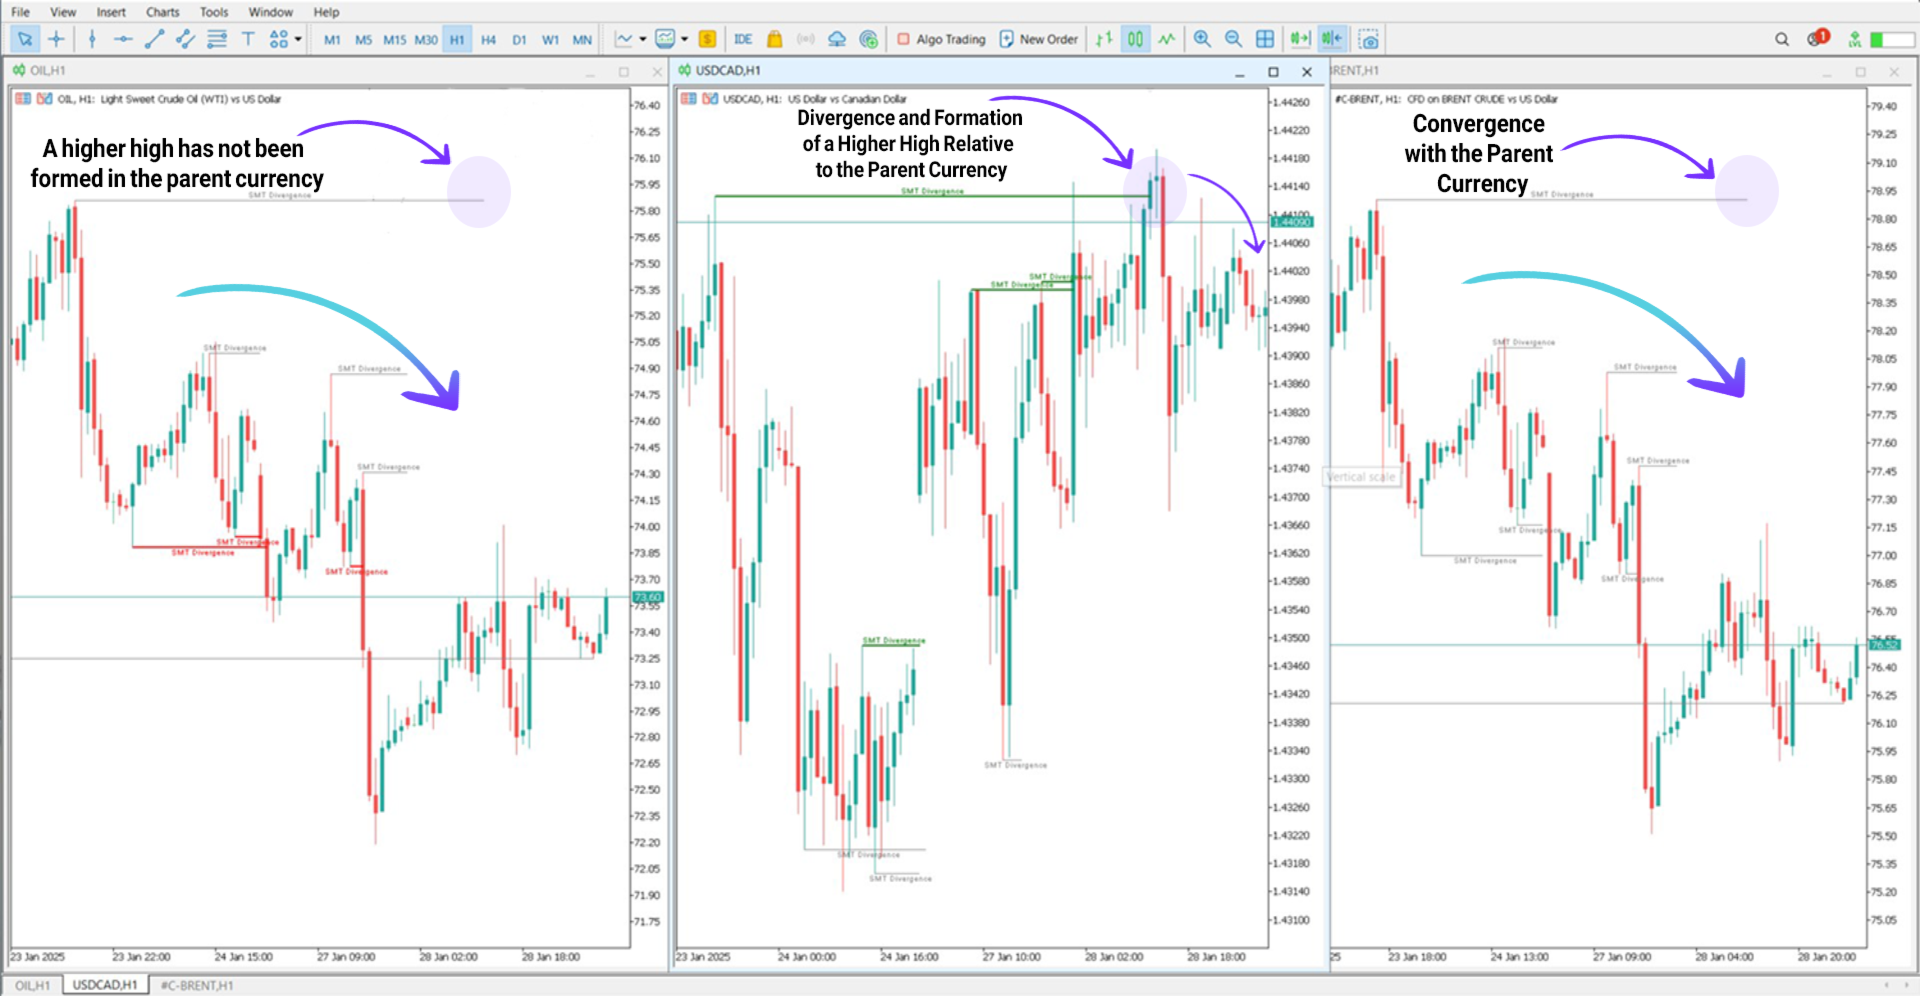
Bearish Divergence Example
In a downtrend scenario, as illustrated in the following chart, Crude Oil and Brent Crude start declining, suggesting a weakening market. Meanwhile, the USD/CAD pair moves higher, forming a Higher High, creating a noticeable divergence between correlated assets.
This price imbalance signals potential market weakness and hints at an upcoming reversal, offering traders a valuable opportunity to anticipate and react to the shift in trend.
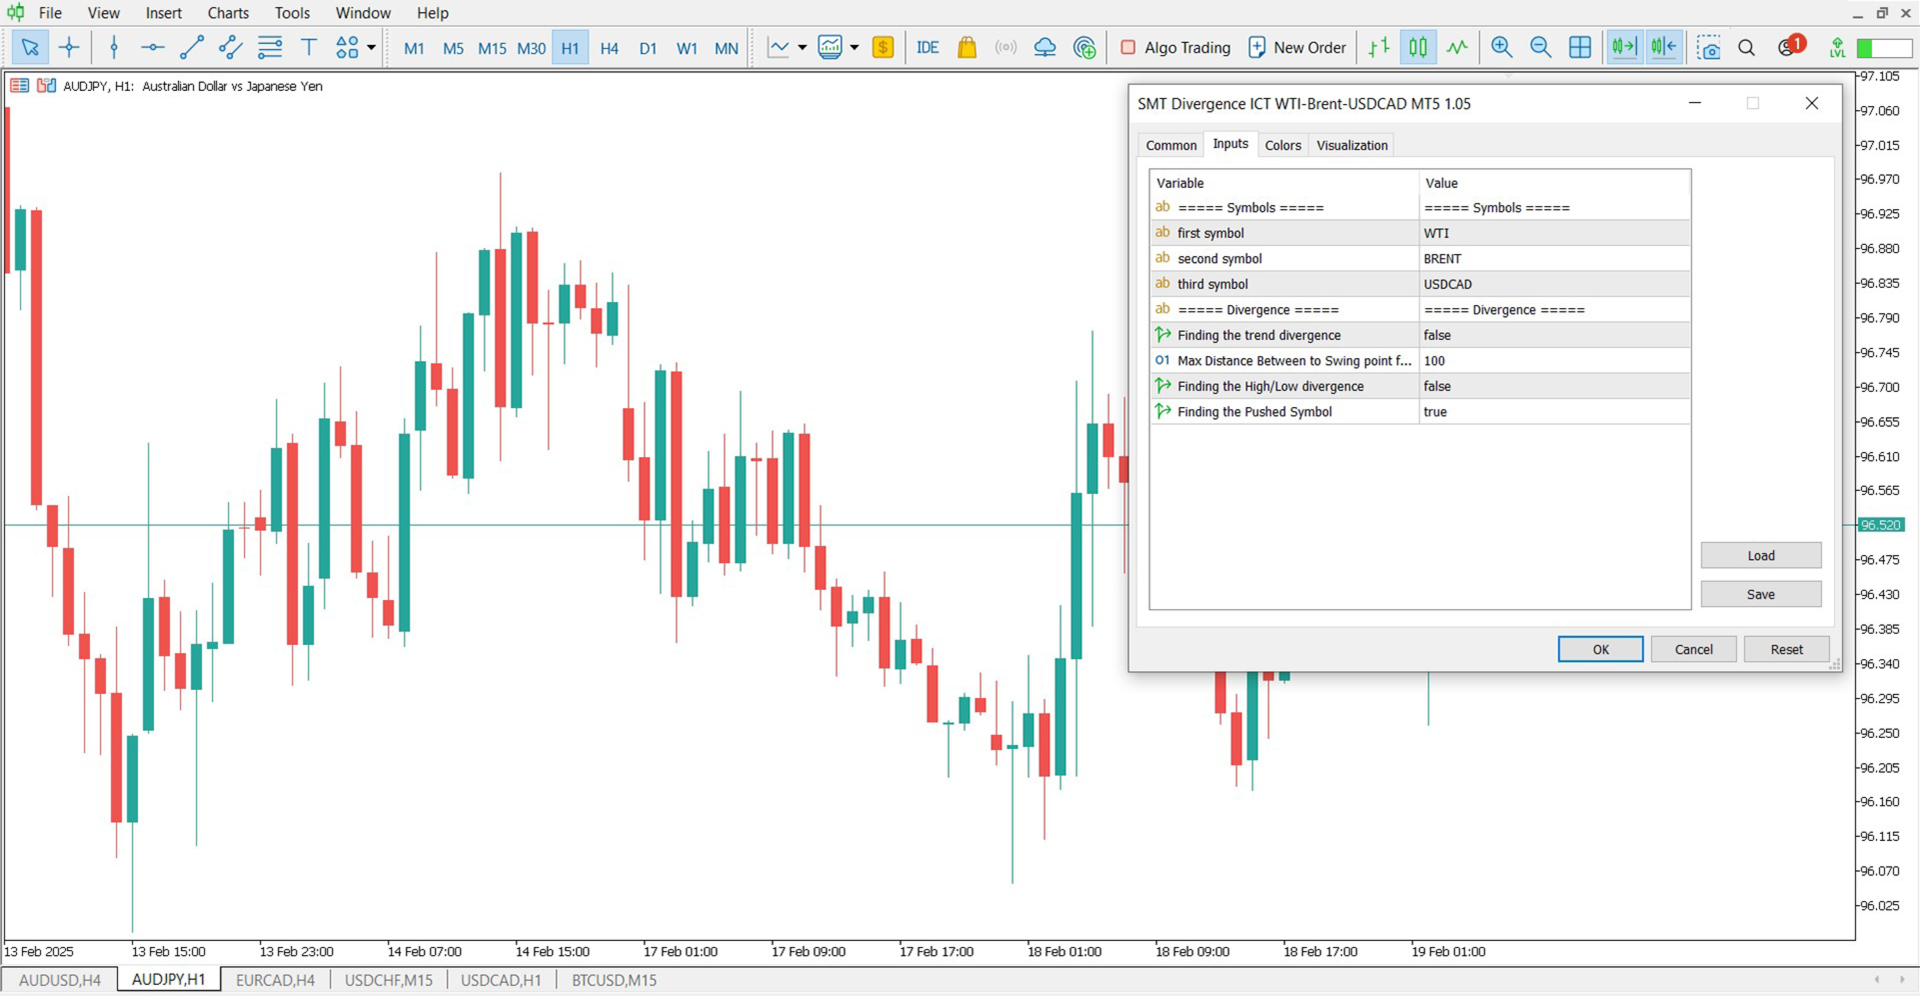
SMT Divergence Oil Indicator Settings
The indicator comes with a fully adjustable settings panel, enabling traders to refine their divergence analysis for precision.
- Primary Symbol – Set the first asset for comparison.
- Secondary Symbol – Define the second correlated asset.
- Tertiary Symbol – Select the third asset for divergence tracking.
- Detect Trend Divergence – Identify key divergence points automatically.
- Max Distance Between Swing Points – Adjust the sensitivity for divergence detection.
- Identify High/Low Divergences – Spot significant price deviations.
- Analyze Pushed Symbols – Highlight overlapping SMT lines for deeper market insights.
Final Thoughts
The SMT Divergence Oil Indicator for MetaTrader 5 is a powerful trading tool that identifies divergences between energy assets like Crude Oil, Brent Oil, and the USD/CAD currency pair. By monitoring the relationships between these markets, traders can uncover potential reversals, anticipate market shifts, and assess price movement strength with greater accuracy.
Integrating Smart Money Concepts (SMC), this indicator provides traders with a competitive edge, offering a deeper level of analysis for more strategic decision-making in volatile market conditions.