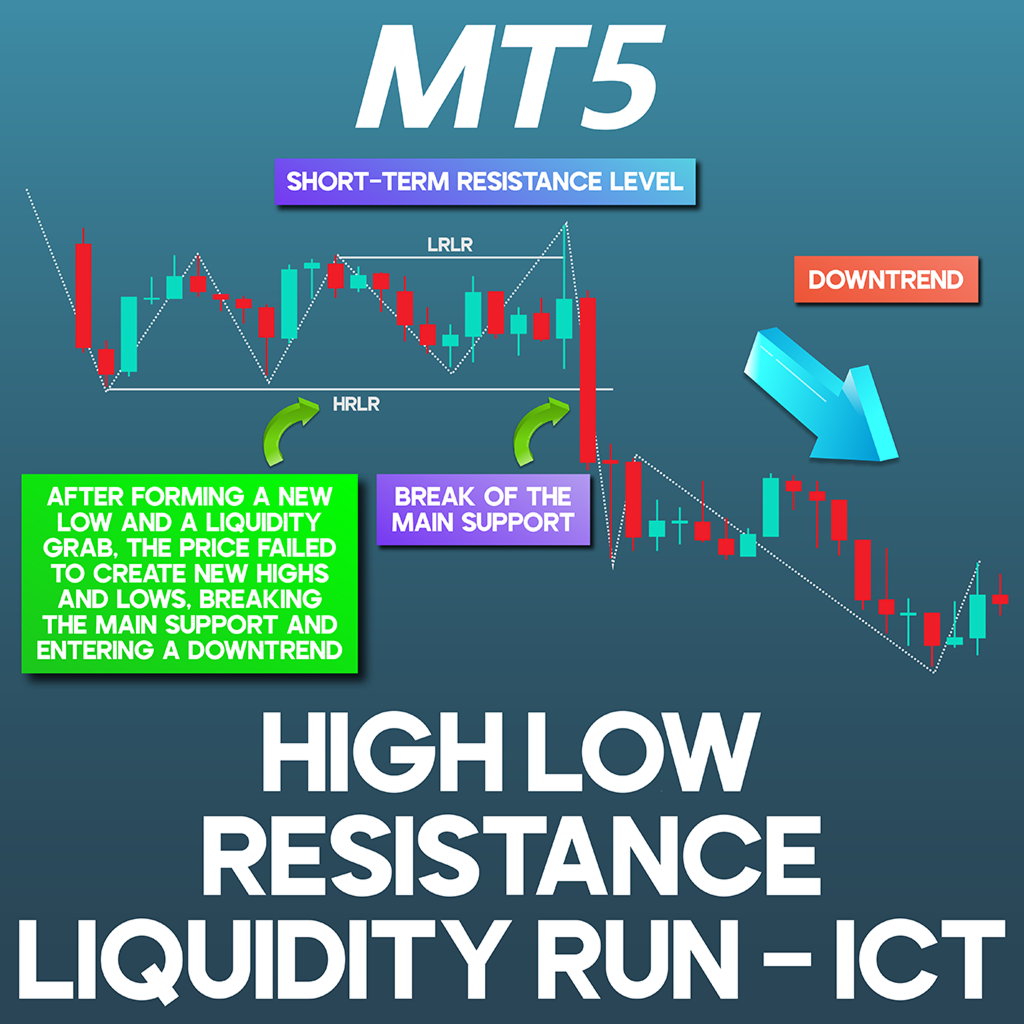
High Low Resistance Liquidity Run ICT MT5
- Индикаторы
- Eda Kaya
- Версия: 1.11
High-Low Liquidity Sweep ICT MT5
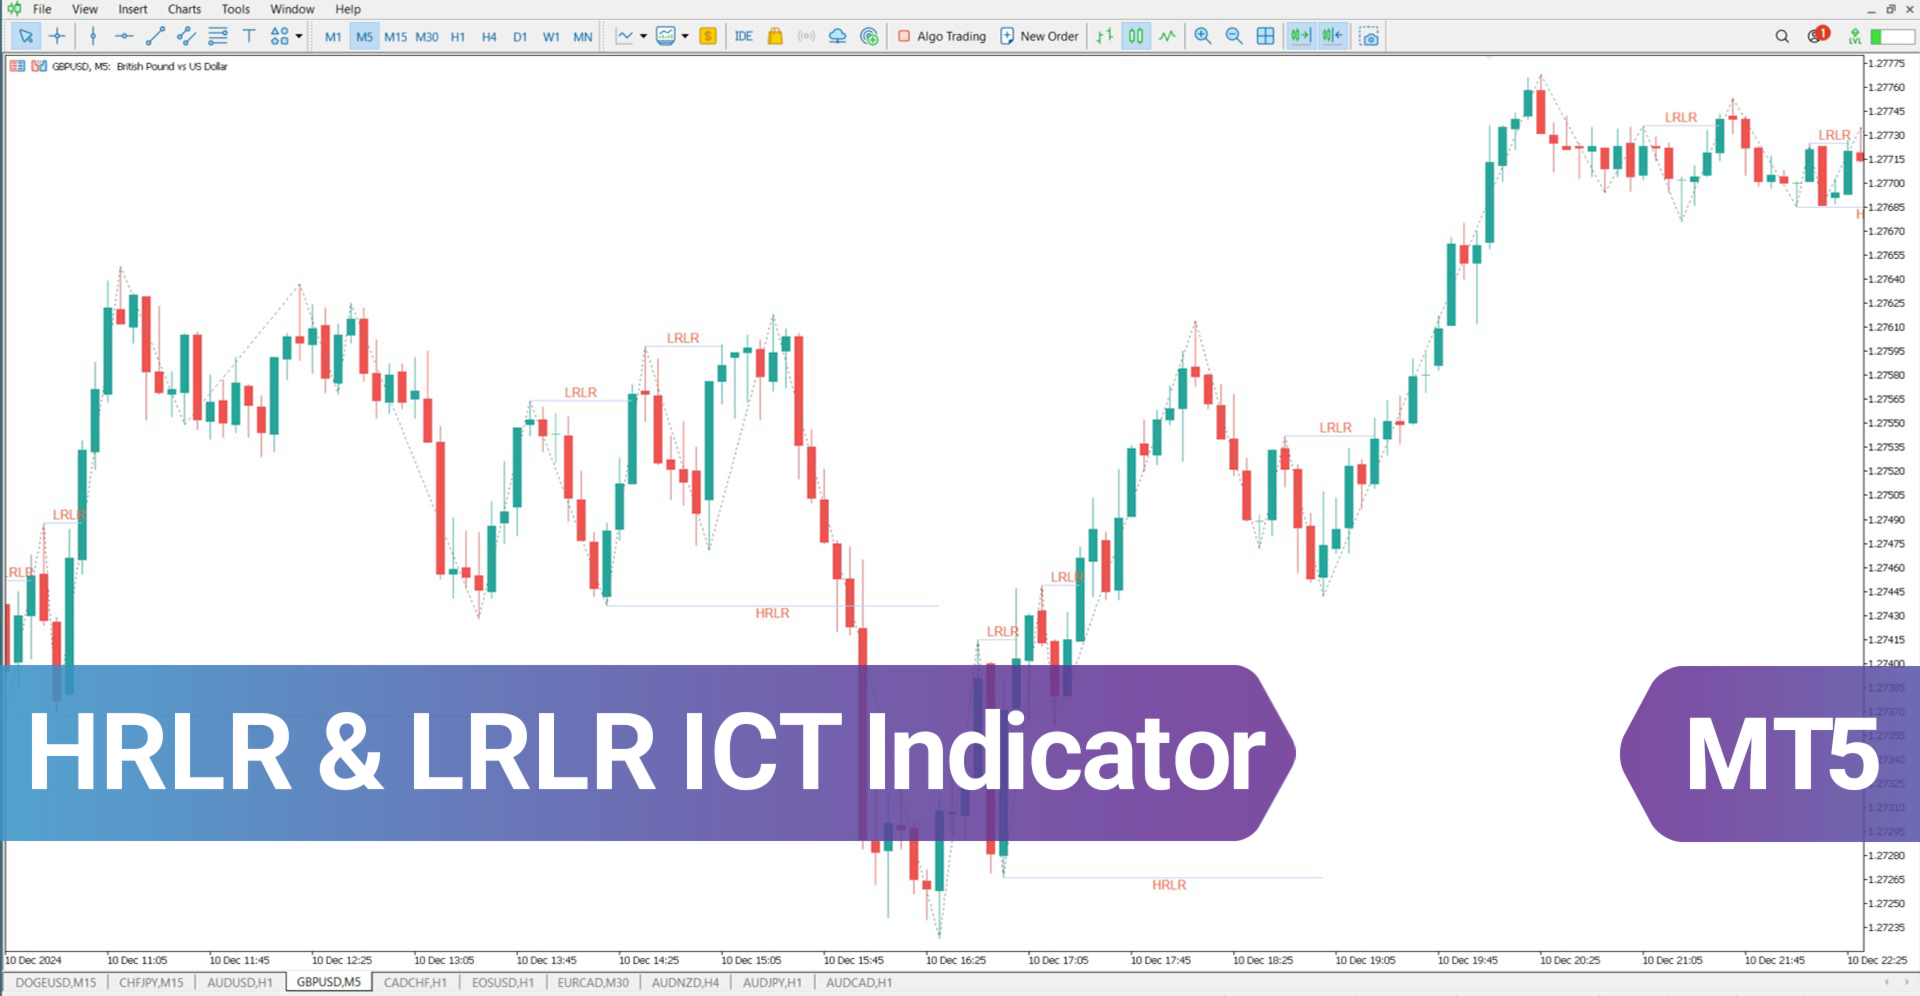
The HLRS (High Liquidity Resistance Sweep) and LLRS (Low Liquidity Resistance Sweep) indicators are advanced tools designed to analyze price movement within liquidity zones based on the ICT framework.
An HLRS pattern emerges when the price accumulates liquidity at its lowest point before initiating an upward movement. This shift is characterized by the consistent formation of higher lows and higher highs, establishing a structured bullish trend.
On the other hand, the LLRS pattern represents price movements into lower-resistance liquidity areas, where the price advances systematically by forming higher lows before reaching new highs.
Key Features of the HLRS & LLRS Indicator
Below are the primary characteristics of the HLRS & LLRS indicator:
| Category | ICT - Market Structure - Key Levels |
| Platform | MetaTrader 5 |
| Skill Level | Advanced |
| Indicator Type | Breakout - Reversal - Trend |
| Timeframe | Multi-timeframe |
| Trading Style | Day Trading |
| Markets | Forex - Crypto - Stocks |
Overview of the Indicator
The indicator tracks HLRS movements by detecting higher lows and higher highs in a bullish trend. A shift in structure occurs when a key low is breached, signaling traders to reassess the market’s direction and potential trend reversal.
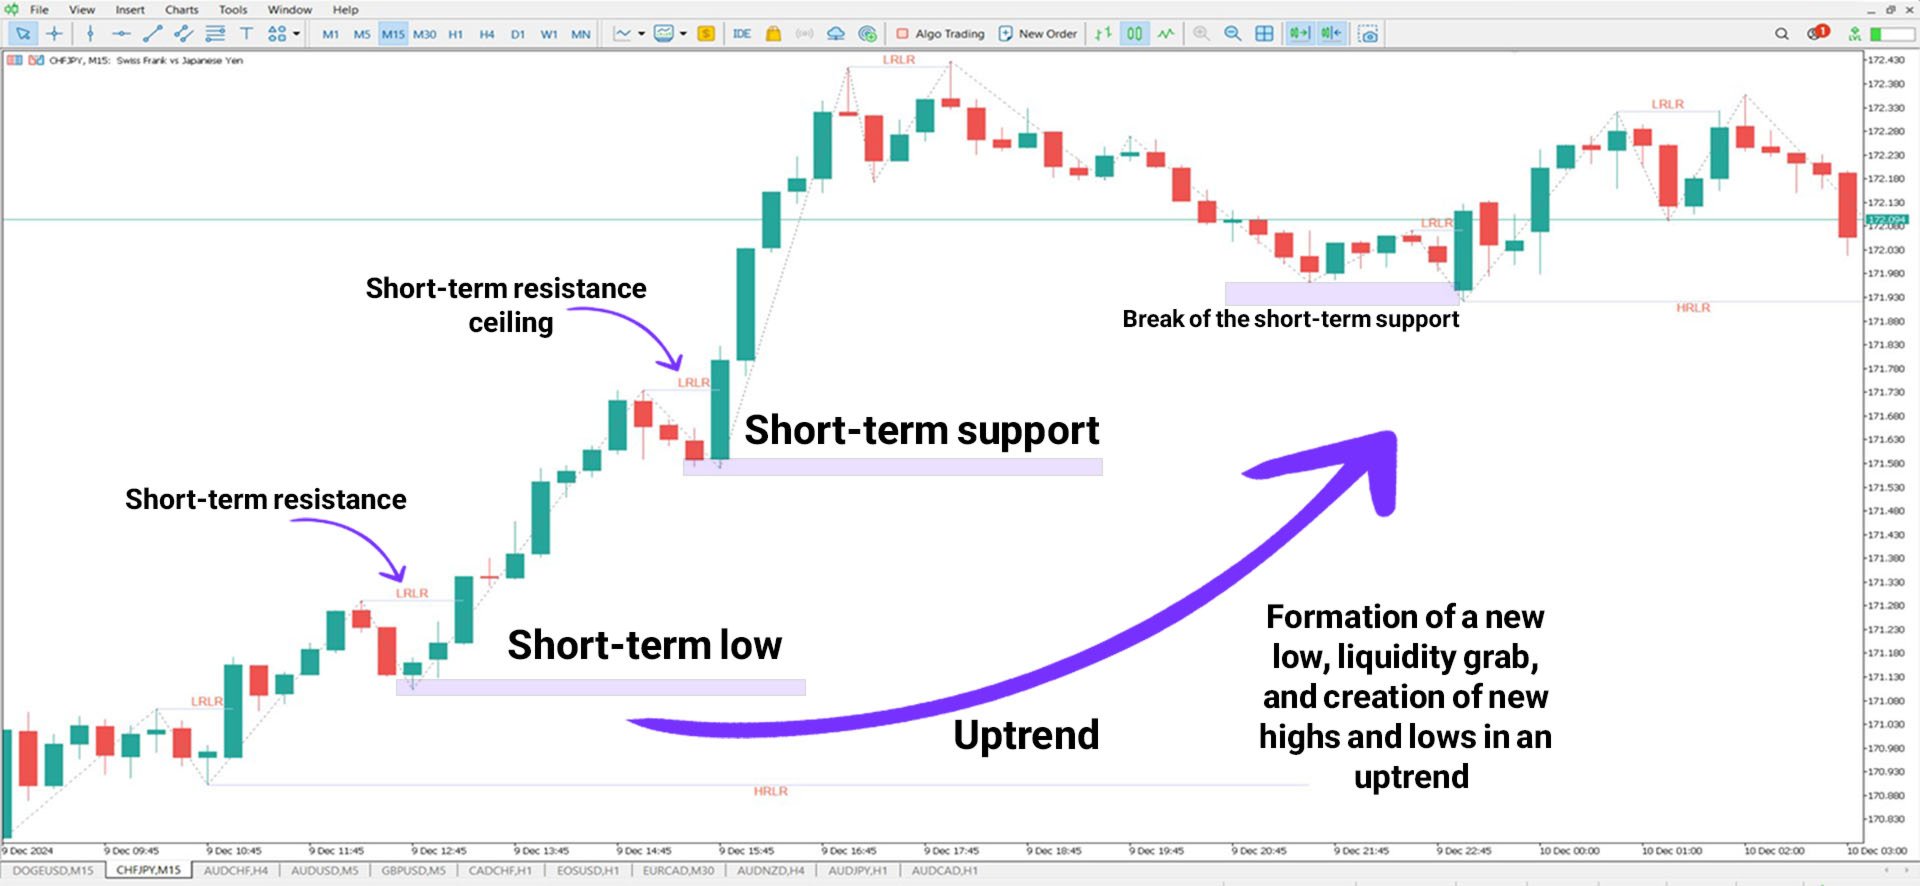
Applying the Indicator in an Uptrend
In the CHF/JPY price chart, the HLRS indicator highlights an upward movement as the price consistently forms higher lows and higher highs. Traders can utilize this pattern to identify strong buy opportunities, particularly when validated by additional bullish signals like pin bars or engulfing candlesticks.
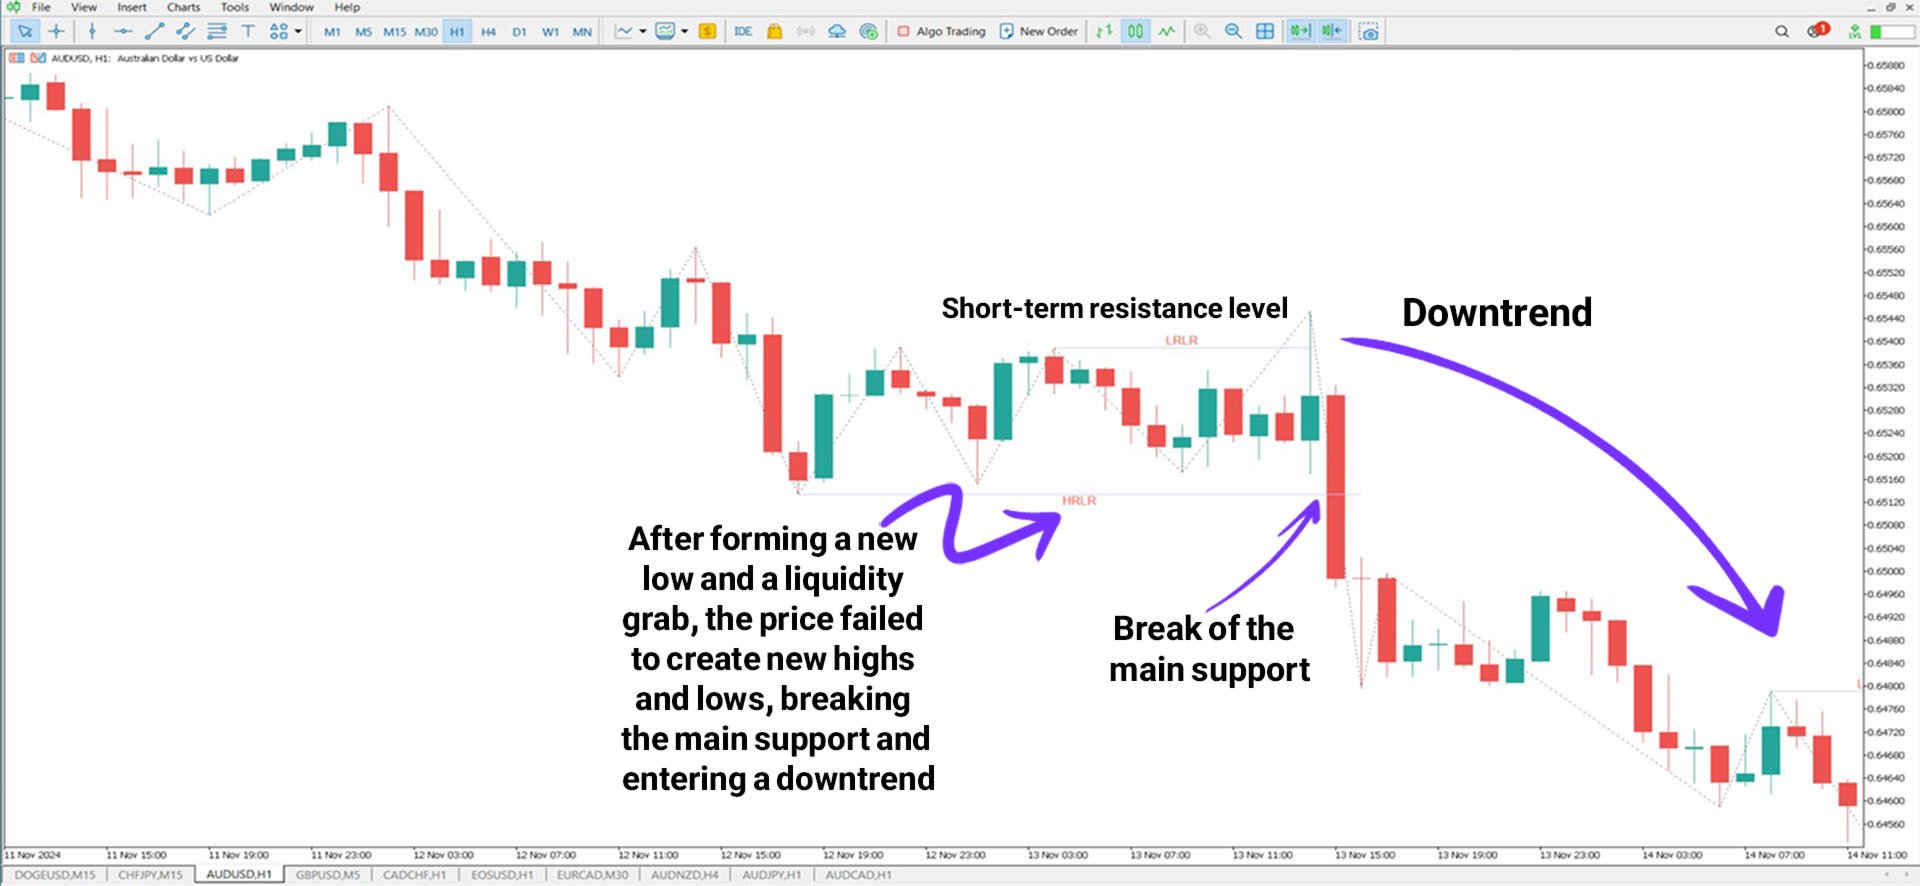
Applying the Indicator in a Downtrend
After absorbing liquidity, the price may temporarily retrace before breaking key support levels. If it fails to establish higher highs and higher lows, it indicates a potential shift into a bearish trend. Traders can take advantage of such situations by entering sell trades once significant support levels are broken.
Customizable Settings
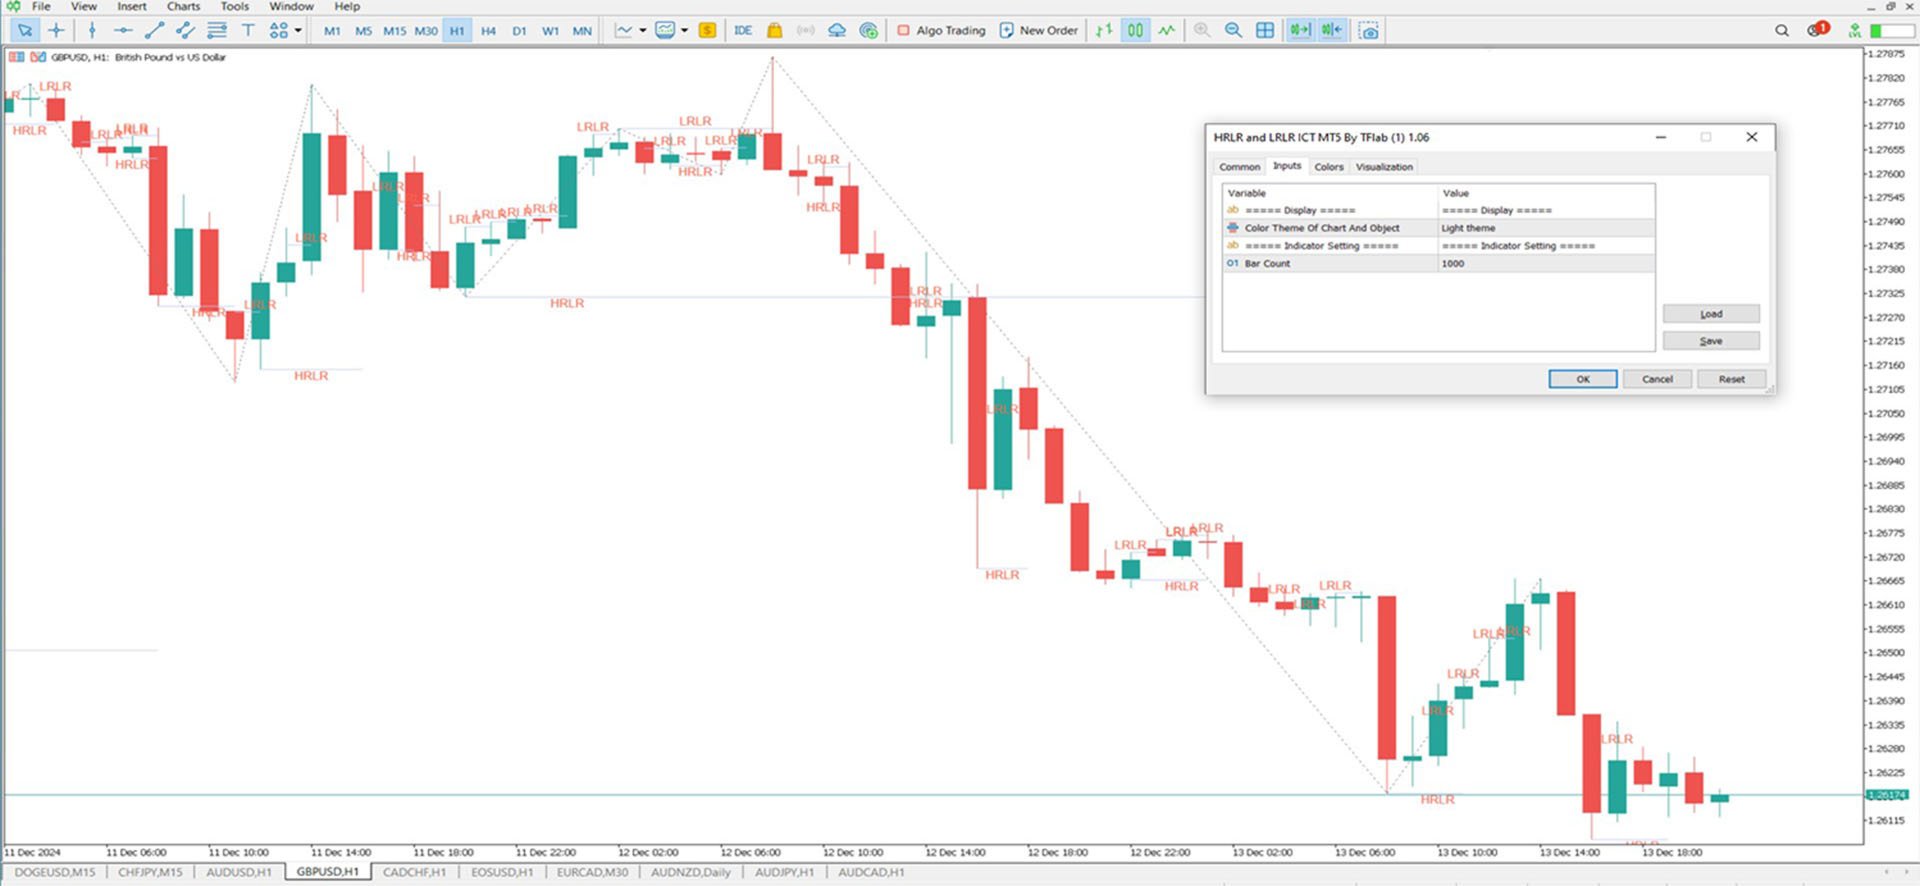
The HLRS & LLRS indicator provides flexible customization options for traders, as seen in the image below:
Display Settings
- Chart and Object Color Theme: Adjusts the visual theme for better clarity.
Indicator Settings
- Bar Count: Defines the number of candlesticks used for identifying reversal points.
Final Thoughts
The HLRS & LLRS indicators are highly effective for identifying liquidity zones and strategic trade entry points. HLRS zones often require more market activity to reach, whereas LLRS areas present easier trading opportunities. Economic events such as NFP or FOMC announcements may influence the strength and effectiveness of HLRS formations.