Cm Williams Vix
- Индикаторы
- Mohamed Elyes Hantous
- Версия: 1.0
CM_Williams_Vix_Fix Indicator Description
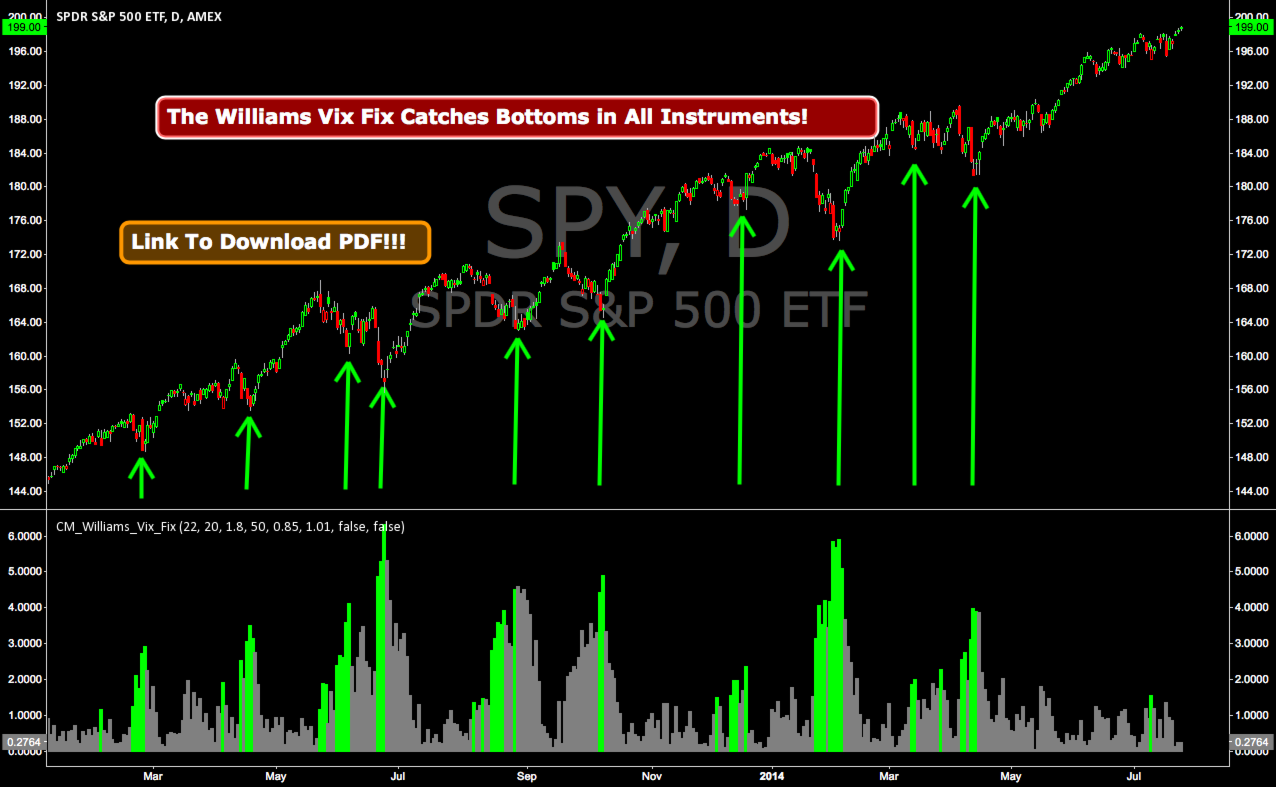
The CM_Williams_Vix_Fix is a sophisticated, volatility-based technical indicator designed to help traders identify potential market reversals by analyzing the relationship between current price lows and the highest closing prices over a specified period. Drawing inspiration from the Volatility Index (VIX)—often referred to as the "fear index"—and possibly incorporating concepts from trader Larry Williams, this indicator provides a unique perspective on market extremes that may signal impending reversals. Displayed in a separate window below the price chart, it uses a combination of a normalized volatility measure, Bollinger Bands, and percentile-based ranges to offer actionable insights.
How It Works
At the heart of the CM_Williams_Vix_Fix indicator is the Williams Vix Fix (WVF) calculation, which quantifies volatility by measuring how far the current low price deviates from the highest closing price over a user-defined lookback period. The WVF is computed as follows:
WVF = ( Highest Close over p d periods − Current Low Highest Close over p d periods ) × 100 \text{WVF} = \left( \frac{\text{Highest Close over } pd \text{ periods} - \text{Current Low}}{\text{Highest Close over } pd \text{ periods}} \right) \times 100 WVF=(Highest Close over pd periodsHighest Close over pd periods−Current Low)×100
- Highest Close over pd periods: The highest closing price observed over the past 'pd' bars.
- Current Low: The lowest price of the current bar.
- Normalization: Dividing by the highest close and multiplying by 100 converts the difference into a percentage, making it easier to compare across different price levels.
A high WVF value indicates that the current low is significantly below the recent high close, which may suggest increased volatility, panic selling, or oversold conditions—often precursors to a potential reversal.
To enhance its utility, the indicator overlays two additional analytical layers on the WVF:
- Bollinger Bands:
- A Simple Moving Average (SMA) of the WVF is calculated over a specified period ('bbl').
- An upper band is set at a multiple ('mult') of the standard deviation above the SMA.
- When the WVF exceeds this upper band, it indicates that volatility is unusually high compared to recent history, potentially signaling an extreme market state.
- Percentile Ranges:
- The indicator identifies the highest WVF and lowest WVF over a lookback period ('lb').
- These values are adjusted by multipliers ('ph' for high and 'pl' for low) to establish rangeHigh and rangeLow, respectively.
- These ranges provide alternative thresholds for identifying extreme WVF values based on recent data.
Visual Representation
The CM_Williams_Vix_Fix indicator is designed to be visually intuitive, offering multiple plotting options:
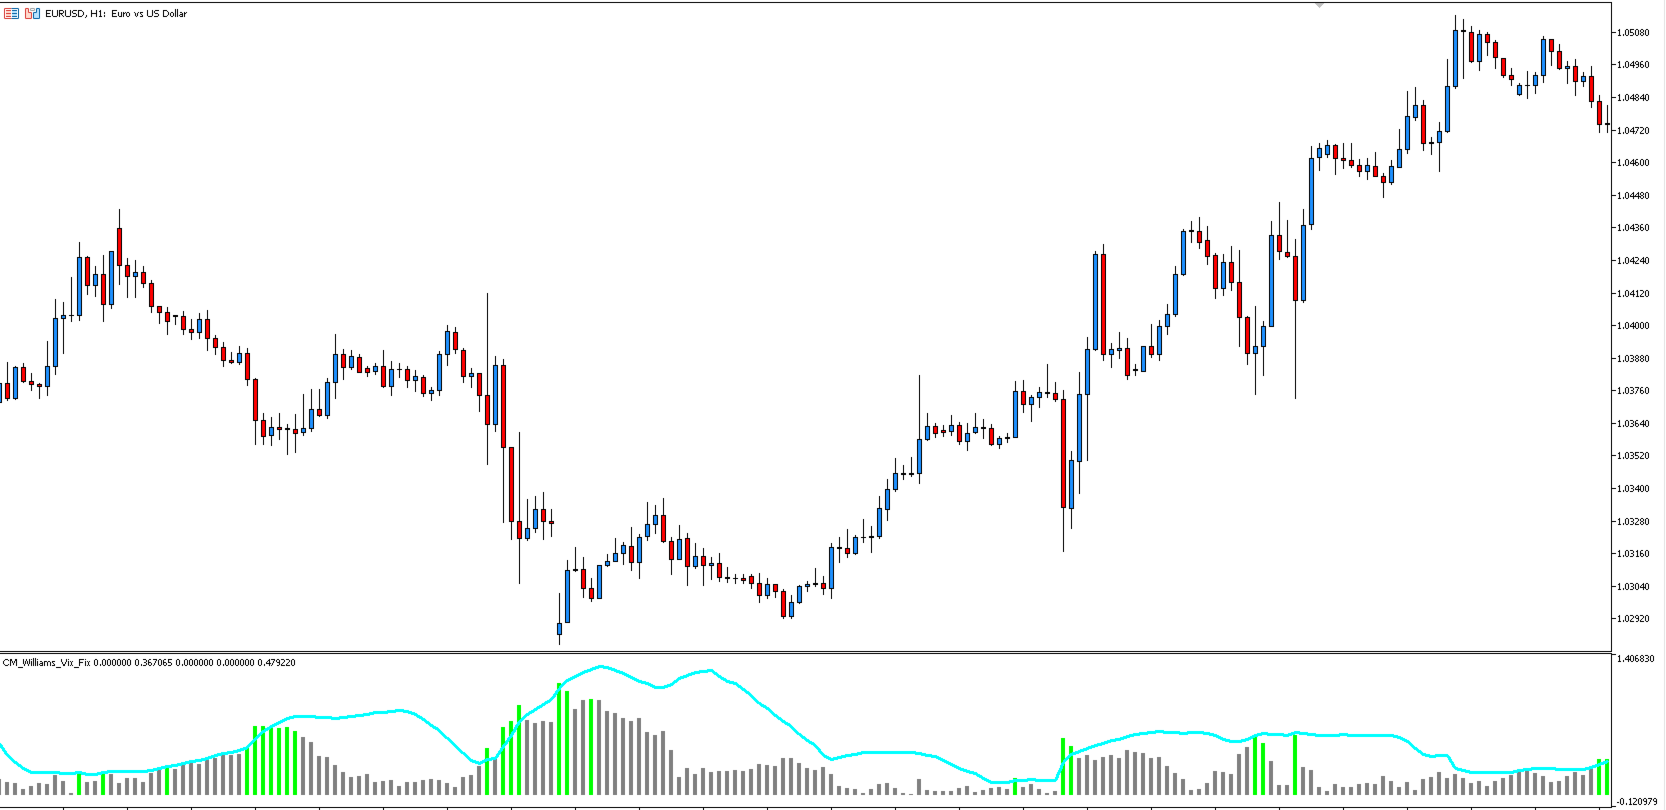
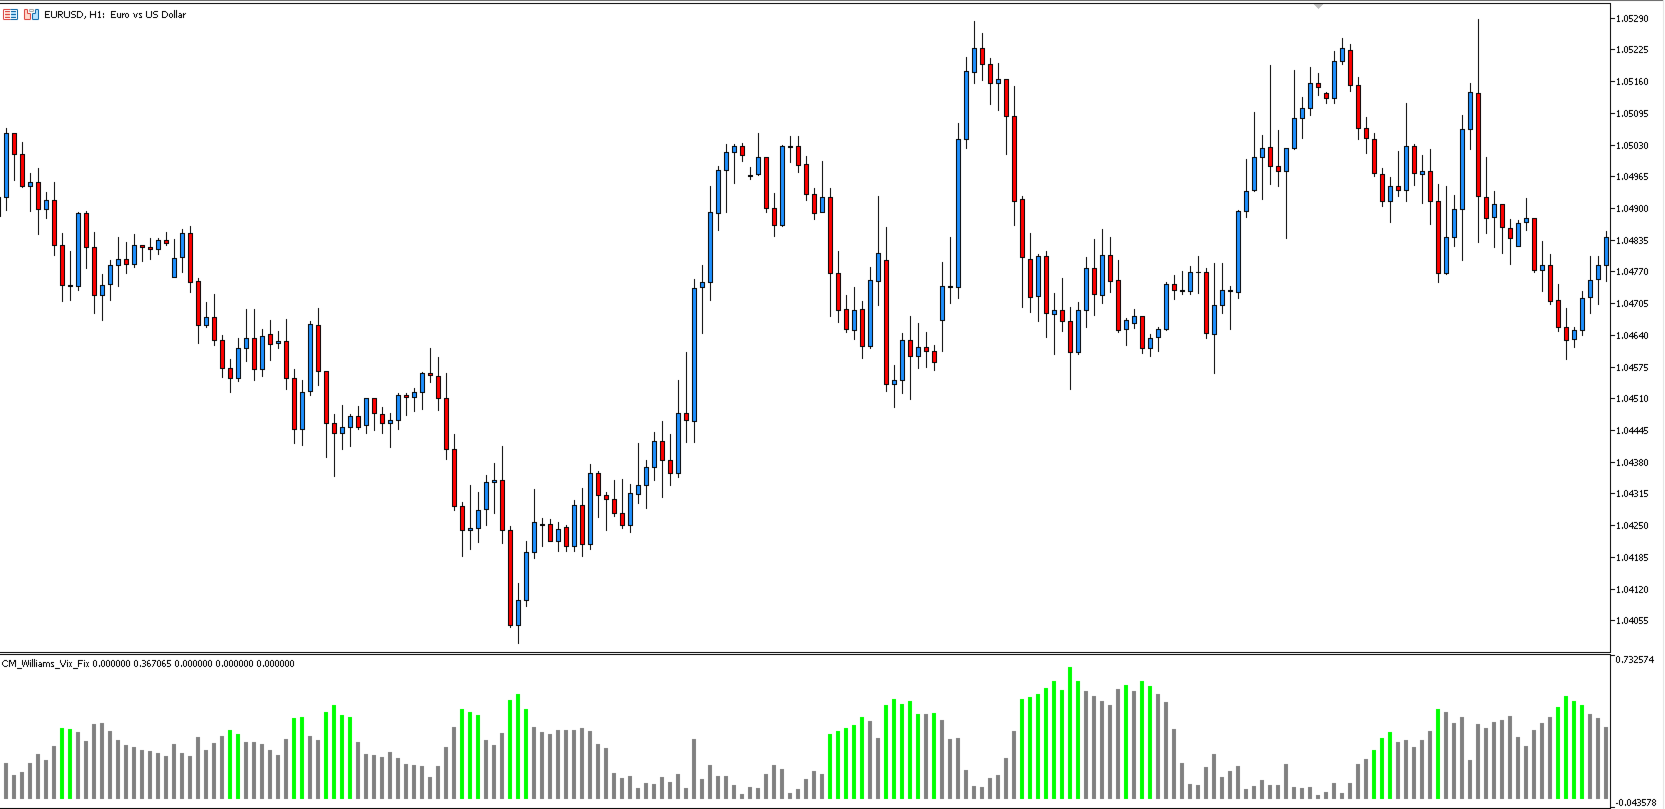
- WVF Histogram:
- The WVF is plotted as a histogram in the indicator window.
- Color Coding:
- Lime: When the WVF is greater than or equal to either the upper Bollinger Band or the rangeHigh, highlighting potential reversal points.
- Gray: When the WVF falls below these thresholds, indicating normal or less extreme conditions.
- Range Lines (Optional):
- If the 'hp' (Show High Range) parameter is enabled, rangeHigh and rangeLow are plotted as orange lines.
- These lines serve as reference points for extreme WVF levels based on recent history.
- Upper Band Line (Optional):
- If the 'sd' (Show Standard Deviation Line) parameter is enabled, the upper Bollinger Band is plotted as an aqua line.
- This line provides a statistical benchmark for identifying when WVF reaches unusually high levels.
The CM_Williams_Vix_Fix indicator is a powerful addition to a trader’s toolkit, blending the volatility insights of the VIX with statistical and percentile-based thresholds. Its core WVF calculation highlights how far current lows deviate from recent highs, while the Bollinger Bands and range lines provide context for identifying extreme conditions. The visual design—featuring a color-coded histogram and optional reference lines—makes it easy to spot potential trading opportunities at a glance.
However, like all technical indicators, it is most effective when used as part of a comprehensive trading strategy. By integrating it with other forms of analysis and sound risk management, traders can leverage the CM_Williams_Vix_Fix to navigate volatile markets and anticipate reversals with greater confidence. Whether you’re a day trader or a swing trader, this indicator offers a flexible and insightful way to interpret market dynamics.