BTC High Ratio
- Эксперты
- Angel Torres
- Версия: 1.5
- Обновлено: 31 марта 2025
- Активации: 5
🚀 Dominate the Bitcoin Market with Our M15-Optimized EA!
Are you looking for an automated trading system that combines advanced technical analysis with professional risk management? Introducing BTC High Ratio 💡, an Expert Advisor designed to trade Bitcoin on the M15 timeframe, using a volatility and trend-based strategy. Check out the results and join the traders already achieving consistent profits! 📊
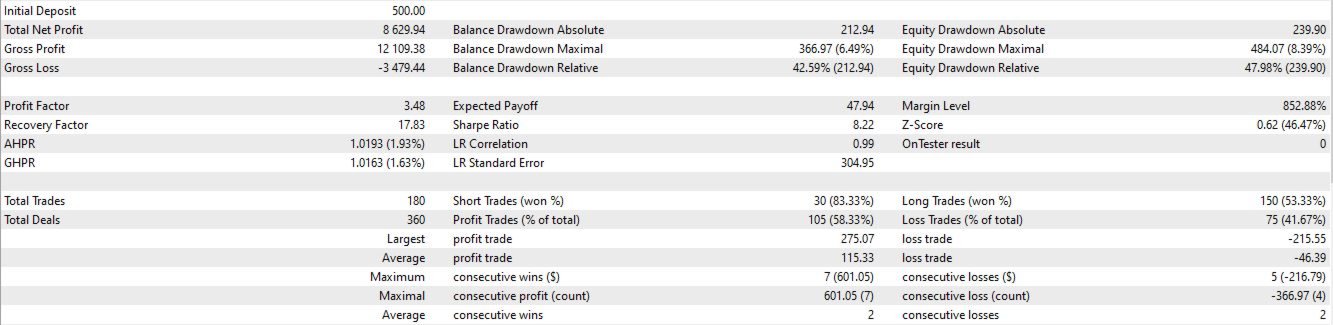
📉 Statistical Results of the System
Our EA has been thoroughly backtested, and the results are impressive:
- Initial Capital: $500.00 💰
- Total Net Profit: $8,629.94 (a growth of 1,725.99%) 📈
- Gross Profit: $12,109.38 ✅
- Gross Loss: -$3,479.44 ❌
- Profit Factor: 3.48 🏆
- Sharpe Ratio: 8.22 (indicator of risk-adjusted profitability) 📊
- Absolute Balance Drawdown: 366.97 (42.59%) ⚠️
- Absolute Equity Drawdown: 484.07 (47.98%) ⚠️
- Expected Payoff (Mathematical Expectation): $47.94 per trade 💸
- Total Trades: 180 (105 winners, 75 losers) 🔄
- Percentage of Winning Trades: 58.33% 🎯
- Largest Winning Trade: $601.05 🤑
- Largest Losing Trade: -$366.97 😓
- Average Profit per Trade: $115.33 💵
- Average Loss per Trade: -$46.39 📉
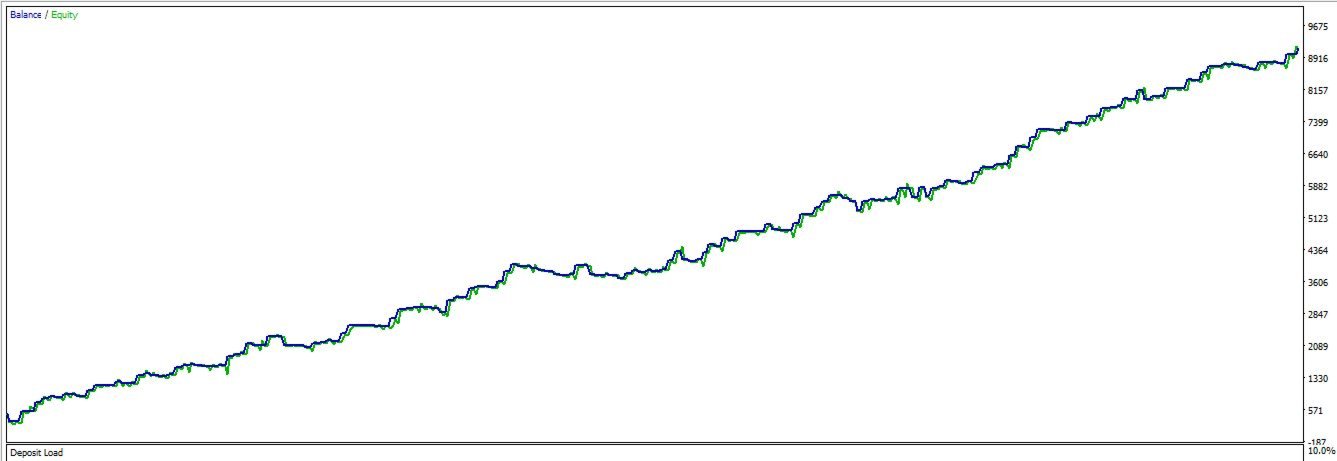
Balance/Equity Chart:
The chart shows steady balance growth from $500 to $9,675, with controlled fluctuations, demonstrating the system’s long-term robustness. 📈
🧠 System Logic
BTC High Ratio operates on the M15 timeframe and uses a combination of technical indicators and money management rules to identify trading opportunities in the Bitcoin market. The core logic is based on:
- Ichimoku Kinko Hyo Indicators:
- IchimokuTenkan (52): Conversion line to detect short-term trends. 📉
- IchimokuKijun (26): Base line to confirm trend direction. 📈
- IchimokuSenkou (52): Ichimoku Cloud to assess support/resistance and confirm trend strength. ☁️
- The system enters a position when the price crosses the Tenkan and Kijun lines, and the cloud confirms the trend direction.
- Average True Range (ATR, 58):
- Used to measure market volatility and dynamically adjust Stop Loss (SL) and Take Profit (TP) levels. 📏
- SL and TP are calculated based on market volatility, allowing the system to adapt to changing conditions. In more volatile markets, SL and TP widen to avoid premature exits, while in less volatile markets, they tighten to maximize efficiency.
- Profit Target and Stop Loss Levels:
- ProfitTarget1: 4.8% 🎯
- StopLoss1: 5.4% 🛑
- ProfitTarget2: 7.6% 🎯
- StopLoss2: 7.4% 🛑
- TrailingStop1: 1.5% 🔄
- These levels are dynamically adjusted by the ATR, ensuring winning trades maximize profits and losing trades are closed quickly.
- Money Management:
- USEMoneyManagement: Enabled (True). ✅
- mmRiskedMoney: $223.0 per trade, a key parameter for risk control. ⚖️
- Volatility Filter (SL2BE, 1.0):
- The system adjusts the stop-loss to break-even when the price reaches a specific volatility level, protecting profits. 🔒
- Trend Filter (BTC High Ratio, 1.5):
- Only trades in markets with a clear trend, avoiding high-uncertainty conditions. 📈
- Magic Number (8694178):
- Unique identifier for the EA’s trades, preventing conflicts with other strategies. 🆔
⚖️ Importance of Risk Management: mmRiskedMoney
The mmRiskedMoney variable is the cornerstone of BTC High Ratio’s risk management. This parameter defines how much money you’re willing to risk per trade—in this case, $223.0. But why is it so important? 🤔
- Dynamic Lot Size Calculation:
- The system uses mmRiskedMoney and combines it with the ATR to calculate the lot size per trade. 📐
- The ATR measures market volatility in pips. The system divides the risked amount (mmRiskedMoney) by the number of pips in the SL (calculated by ATR) to determine the lot size.
- Formula:
Lot Size = mmRiskedMoney SL Pips × Value per Pip \text{Lot Size} = \frac{\text{mmRiskedMoney}}{\text{SL Pips} \times \text{Value per Pip}} Lot Size=SL Pips×Value per PipmmRiskedMoney
This ensures that the risk per trade remains constant, regardless of market volatility.
- Risk Control:
- By setting mmRiskedMoney to $223.0, you ensure that no trade risks more than that amount, protecting your capital during a losing streak. 🛡️
- For example, if the SL calculated by the ATR is 50 pips and the value per pip is $1, the system will adjust the lot size so the total risk is $223.0.
- Adaptability:
- Since SL and TP are adjusted by the ATR, the risked amount is distributed intelligently. In volatile markets, SLs are wider, reducing the lot size to keep risk fixed. In less volatile markets, SLs are tighter, allowing a larger lot size without increasing risk. 🔄
- Long-Term Protection:
- Proper risk management is key to survival in trading. With mmRiskedMoney, you can customize your risk level based on your tolerance, ensuring the system remains sustainable even in adverse conditions. 📅
💬 Want to optimize your risk settings? If you’d like us to help you adjust mmRiskedMoney or any other parameter to suit your trading style, reach out to us! We’re here to help you maximize your results. 📩
📊 Mathematical Expectation and Analysis
The mathematical expectation of the system is one of its strengths:
- Expected Payoff: $47.94 per trade. 💸
This is calculated as:
Expectation = ( Win Probability × Average Win ) − ( Loss Probability × Average Loss ) \text{Expectation} = (\text{Win Probability} \times \text{Average Win}) - (\text{Loss Probability} \times \text{Average Loss}) Expectation=(Win Probability×Average Win)−(Loss Probability×Average Loss) - Win Probability: 58.33% (0.5833) ✅
- Average Win: $115.33 💵
- Loss Probability: 41.67% (0.4167) ❌
- Average Loss: $46.39 📉
Expectation = ( 0.5833 × 115.33 ) − ( 0.4167 × 46.39 ) = 67.27 − 19.33 = 47.94 \text{Expectation} = (0.5833 \times 115.33) - (0.4167 \times 46.39) = 67.27 - 19.33 = 47.94 Expectation=(0.5833×115.33)−(0.4167×46.39)=67.27−19.33=47.94
This means that, on average, each trade has a positive expected value of $47.94, ensuring sustained capital growth over the long term. 📈
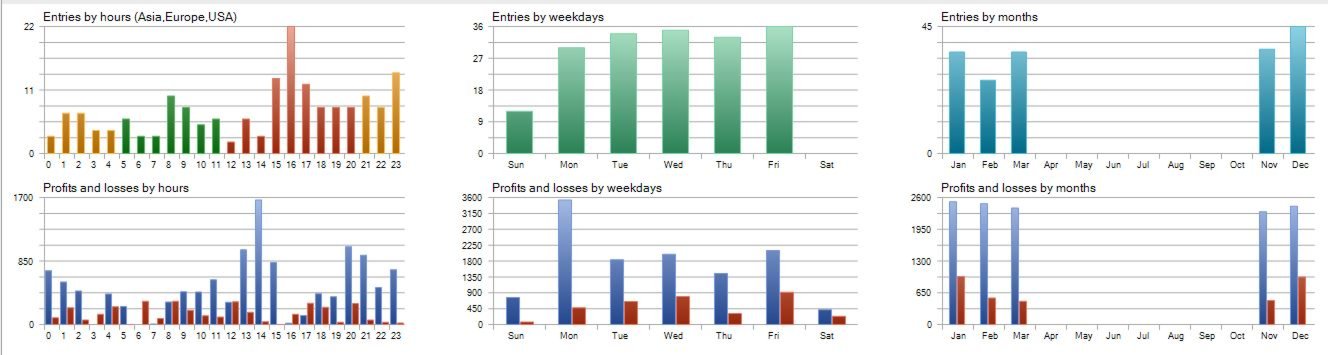
📅 Trade Distribution
- By Hours (Asia, Europe, USA):
- Highest activity between 13:00 and 15:00 (European session), with peaks in entries and profits. 🌍
- Low-volatility hours (0:00-5:00) have fewer trades, reducing risk during low-liquidity periods. 🌙
- By Days of the Week:
- Most active days are Monday to Friday, with an average of 36 entries per day. 🗓️
- Saturday and Sunday have less activity, reflecting lower volatility in the crypto market over the weekend. 🏖️
- By Months:
- Highest activity in October and November, with up to 45 entries. 🍂
- February, the shortest month, has fewer trades (around 20). ❄️
- Profit and Loss Distribution:
- Profits are more frequent and consistent during high-volatility sessions (13:00-15:00). 💰
- The largest losses occur during high, non-directional volatility, but the system mitigates them with a trailing stop and adjusted stop-loss. 🛑
🌟 Why Choose BTC High Ratio?
- High Profitability: 1,725.99% return on initial capital. 📈
- Controlled Risk: Maximum drawdown of 47.98%, with strict money management. ⚖️
- Proven Strategy: Based on Ichimoku and ATR, ideal for M15 timeframes. 🧠
- Flexibility: Dynamic SL and TP adjustments based on market volatility. 🔄
- Transparency: All statistics and settings are available for you to analyze. 📊