MACDx RSI Supply And Demand Indicator
- Индикаторы
- Blessing Takura Chirewa
- Версия: 1.0
- Активации: 5
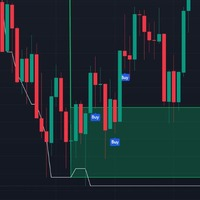
MACDx RSI Supply And Demand Indicator is a dynamic trading indicator designed to identify potential reversal zones in financial markets by combining the momentum insights of the Relative Strength Index (RSI) with order block (supply/demand) levels derived from a MACD-based custom tool. It visually highlights bullish and bearish zones on the chart, offering clear entry signals through directional arrows. Ideal for swing traders and reversal strategists, this tool aims to capture price reversals after overextended market conditions.
Key Components
-
Bullish & Bearish Order Blocks (OB):
-
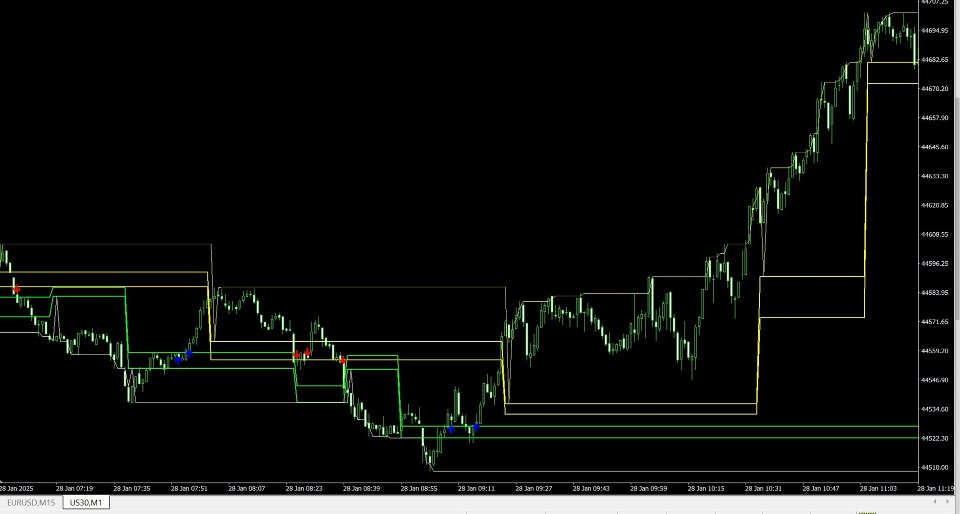
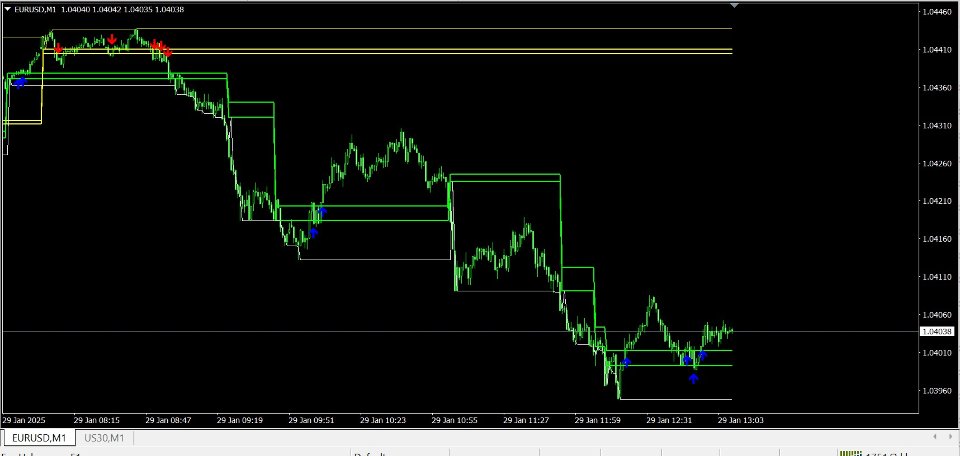
Bullish Zones (Lime): Activated when RSI falls below 30 (oversold), marking potential demand areas. These zones are defined by dynamic support levels calculated using the "MACD_High_And_Lows" indicator.
-
Bearish Zones (Yellow): Triggered when RSI exceeds 70 (overbought), signaling potential supply areas. These zones reflect resistance levels from the same MACD-based tool.
-
-
Confirmation Levels:
-
Lowest Low (White Line): Tracks recent price lows to validate bullish reversals. A rising Bullish OB low above this level strengthens buy signals.
-
Highest High (Yellow Line): Monitors recent price peaks to confirm bearish reversals. A declining Bearish OB high below this level reinforces sell signals.
-
-
Entry Signals:
-
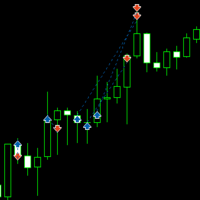
Blue Up Arrow (Buy): Generated when price closes above the Bullish OB high, accompanied by a confirmed breakout from oversold conditions.
-
Red Down Arrow (Sell): Appears when price closes below the Bearish OB low, following an overbought RSI reading and breakdown confirmation.
-
How It Works
-
Momentum + Structure: The RSI identifies overbought/oversold conditions, while the MACD-based tool maps structural support/resistance levels. Together, they pinpoint zones where price is likely to reverse.
-
Signal Logic:
-
Buy: Price breaks above the Bullish OB high after an RSI oversold signal, with the Bullish OB low holding above recent lows.
-
Sell: Price breaks below the Bearish OB low after an RSI overbought signal, with the Bearish OB high staying below recent highs.
-
Ideal Market Conditions
-
Trend Pullbacks: Best suited for trending markets where price retraces into Bullish/Bearish OB zones before resuming the trend.
-
Range-Bound Markets: Effective in sideways markets when price oscillates between overbought/oversold extremes.
-
Asset Classes: Works across Forex, equities, and commodities, particularly in instruments with clear momentum shifts.
Usage Tips
-
Combine with Price Action: Use arrows alongside candlestick patterns (e.g., engulfing, hammers) for higher-probability trades.
-
Risk Management: Place stop-loss orders below Bullish OB lows (for buys) or above Bearish OB highs (for sells).
-
Avoid Choppy Markets: Less effective in low-volatility or erratic price environments without clear RSI extremes.
