Stochastics and SAR Projection
- Индикаторы
- Pavel Milicka
- Версия: 1.0
- Активации: 5
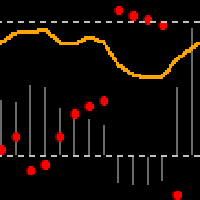
The stochastic indicator itself creates false signals. One way to determine that the price is trending is to use the parabolic SAR indicator. As a rule, it is plotted on the chart.
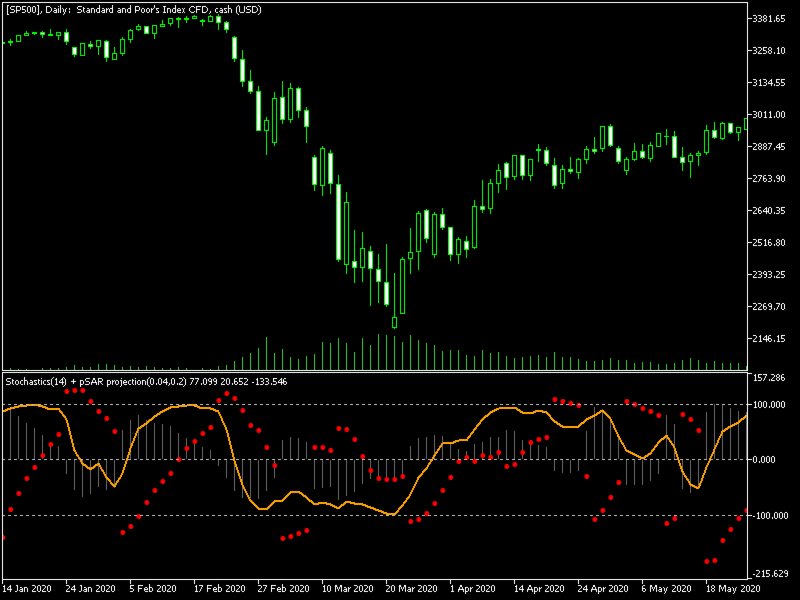
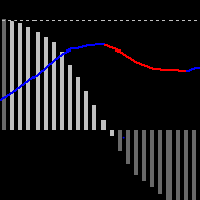
The projection of the SAR into the Stochastic Indicator is not complicated (pSAR-min)/(max-min). This will allow you to track price movement from two views in one place.
It depends very much on the parameter settings.
If the price is trending, the SAR moves towards the midpoints or close to them. On the other hand, a sideways trend is characterized by diverging SAR curves.
