• Обзор
  • Отзывы
  • Обсуждение

Quantum VWAP Pro

The VWAP indicator is another of our suite of volume indicators and one which was first referred to in 1988 when it appeared in an article entitled “The Total Cost Of Transactions On The NYSE” in the March edition of the Journal Of Finance from that year, which went on to explain its importance, particularly from an institutional perspective, which underpins its significance in appreciating the power and importance of this indicator.

In many ways, it is akin to the volume price analysis methodology itself, as we are merely attempting to follow the footprints in the sand left by their passage and described by volume. The same is true here, but in this case, we are following the institutions in much the same way.

Originally, the VWAP indicator was developed as a benchmark to measure whether an institutional customer received a fair execution of their order by the broker buying and selling on their behalf. The difference between the reported price and the VWAP gave the customer a benchmark against which to judge whether they had received a fair price or not. A portfolio manager for example, wants to know how the price they paid compared to the average price of the stock during the time it took to fill the order. If an order is filled at a worse price than the VWAP, it raises questions as to the ability of the broker. If the broker purchased a million shares at $40.50 and the VWAP during this time was at $40.70, the customer is likely to be happy since they paid 20 cents less than ‘fair value’. Equally, if the stock were purchased above, at, say $40.90 per share, the customer would consider this a poor trade, paying well above the fair value price at the VWAP.

The simplicity of this easy-to-understand benchmark, which creates this fair value price concept, has led to its wholehearted adoption amongst the institutions, and moreover, why algorithmic VWAP orders now dominate institutional market activity. A huge percentage of institutional orders are executed as VWAP orders, which raises two key questions. First of all, why, and second, how can we benefit from using the indicator?

If we start with the why, according to reports from the leading market makers, almost 40% of orders are now executed on this basis as they attempt to obtain a buy or sell price close to or better than the VWAP during the time it takes to complete the buy or sell order. These orders, therefore, help to hugely reinforce the importance of the VWAP since it is the guiding principle on which these orders are based. Even Warren Buffet uses VWAP, as evidenced when he sold his entire position in Southwest Airlines over two days, holding 2.3 million shares.

This highlights the key issues for any large institutional investor involving the price. If executed in a single order, an order to buy a large block of shares would almost certainly swamp the market, raising the price exponentially and, in addition, overwhelm the average volume traded in the day.

It is this issue of putting the price up against their own buying or conversely seeing the price fall as a result of their own selling that leads to the parent and child order scenario where significant block orders are broken into a multitude of smaller orders, which are duly executed over days, weeks or months. It is this aspect of institutional order execution that makes the VWAP such a potent indicator.

However, at Quantum Trading, we don’t just build a single indicator and leave it at that! We always take them to another level, and here we have done the same, bundling together a total of five indicators into one amazing value package so you can select your favorite from those on offer. The reason for this is we recognize the different ways the volume-weighted average price is used, which is why we offer a total of FIVE variants to choose from, and these are as follows:

  • VWAP – Volume Weighted Average Price
  • MVWAP – Moving Volume Weighted Average Price
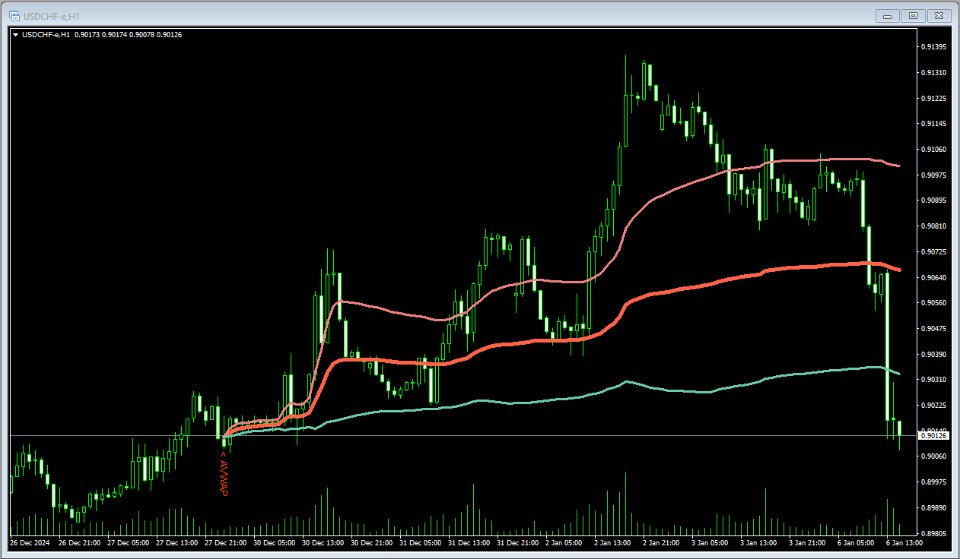
  • AVWAP – Anchored Volume Weighted Average Price
  • TWAP – Time Weighted Average Price
  • Interday Volume Weighted Average Price

All five variants include the option to display upper and lower bands that act as envelopes above and below the VWAP based on standard deviation, which you can adjust and set yourself. These price envelopes become essential dynamic support and resistance levels, which can help predict the extremes of price action as it oscillates around the VWAP from the fastest to the slowest timeframes and everything in between.

All five indicators are packaged into one powerful indicator, which we have named the Quantum VWAP Pro indicator for obvious reasons, and as you would expect, it works in all markets and instruments, whether stocks, futures, ETFs, forex or cryptocurrencies.

Finally, as with all our indicators, we recommend you use it in multiple timeframes.


Рекомендуем также
The Trend Professor is a moving average based indicator designed for the purpose of helping the community of traders to analyse the price trend. The indicator will be displayed in the main chart as it is indicated on the screenshot section. How it works The indicator has lines of moving averages and colored histograms to depict the direction of the trend. There will be a fast signal line colored blue/yellow/red at some points. The red/yellow colored lines stands for bearish trend/signal while th
Implement
Vitalii Zakharuk
5 (1)
Implement анализирует динамику рынка для точек разворота. Если вы хотите узнать, как определить правильные развороты для постоянной вероятной прибыльной торговли, купите этот индикатор. Показывает благоприятные моменты входа в рынок полосками. Готовая торговая система.  Принцип работы индикатора заключается в том, чтобы при размещении на график автоматически определять текущее состояние рынка, анализировать исторические данные, на основании исторических данных и выводить на экран трейдеру ука
REMINDER: Early buyers hot price discount: Price subject to rise after first 20 copies. Starting price $65 and final price will be $1275. Secure your discounted copy Now! Smart Money Analyser Indicator User Manual 1. Introduction Welcome to the   Smart Money Analyser Indicator This powerful tool provides traders with comprehensive market analysis by combining various technical indicators to generate actionable trading signals. Designed to be user-friendly, this indicator helps traders of a
Namiri Trade Engine is an ALL in ONE trading system that combines market structure, volume pressure, market condition & risk management to give you the BEST opportunities for A+ trade setups with auto lot size WAIT FOR YOUR A+ SETUP || ONLY TAKE YOUR A+ TRADE || RINSE REPEAT YOUR A+ MOVE Chart Features Panel - Shows the asset, market, price, pip, account, trade & profit|loss information Structure - Shows areas of support & resistance Risk Management - Shows risk analysis period of 100 bars
Moving Pivot Average    The pivot indicator compares the selected period with its counterpart from the previous period. The indicator uses very flexible algorithm for pivot value calculating. It allows you to allocate in days a certain time intervals (custom bars) and calculate the average pivot value based on High, Low and Close prices of these bars. How many custom bars will be taken into account is determined by the "Days" setting. The pivot line can be considered an average trend line and us
Индикатор тренда Trend New , показывает сигналы для входа. Отображает как точки входа, так и сам тренд. Показывает статистически рассчитанные моменты для входа в рынок стрелками. При использовании индикатора можно оптимально распредилить коеффициент риска. Настройки: Использует все один параметр для настроек. Подбирая параметр необходимо визуально подобие так чтоб насоответствующем графике была отмальная проекция экстремумов. Параметры: Length - количеств баров для рассчета индикатора. Испо
This indicator prepared by using 311,1298 days Haskaya Trend Bandse and Calculates the strand ADX.    This system can be used for 5M time frame.     This system is for Long term and profitable.    Signals are shown as arrows. as an optional,    you can set a voice alarm or email notification    You can fins our other products from link : https://www.mql5.com/en/users/drbastem/seller    Also, you can ask all your questins from email : haskayafx@gmail.com or mobile : +90 530 867 5076 or @Meh
SSA stands for ' Singular Spectrum Analysis '. It combines elements of classical time series decomposition, statistics, multivariate geometry, dynamical systems and signal processing. SSA decomposes time series into a sum of components (ETs), with each component representing a lower smoothing, using several SVD ( Singular Value Decompositions ). It is a powerful filtering process used in many fields of research (climatology, biomedical, aerospace, etc), where high quality forecasting and smoo
Dear traders I am happy to introduce to you my new tool called "Brilliant Oscillator" Indicator. This is one of the indicators that can be used as a stand alone indicator. WHAT I LIKE ABOUT THIS TOOL IS Fast and reliable signals Purpose The purpose of this tool is to assist both newbie and Advanced traders to analyze the market with high level of accuracy in both bearish and bullish market trends. The inputs In the input section you will be able to change colors of the indicator only. Currency p
Этот индикатор представляет собой индикатор автоматического волнового анализа, который идеально подходит для практической торговли! Случай... Примечание.   Я не привык использовать западные названия для классификации волн. Из-за влияния соглашения об именах Тан Лунь (Тан Чжун Шуо Дзен) я назвал основную волну   ручкой   , а вторичную полосу волн —   сегментом   Ат. в то же время сегмент имеет направление тренда. Именование   в основном является трендовым сегментом   (этот метод именования буд
Работа бота Stable Pulse отображена в виде некольких ключевых ммоментов, что можно увидеть на скриншотах. Данная разработка это скальперская система. Вы можете бесплатно загрузить и протестировать бот таким образом самостоятельно убедившись в его возможностях. Бот можно тестировать на разных валютных парах и разных периодах. Главное установите настройки тестера так как показано на скриншоте, для корректного тестирования. Торговать нужно на таймфреймах M1-M15. Эксперт создан для торговли на любо
The Trend Analysis Indicator is an innovative tool designed for traders and investors who seek to navigate the complexities of the financial markets with greater precision and insight. This powerful indicator is engineered to adeptly identify whether a market is trending or not, offering users a vital edge in their trading strategy. Key Features: Accurate Trend Detection : The core functionality of the Trend Analysis Indicator lies in its ability to accurately detect market trends. It analyzes p
CSS " currency strength slope "  is a a multi currency strength indicator that use Forex major currencies, EUR, USD, CAD, AUD, NZD, JPY, CHF, GBP. it use 28 major pairs to calculate the power of every currency using a based moving averages algorithm : you will see volatility clearly between currencies. input: MA Fast & Slow. - MA Mode : simple, exponential, smoothed, linear weighted - Applied Price : close, open, high, low, median price, typical price, weighted price.
Индикатор Cancer отлично подойдет для трендовой торговли! Интеллектуальный алгоритм индикатора с высокой вероятностью показывает точки потенциального разворота рынка. Если вы торгуете по тренду то стратегия торговли построенная на основе данного индикатора отлично ам подойдет. Индикатор фильтрует рыночной шум, приктически все и все необходимые функции для работы по треду встроены в один инструмент. Работает на всех валютных парах и на всех таймфреймах, настройка индикатора - по вашему желанию. Г
PowerXXX
Marco Fornero Monia
PowerXXX measures the power of the current candlestick and displays it in numerical format and colors. The indicator can cover multiple timeframes and can be placed on the main chart or on the charts of the underlying indicators. The number of timeframes is selectable, as well as the color levels according to the power expressed. In the latest version, the power can be expressed as a function of the opening of the candle itself or as a function of the opening of the total candles before. There
Sequential R
Antony Augustine
3 (2)
В современных условиях рынка объективный метод торговли против тренда может стать ценным преимуществом трейдера. Большинству Форекс-трейдеров, наверняка, знакомы названия "TD Sequential" и "Range Exhaustion". Sequential R - торговля против тренда с использованием системы распознания истощения трендов Simple Range Exhaustion. Система TD Sequential предназначена для определения точек истощения тренда, позволяя оказаться впереди толпы трейдеров, Следующей за трендом. Индикатор Sequential R предна
This system never paints.   This system created by using Envolpes bands and reverse bar count.   This indicator is only working in M5 period.   This system is for long term and profitable.   Signals are shown as arrows. as an optional limit orders.   You can set a voice alarm or email notification.   You can fins our other products from link : https://www.mql5.com/en/users/drbastem/seller   Also, you can ask all your questins from email : haskayafx@gmail.com or mobile : +90 530 867 5076 or @Meh
Этот индикатор на панели инструментов зоны спроса и предложения с несколькими временными рамками и несколькими символами отправляет предупреждения, когда цена достигает зоны спроса / предложения. Также можно использовать его для предупреждения об обычных двойных вершинах / основаниях вместо зон. Его можно использовать на всех таймфреймах от M1 до MN. Можно использовать фильтры RSI, дивергенции (MACD, RSI или Awesome) и свечных паттернов (пин-бар, поглощение, пинцет и утренняя / вечерняя звезда),
Introduction to the use of MT4 platform AI Color Gradient Volume indicators I. Overview of indicators AI Color Gradient Volume is an innovative volume analysis indicator based on artificial intelligence technology for the MT4 platform. By converting the volume data into an intuitive color gradient graph, it helps traders to have a more acute insight into the inflow and outflow of funds in the market and the strength of the buying and selling forces, so as to provide strong support for trading
ToolBox 360 is the swiss knife of all indicators. It is full packed with useful tools to help you with your trading. It can be used to find best entry and exit points and help you to decide if you should open a trade or not. It shows market trends, candlestick formations outside / inside bars and you can sett time based allerts. Main features: Time based Fibonacci lines Choose a start and end time and the indicator shows you Fibonacci lines within the selected time range including range high
This strategy is characterized by simplicity and rudeness. Simple things, it is widely applicable, durable, strong stability. This is an advantage to having a certain amount of money, because the demand for big money is stable. The need for small capital is efficiency. Efficiency requires Intensive farming. There are a lot of things you can refine to increase your efficiency. But I’m not sure I can build a sophisticated EA money machine. Efficiency and stability are a dialectical relationship. H
Индикатор Ruby Trend рассчитывает уровни насыщенности ценового графика. Сигнал на выход из области перепродажи является сигналом на покупку. Сигнал на выход из области перекупки является сигналом на продажу. Обычно нужно задать относительные величины для уровня перекупленности и перепроданности Bottom и Top - для данного индикатора.  Чаще всего хороший тренд виден на ценовом графике визуально. Но опытный трейдер перед входом должен четко понимать текущую расстановку сил на рынке. И индикатор
Считается, что валютный рынок большую часть времени является флэтовым. Поэтому Neon Bot был разработан, опираясь на этот принцип, а именно на логику возврата цены к среднему значению с фильтрацией входов по пользовательскому индикатору. Советник использует стратегию мартингейла, поэтому стоп-лосс выставляется отдельно для каждой позиции, а количество ордеров строго ограничено. Не нарушайте рекомендуемый ММ, чтобы избежать большой просадки. Сигналы:   https://www.mql5.com/ru/users/samivanov/sell
1. Строгая логическая оценка: Благодаря многоуровневому вложению нескольких условий обеспечивается выполнение открытия позиции только в строго определенных и ограничивающих условиях, таких как включение программного переключателя, наличие линий фибоначчи, не являющееся временем открытия MACD и отсутствие активации стратегии Мартингейла. Такой подход позволяет избежать ненужных сделок и уменьшает неоправданный риск. 2. Интеграция различных инструментов технического анализа: Сочетание линий фиб
A trading system based on divergences is one that uses divergences between technical indicators and market prices to identify potential trading opportunities. Here's how this type of trading system operates: Divergence identification: The divergence-based trading system seeks to identify divergences between technical indicators and market prices. A divergence occurs when the market price and a technical indicator move in different directions, which can indicate a possible trend reversal. Signal
28 market in a Single Indicator! You have 8 Lines and each represents a currency { EUR - USD - GBP - JPY - AUD - NZD - CAD - CHF } . What It Does? It calculates a custom oscillator on all 28 Forex Pairs and draws you the Strength of each currency. This way you can analyze the Trend and the Volatility on a Multicurrency Rate. Also by Clicking   on two different currencies instantly changes the market. How To Use It? You can use this indicator to find true market contractions when two currenc
Принцип работы индикатора очень прост: обнаруживается точка возврата с помощью осциллятора Stochastic, затем применяется скользящая средняя для отслеживания тренда и наконец генерируются сигналы на покупку и продажу в виде стрелок, алертов и уведомлений. Параметры фиксированы и автоматически рассчитываются для каждого таймфрейма. Пример: При запуске индикатора на EURUSD он обнаруживает точку возврата в месте восходящего пересечения стохастиком основной/сигнальной линии из положения ниже минимума
Индикатор «Market Profile» отображает профили и объёмы периодов – недельный, суточный, сессионный (8-ми часовой), 4-х часовой, часовой, суммарный. На каждом профиле (кроме суммарного) автоматически выделяется пунктиром VAH/VAL зона стоимости. В индикатор введена цветоразностная дельта, которая подкрашивает области профилей. Области преобладающих покупок подкрашивается в зелёный цвет, области преобладающих продаж – в красный. На суммарной гистограмме соответственно синий/красный. В режиме фильтра
Rira VWAP Bands
Vitor Palmeira Abbehusen
VWAP Bands gives you the regular Volume-Weighted Average Price and also the deviation bands. Use this indicator to see the possible amount of market movement, find support and resistance lines, find good spots for entry and exit,  and the most important feature is to find possible pivot points. This indicator has been mathematically improved by Rira team. The calculation begins at the start of each trading day
This is based on Demark's TD Sequential and TD Combo set of indicators. It mostly has the TD Sequential features. It contains the Arrows Indicator showing Buy/Sell signals and the scanner dashboard. Both are for MT4 (Metatrader 4) Platform. Read in detail in this blog post. And get extra indicators here: https://www.mql5.com/en/blogs/post/749596 and commentary about signals and how to wait for right time: https://www.mql5.com/en/blogs/post/759157 Feature List: - Set TD Setup (9), Countdown (
С этим продуктом покупают
Trend Reversal – Ваш помощник в определении разворотов тренда на MT4 Ищете мощный и интуитивно понятный инструмент для улучшения анализа рынка и принятия более осознанных решений? Индикатор Trend Reversal специально разработан для трейдеров, которые хотят точно определять точки разворота тренда прямо на платформе MetaTrader 4. Благодаря сочетанию продвинутых алгоритмов и проверенных техник Trend Reversal предоставляет четкие и видимые сигналы, помогающие распознавать ключевые рыночные моменты.
FX Volume
Daniel Stein
4.58 (33)
Получите истинное преимущество на Forex с помощью FX Volume: Лучший индикатор объема FX Volume - это первый и единственный индикатор объема, который показывает истинное настроение рынка с точки зрения инсайдера. Предоставляя уникальную информацию о позиционировании институциональных участников рынка и брокеров, FX Volume позволяет вам торговать с такой прозорливостью, которая обычно присуща крупным игрокам. Попрощайтесь с задержками с отчетами COT - FX Volume предоставляет вам эту важную инфор
Раскройте всю мощь FX Power NG: лучший измеритель силы валют Уже более восьми лет FX Power предоставляет трейдерам по всему миру надежный и точный анализ силы валют. Теперь FX Power NG выводит этот надежный инструмент на новый уровень, предлагая расширенные функции, которые обеспечивают непревзойденную точность, настройку и понимание вашей торговли. Что делает FX Power NG обязательным для серьезных трейдеров? FX Power NG основывается на всем том, что вы любили в оригинальном FX Power, с ключ
TPSproTREND PrO
Roman Podpora
4.79 (19)
TPSpro TREND PRO   —  трендовый индикатор, который автоматически анализирует рынок и предоставляет информацию о тренде и каждой его смене а также дающий сигналы для входа в сделки без перерисовки! Индикатор использует каждую свечу, анализируя их отдельно. относя к разным импульсам – импульс вверх или вниз. Точные точки входа в сделки  для  валют, крипты, металлов, акций, индексов! INSTRUCTIONS     RUS   -    ENG         Рекомендуем использовать с  индикатором -  RFI LEVELS Version MT5 Осно
Важным ключевым элементом в трейдинге являются зоны или уровни, от которых принимаются решения о покупке или продаже торгового инструмента. Несмотря на попытки крупных игроков скрыть свое присутствие на рынке, они неизбежно оставляют следы. Наша задача заключалась в том, чтобы научиться находить эти следы и правильно их интерпретировать. INSTRUCTIONS     RUS   -    ENG                    Рекомендуем использовать с индикатором -   TPSpro  TREND PRO -  Version MT5 Основные функции: Отображения ак
Инновационный индикатор, использующий эксклюзивный алгоритм для быстрого и точного определения тренда. Индикатор автоматически рассчитывает время открытия и закрытия позиций, а также подробную статистику работы индикатора на заданном отрезке истории, что позволяет выбрать наилучший торговый инструмент для торговли. Вы также можете подключить свои пользовательские стрелочные индикаторы к Scalper Inside Pro для проверки и расчета их статистики и прибыльности. Scalper Inside PRO (версии 6.5 и выше)
Ultimate Sniper Dashboard
Hispraise Chinedum Abraham
4.82 (22)
Скидка $299! Цены могут вырасти в будущем! Читайте описание ниже! Лучшая система ввода для Ultimate Sniper Dashboard: ПРЕДЕЛЬНЫЕ ДИНАМИЧЕСКИЕ УРОВНИ. (Пожалуйста, проверьте мои продукты) Ultimate Sniper Dashboard работает ТОЛЬКО на реальных рынках из-за ограничений мультивалютного тестирования MT4. Представляем вам Ultimate-Sniper Dashboard! Наша самая лучшая панель, которая содержит HA-Sniper, MA-Sniper и множество специальных режимов. Ultimate Sniper Dashboard - это абсолютный зверь!
В настоящее время скидка 20%! Лучшее решение для новичка или трейдера-эксперта! Эта приборная панель работает на 28 валютных парах. Он основан на 2 наших основных индикаторах (Advanced Currency Strength 28 и Advanced Currency Impulse). Он дает отличный обзор всего рынка Forex. Он показывает значения Advanced Currency Strength, скорость движения валюты и сигналы для 28 пар Forex на всех (9) таймфреймах. Представьте, как улучшится ваша торговля, когда вы сможете наблюдать за всем рынком с пом
Dynamic Forex28 Navigator — инструмент для торговли на рынке Форекс нового поколения. В НАСТОЯЩЕЕ ВРЕМЯ СКИДКА 49%. Dynamic Forex28 Navigator — это эволюция наших популярных индикаторов, объединяющая мощь трех в одном: Advanced Currency Strength28 Indicator (695 отзывов) + Advanced Currency IMPULSE with ALERT (520 отзывов) + CS28 Combo Signals (бонус). Подробности об индикаторе https://www.mql5.com/en/blogs/post/758844 Что предлагает индикатор Strength нового поколения?  Все, что вам нрав
Данный индикатор находит и отрисовывает зоны , так сказать места силы, где цена будет разворачиваться. Индикатор может работать на любом графике, любом инструменте, любом таймфрейме. Индикатор имеет два режима. Индикатор оснащен панелью управления с кнопками для удобства и разбит на два режима. Ручной и авто. Ручной режим: Для работы с ручным режимом необходимо нажать кнопку NEW, появится отрезок. Данный отрезок натягиваете на движение и нажимаете кнопку LVL. Отрисовывается уровень. Авто режим:
Индикатор разворота ADR сразу показывает, где в настоящее время торгуется цена относительно своего нормального среднего дневного диапазона. Вы будете получать мгновенные оповещения через всплывающие окна, электронную почту или push-уведомления, когда цена превышает свой средний диапазон и уровни выше него по вашему выбору, чтобы вы могли быстро переходить к откатам и разворотам. Индикатор рисует на графике горизонтальные линии на экстремумах среднего дневного диапазона, а также расширения выше
Full Forex Market View Dashboard
Opengates Success International
5 (2)
ПОЛНЫЙ ОБЗОР РЫНКА FOREX Индикатор приборной панели Это пользовательский индикатор, созданный, чтобы дать трейдерам полное представление о том, что происходит на рынке. Он использует данные в режиме реального времени для доступа к рынку и отображения каждого бита информации, необходимой для успешной торговли. МОНТАЖ: Прежде чем прикреплять этот индикатор к оконному графику, перейдите на панель «Обзор рынка» вашего MT4 и СКРЫТЬ все валютные пары, которые вам не нужны или которыми вы торг
MetaBands M4
Vahidreza Heidar Gholami
5 (3)
MetaBands использует мощные и уникальные алгоритмы для построения каналов и обнаружения тенденций, чтобы предоставлять трейдерам потенциальные точки для входа и выхода из сделок. Это индикатор канала плюс мощный индикатор тенденций. Он включает различные типы каналов, которые могут быть объединены для создания новых каналов, просто используя параметры ввода. MetaBands использует все типы оповещений, чтобы уведомлять пользователей о событиях на рынке. Особенности Поддерживает большинство алгоритм
Станьте Breaker Trader и получайте прибыль от изменений структуры рынка по мере изменения цены. Индикатор выключателя блока ордеров определяет, когда тренд или движение цены приближаются к истощению и готовы развернуться. Он предупреждает вас об изменениях в структуре рынка, которые обычно происходят, когда произойдет разворот или серьезный откат. Индикатор использует собственный расчет, который определяет прорывы и ценовой импульс. Каждый раз, когда новый максимум формируется около возможн
Ultimate Index Advisor — это продвинутый инструмент, предназначенный для точного анализа рыночных движений и динамического выявления торговых возможностей. Индикатор предлагает сигналы, основанные на комбинации стратегий, оптимизированных для трендов, коррекций и разворотов, что делает его универсальным для различных стилей торговли. С интуитивно понятным интерфейсом Ultimate Index Advisor выделяет четкие точки входа и выхода с помощью видимых стрелок на графике, устраняя двусмысленность в тор
Advanced Supply Demand
Bernhard Schweigert
4.91 (294)
Этот индикатор является уникальным, качественным и доступным инструментом для торговли, включающим в себя наши собственные разработки и новую формулу. В обновленной версии появилась возможность отображать зоны двух таймфреймов. Это означает, что вам будут доступны зоны не только на старшем ТФ, а сразу с двух таймфреймов - таймфрейма графика и старшего: отображение вложенных зон. Обновление обязательно понравится всем трейдерам, торгующим по зонам спроса и предложения. Важная информация Для мак
Панель предупреждений RSI / TDI позволяет вам одновременно отслеживать RSI (выбирается вами) по каждой основной паре, которой вы торгуете. Вы можете использовать его двумя способами: 1. Выберите несколько таймфреймов, и тире покажет вам, когда несколько таймфреймов выходят за рамки обычных торговых условий. Отличный индикатор того, что цена в последнее время сильно подросла, поскольку она достигла уровня перекупленности или перепроданности в нескольких временных рамках, поэтому вскоре ожи
Ultimate Dynamic Levels
Hispraise Chinedum Abraham
4.7 (10)
В настоящее время праздничная скидка составляет $399! Цены могут вырасти в будущем. Читайте описание ниже!   Представляем Ultimate Dynamic Levels - ЛУЧШИЙ индикатор входов для Ultimate Sniper Dashboard! Чрезвычайно низкий риск своевременных входов и высокий RR!!! Найдите Ultimate Sniper Dashboard ЗДЕСЬ. Самая важная способность как для начинающих, так и для профессиональных трейдеров - точно определить, где и когда рынок, скорее всего, развернется, и как безопасно войти в рынок и выйти из нег
Эта панель показывает последние доступные гармонические паттерны для выбранных символов, так что вы сэкономите время и будете более эффективны / MT5 версия . Бесплатный индикатор: Basic Harmonic Pattern Колонки индикатора Symbol: отображаются выбранные символы Trend : бычий или медвежий Pattern : тип паттерна (Гартли, бабочка, летучая мышь, краб, акула, шифр или ABCD) Entry : цена входа SL: цена стоп-лосса TP1: цена первого тейк-профита TP2: цена второго тейк-профита TP3: цена 3-го тейк-про
Gold Channel is a volatility-based indicator, developed with a specific timing algorithm for the XAUUSD pair, which consists of finding possible corrections in the market. This indicator shows two outer lines, an inner line (retracement line) and an arrow sign, where the theory of the channel is to help identify overbought and oversold conditions in the market. The market price will generally fall between the boundaries of the channel. If prices touch or move outside the channel it is a tra
TrendMaestro
Stefano Frisetti
5 (3)
note: this indicator is for METATRADER4, if you want the version for METATRADER5 this is the link:  https://www.mql5.com/it/market/product/108106 TRENDMAESTRO ver 2.4 TRENDMAESTRO recognizes a new TREND in the bud, he never makes mistakes. The certainty of identifying a new TREND is priceless. DESCRIPTION TRENDMAESTRO identifies a new TREND in the bud, this indicator examines the volatility, volumes and momentum to identify the moment in which there is an explosion of one or more of these data a
Этот индикатор разработан для интеграции с теорией Эллиотта и предоставляет два различных способа работы: Автоматический режим: В этом режиме индикатор работает автономно, обнаруживая все пять мотивационных волн на графике в соответствии с теорией Эллиотта. Он предсказывает и идентифицирует потенциальные зоны разворота. Кроме того, он способен генерировать предупреждения и уведомления для оповещения трейдеров о значимых событиях. Эта автоматизированная функциональность упрощает процесс идентифик
В НАСТОЯЩЕЕ ВРЕМЯ СКИДКА 20%! Лучшее решение для новичка или трейдера-эксперта! Этот индикатор специализирован для отображения силы валюты для любых символов, таких как экзотические пары, товары, индексы или фьючерсы. Впервые в своем роде, любой символ может быть добавлен в 9-ю строку, чтобы показать истинную силу валюты золота, серебра, нефти, DAX, US30, MXN, TRY, CNH и т.д. Это уникальный, высококачественный и доступный торговый инструмент, потому что мы включили в него ряд собственных функци
Enigmera
Ivan Stefanov
5 (3)
ЭНИГМЕРА: ядро рынка https://www.enigmera.com Введение Этот индикатор и торговая система представляют собой удивительный подход к финансовым рынкам. ENIGMERA использует фрактальные циклы для точного расчета уровней поддержки и сопротивления. Он показывает подлинную фазу накопления и дает направление и цели.  Система, которая работает независимо от того, находимся ли мы в тренде или в коррекции.  Как она работает? ENIGMERA состоит из трех линий: линии поддержки/сопротивления, линии цели и ли
Данный индикатор основан на математике великого трейдера W.D.Ganna.  С помощью его мы с легкостью найдете сильные уровни анализируя свинг для поиска оптимальной точки входа. Индикатор работает на всех инструментах и всех тайм фреймах. Индикатор полностью ручной и оснащен кнопками управления. Все что вам нужно это нажать на кнопку NEW, появится отрезок, данный отрезок вы размещаете на любое движение, свинг или даже 1 свечу, которую хотите проанализировать. Разместив отрезок нажимаете кнопку ОК. П
Симметричный треугольный паттерн представляет собой период сокращения и консолидации, прежде чем цена вынуждена совершить прорыв вверх или пробой. Пробой нижней линии тренда указывает на начало нового медвежьего тренда, а прорыв верхней линии тренда указывает на начало нового бычьего тренда. Получите приборную панель для одновременного мониторинга всех инструментов и таймфреймов, которыми вы торгуете, для паттернов симметричного треугольника! https://www.mql5.com/ru/market/product/69169/ Верс
Trade with Gann on your side!! MASTER CIRCLE 360 CIRCLE CHART, originally created by Gann admitted that this is “The Mother of all charts”. It is one of the last studies that this great trader left for us. The numeric tab le is apparently quite simple like all the tables and is based on square numbers, the SQUARE OF 12 and is by evolution, one of the most important square numbers. Here we can find CYCLE, PRICE AND TIME thanks to angles and grades, to show past and future support and resistance.
A top and bottom indicator that can intuitively identify the trend of the band. It is the best choice for manual trading, without redrawing or drifting. How to get this indicator for free: Learn more Price increase of $20 every 3 days, price increase process: 79--> 99 --> 119...... Up to a target price of $1000. For any novice and programming trading friend, you can write the signal into the EA to play freely. Array 3 and array 4, for example, 3>4 turns green, 3<4 turns red. If you don't underst
FX Dynamic - единственный индикатор ATR, который вам когда-либо понадобится Готовы ли вы к тому, чтобы сделать свои торговые стратегии непревзойденно точными и проницательными? Встречайте FX Dynamic - первый и единственный индикатор ATR, предназначенный для анализа валютных курсов и автоматической корректировки брокерских GMT-сдвигов . Попрощайтесь с устаревшими инструментами и примите самое лучшее решение для овладения волатильностью рынка. Почему FX Dynamic меняет правила игры Анализ ATR
Эта информационная панель представляет собой инструмент оповещения для использования с индикатором разворота структуры рынка. Его основная цель - предупредить вас о возможностях разворота на определенных временных рамках, а также о повторных проверках предупреждений (подтверждении), как это делает индикатор. Панель инструментов предназначена для самостоятельного размещения на графике и работы в фоновом режиме, чтобы отправлять вам оповещения о выбранных вами парах и таймфреймах. Он был разработ
Другие продукты этого автора
Trading the currency markets is a complex business, not least since we are dealing with pairs of currencies, and by inference, pairs of economies. All economies around the world are interlinked, and reflected in the constant ebb and flow of currency strength and weakness. The problem for us as traders is monitoring so many pairs simultaneously, since every pair does not move independently, but reflects the interrelated nature of this market. The Quantum Currency Heatmap delivers the informatio
Quantum Tick Volumes Indicator
QUANTUM TRADING SOFTWARE LIMITED
5 (1)
Многие Forex-трейдеры предполагают, что такого понятия как объем на валютном рынке не существует. И будут по-своему правы. Центральной биржевой площадки еще никто не создал. А даже если бы она и была, какие данные об объме она могла бы предоставить? Мы имеем дело с торговой активностью, которая выражается в тиковом объеме. Ведь в конечном итоге объем - это просто проявление активности покупателей и продавцов на рынке. То есть, для получения данных об объеме требуется анализ активности и наоборот
Валютные пары никогда не растут и не падают по прямой. Их подъемы и падения перемежаются откатами и разворотами. Каждый рост и каждое падение отражается и на вашем эмоциональном состоянии: надежда сменяется страхом, а когда он проходит, снова появляется надежда. Рынок использует ваш страх для того, чтобы не дать вам воспользоваться сильной позицией. В такие моменты вы наиболее уязвимы. Все изменится, если вы будете использовать индикатор Quantum Trend Monitor. Кроме того, в данном случае вы полу
Индикатор Quantum VPOC был разработан для расширения двумерного изучения объема и цены до трехмерного, включающего время. Соотношение объем/цена/время предоставляет реальное понимание внутренней работы рынка и сердцебиение настроения и риска, который соответственно движет ценовым действием. Индикатор Quantum VPOC отображает несколько ключевых элементов информации на графике следующим образом: Volume Profile - показывается в виде гистограммы по объему на вертикальной оси цены на правой стороне гр
Renko is a well-known Japanese charting technique that removes time from the chart. Instead of drawing bars in constant intervals (time) as a normal chart would, a Renko chart does so only when price moves beyond a predefined amount. In a Renko chart, a bar is created when price exceeds the previous bar’s high or low by a predefined amount or what we call the Box Size. The result is a chart with equally sized bars running up or down in 45 degree angles. Such a chart offers the following advant
Не хотелось бы констатировать очевидное, но американский доллар - это важнейшая валюта для трейдеров, и не только на рынке Forex. Без четкого представления о USD торговый процесс будет напоминать вождения автомобиля в условиях тумана. Когда произойдет авария - это лишь вопрос времени. Именно поэтому мы разработали два индекса USD. Первый называется Quantum DXY, а второй - Quantum USDX. В чем же их отличие? Толчком к созданию Quantum USDX послужил тот факт, что, по мнению многих Forex трейдеров,
Ваш успех как трейдера зависит от умения определять состояния перекупленности и перепроданности валюты или символа. То есть их силу или слабость. Именно этот подход и лежит в основе торговли на рынке Forex. Сделать это быстро и просто самому было бы практически невозможно, не будь индикатора Quantum Currency Strength - слишком много валют и символов. Вам определенно понадобится помощь! Индикатор Quantum Currency Strength был создан с единственной целью: дать вам глобальную картину по восьми осно
Quantum Trends Indicator
QUANTUM TRADING SOFTWARE LIMITED
1 (1)
Один из старейших принципов торговли гласит "сделай тренд своим другом". Наверняка, вам встречалось это выражение. Однако на деле не все так просто! Во-первых, тренд сначала нужно определить, а потом еще и постараться удержаться в нем, а это не легко. Более того, максимально увеличить свою прибыль за счет этого чрезвычайно трудно. И вообще, как определить начало тренда? Если оглянуться назад, то это не составит никакого труда. Но в условиях живого рынка сделать это будет уже не так просто. Индик
Quantum Dynamic Price Pivots Indicator
QUANTUM TRADING SOFTWARE LIMITED
1 (1)
Несмотря на то, что научиться интерпретировать свечной график может любой амбициозный трейдер на ценовом действии, на овладение этим навыком в совершенстве уйдут годы. Простым же смертным без помощи не обойтись. Вот где будет полезен индикатор Quantum Dynamic Price Pivots. Как ведущий индикатор, основанный исключительно на ценовом действии, он генерирует достаточное количество простых и ясных сигналов, с клинической эффективностью отмечая потенциальные точки разворота. Так же как объем и цена, п
Задумывались ли вы когда-нибудь, почему столько трейдеров остаются один на один со слабыми позициями не на той стороне рынка? Одна из причин этому - волатильность. Валютная пара неожиданно начинает движение на новостях или выходе экономических данных. Предвкушая быструю и легкую прибыль, на рынок сразу устремляются трейдеры. И вдруг цена разворачивается. Происходит это на всех таймфреймах и на всех символах. Закрытие свечи или бара с широким спредом сменяется резким разворотом цены, оставляя тре
Доллар США находится в центре всех финансовых рынков. Это основная резервная валюта и надежная гавань для инвестиций. В долларах США оцениваются все сырьевые товары. Более того, это валюта, цены на которую в самую первую очередь должен учитывать каждый трейдер! Знание ситуации по USD на валютном рынке имеет первостепенную важность при оценке рыночных настроений, рисков и денежных потоков в определенные рынки и инструменты. Зная, в каком направлении движется USD, все остальное - просто. Индикатор
Многие Forex трейдеры наслышаны и даже имели возможность убедиться на собственном горьком опыте в том, насколько опасной и нестабильной может быть торговля иеной. GBP/JPY - это, наверно, самая печально известная и непостоянная из всех пар. И неудивительно, что большинство трейдеров предпочитает не связываться с валютными парами, в состав которых входит иена. При этом они, скорее всего, не имеют четкого представления о направлении движения иены. Иначе торговля парами с иеной была бы более простой
Quantum Euro Index Indicator
QUANTUM TRADING SOFTWARE LIMITED
The Euro Currency Index or EURX , quantifies and displays strength and weakness of the single currency. As the index rises it signals strength in the single currency against a basket of currencies. As the index falls this signals weakness in the euro. The Quantum EURX is calculated from a basket of four currencies with each currency having an equal weighting of 25%. US Dollar Japanese Yen British Pound Australian Dollar The indicator can be used in one of three ways: First, to identify and con
This indicator has been developed to identify and display these trends quickly and easily, allowing you to see instantly, those currency pairs which are trending, and those which are not – and in all timeframes, with just one click. The 28 currency pairs are displayed as a fan as they sweep from strong to weak and back again, and this is why we call it the ‘currency array’. All 28 pairs are arrayed before you, giving an instant visual description of those pairs that are trending strongly, those
Trading the currency markets is a complex business, not least since we are dealing with pairs of currencies, and by inference, pairs of economies. All economies around the world are interlinked, and reflected in the constant ebb and flow of currency strength and weakness. The problem for us as traders is monitoring so many pairs simultaneously, since every pair does not move independently, but reflects the interrelated nature of this market. The Quantum Currency Heatmap delivers the informatio
The words powerful, unique and game changing are ones that are often over used when applied to trading indicators, but for the MT4/MT5 Quantum Camarilla levels indicator, they truly describe this new and exciting indicator completely. Why? Because the indicator has something to offer every trader, from the systematic to the discretionary and from swing trading to breakout trading. And it’s not an indicator which is simply used for entries. The Camarilla indicator delivers in all areas, from ge
The Quantum GBPX is the latest addition to our suite of currency indices, and one which we have been asked for many times, and even more so since Brexit. It is an index which has taken us some time to develop, and through a series of complex calculations draws its primary data from a basket of currencies based on the old style dollar index, the Dixie. This is converted to a chart for the British pound. The result is an accurate index which describes strength and weakness for the GBP currency in
The Market Strength Indicator (MSI) is yet another in our stable of volume-based indicators, and as such, is a must-have tool for trading virtually any type of market and across a myriad of applications from trend trading to swing trading, scalping, and much more. While its sister indicator, the Currency Strength Indicator (CSI), helps you analyze which currencies are oversold, overbought, correlating, and trending, the MSI or Market Strength Indicator does this also, but in this case, for all m
Quantum VRSI
QUANTUM TRADING SOFTWARE LIMITED
The VRSI indicator is another in the suite of volume indicators we have developed and one that complements our volume price analysis methodology perfectly. and was developed out of a desire to build further on our cornerstone of VPA by peeling back the layers of volume and considering the relative aspect of volume. Hence, the acronym of Volume Relative Strength Index indicator encapsulates what the indicator is all about. By analyzing relative volume, we are able to see a visual representation o
If there is only one MT5 indicator you ever buy for trading forex – this has to be it. Your success as a forex trader depends on being able to identify when a currency or currency pair is oversold or overbought. If it is strong or weak. It is this concept which lies at the heart of forex trading. Without the Quantum Currency Strength indicator, it is almost impossible. There are simply too many currencies and too many pairs to do this quickly and easily yourself. You need help! The Quantum C
The Euro Currency Index or EURX , quantifies and displays strength and weakness of the single currency. As the index rises it signals strength in the single currency against a basket of currencies. As the index falls this signals weakness in the euro. The Quantum EURX is calculated from a basket of four currencies with each currency having an equal weighting of 25%. US Dollar Japanese Yen British Pound Australian Dollar The indicator can be used in one of three ways: First, to identify and con
Have you ever wondered why so many Forex traders get trapped in weak positions on the wrong side of the market? One of the easiest ways the market makers do this, is by using volatility. A currency pair moves suddenly, often on a news release or economic data. Traders jump in, expecting some quick and easy profits, but the move suddenly moves in the opposite direction. This happens in all timeframes, and in all currency pairs. The candle or bar closes, with a wide spread, but then reverses sharp
If you've been trading for any time, you will almost certainly have come across the concept of support and resistance. This powerful and simple concept lies at the heart of technical analysis. It forms the cornerstone of price action trading. Strange to consider therefore, that such a key component of the traders chart has largely been ignored. Most Forex traders still draw their lines manually, leading to a crude interpretation of these key levels. Even those companies who have developed a trad
One of the oldest maxims in trading is ‘let the trend be your friend’. You must have come across it! This is easier said than done! First, you have to identify one, then you have to stay in – not easy. Staying in a trend to maximise your profits is extremely difficult. In addition, how do you know when a trend has started? It’s very easy to look back and identify the trend. Not so easy at the live edge of the market. The Quantum Trends indicator is the ‘sister’ indicator to the Quantum Trend Mon
Of all the four principle capital markets, the world of foreign exchange trading is the most complex and most difficult to master, unless of course you have the right tools! The reason for this complexity is not hard to understand. First currencies are traded in pairs. Each position is a judgment of the forces driving two independent markets. If the GBP/USD for example is bullish, is this being driven by strength in the pound, or weakness in the US dollar. Imagine if we had to do the same thing
We don’t want to become boring, but the US dollar is the most important currency for all traders, and not just in Forex. Trading without a clear view of the US dollar is like driving in fog. Sooner or later you are going to crash – it’s just a question of when. That’s why at Quantum we have developed two US dollar indices. The first is the Quantum DXY, and the second is the Quantum USDX. So what’s the difference? Well, the reason we created the Quantum USDX is that many Forex traders believe tha
Many Forex traders have either been told, or have learnt from painful experience, that the Yen currency pairs can be both dangerous and volatile to trade. The GBP/JPY is perhaps the most infamous and volatile of all. No wonder then, that many Forex traders simply stay away from the Yen currency pairs. But then they probably don’t have a very clear idea of where the Yen itself is heading. If they did, then trading the Yen pairs would be much more straightforward. And this is where the Quantum JPY
For aspiring price action traders, reading a candle chart at speed can be learnt, but is a skill which takes years to perfect. For lesser mortals, help is required, and this is where the Quantum Dynamic Price Pivots indicator steps in to help. As a leading indicator based purely on price action, the indicator delivers simple clear signals in abundance, highlighting potential reversals with clinical efficiency. Just like volume and price, pivots are another ‘predictive’ indicator, and a leading i
Фильтр:
Нет отзывов
Ответ на отзыв