Rolling STARR Ratio
- Индикаторы
- Carlos Gerardo Pauwells Escobar
- Версия: 1.0
- Активации: 5
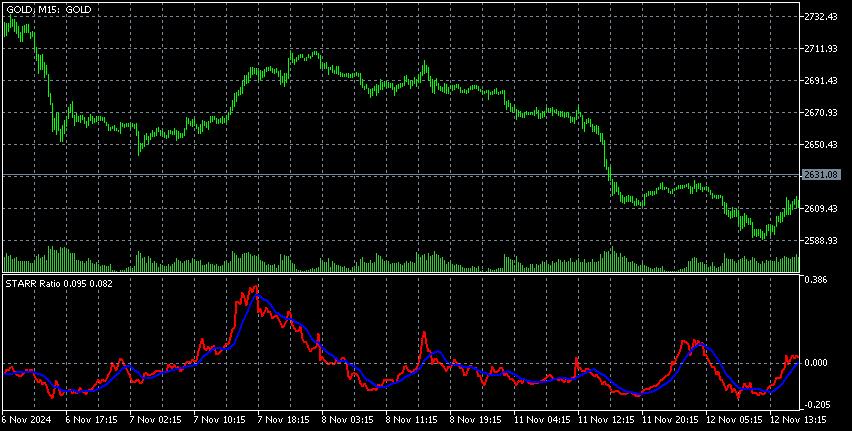
This indicator computes a rolling version of the STARR Ratio (Stable Tail Adjusted Return Ratio) over a specified number of bars and plots both the STARR Ratio and its Moving Average (MA). Unlike some original STARR Ratio implementations, this adaptation uses a rolling window of logarithmic returns and calculates Conditional Value-at-Risk (CVaR) at a given confidence level. By comparing the rolling average return to the magnitude of CVaR, it provides a metric for how returns stack up against worst-case losses over that window.
Features:
-
Logarithmic Returns (Rolling Window)
- The indicator calculates returns as the natural log of the ratio between successive closing prices ( MathLog(close[i]/close[i-1]) ).
- These returns are taken over a user-defined rolling window, ensuring that both the average return and CVaR calculations adapt over time.
-
Conditional Value-at-Risk (CVaR)
- CVaR estimates the average of the worst losses (or most negative returns) at a specified confidence level. For instance, at a 5% confidence level, CVaR is the average of the lowest 5% of returns within the rolling window.
- This captures tail risk more precisely than simpler measures like standard deviation.
-
STARR Ratio Calculation
- The STARR Ratio is obtained by dividing the average return by the absolute value of CVaR. A higher ratio indicates that average returns are larger relative to the tail risk.
-
Moving Average (MA) of STARR Ratio
- A simple moving average is calculated for the STARR Ratio over a separate period, smoothing short-term fluctuations and offering a clearer trend view.
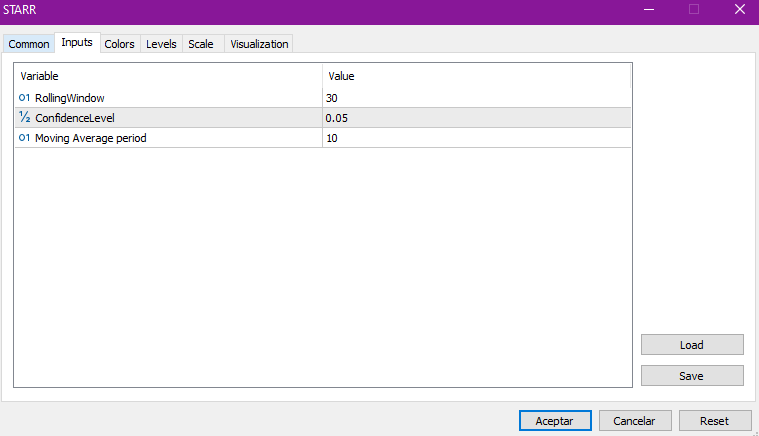
Parameters/Inputs:
-
RollingWindow
- Type: Integer
- Default: 30
- Specifies the number of bars used for both the average return and CVaR calculations. The indicator updates these values on a rolling basis, ensuring the ratio remains current as new price data arrives.
-
ConfidenceLevel
- Type: Double
- Default: 0.05
- Determines the portion of returns considered for the CVaR calculation. For example, 0.05 means the worst 5% of returns are used in computing CVaR, highlighting tail risk.
-
MA_Period
- Type: Integer
- Default: 10
- Sets the lookback period for the simple moving average of the STARR Ratio. Increasing this value further smooths the ratio, while a lower value makes it more responsive to recent changes.
NOTE:
- Rolling Approach: This version recalculates the ratio continually over the latest set of bars instead of a fixed or cumulative dataset.
- Use of Log Returns: The indicator uses logarithmic returns, which is not universal in all STARR Ratio implementations but is often favored for certain analytical benefits.
- On-Chart MA Calculation: It automatically includes an on-chart MA of the STARR Ratio, which may not be present in more basic STARR indicators.
By incorporating both tail-risk measurement (via CVaR) and average returns in a rolling fashion, this indicator aims to provide a more dynamic and timely assessment of risk-adjusted performance.