Time Range Analyzer
- Индикаторы
- Tevon R Gardiner
- Версия: 1.0
- Активации: 5
Main Functionality
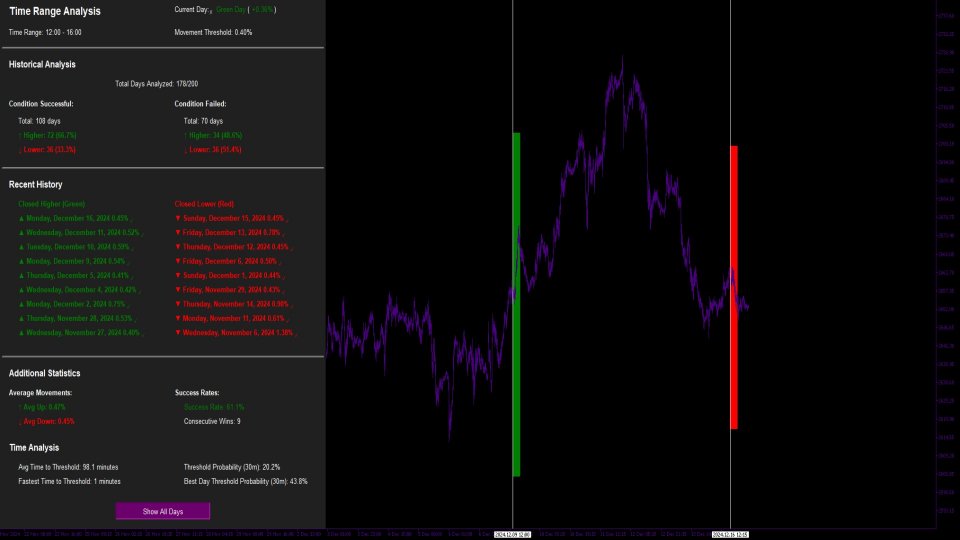
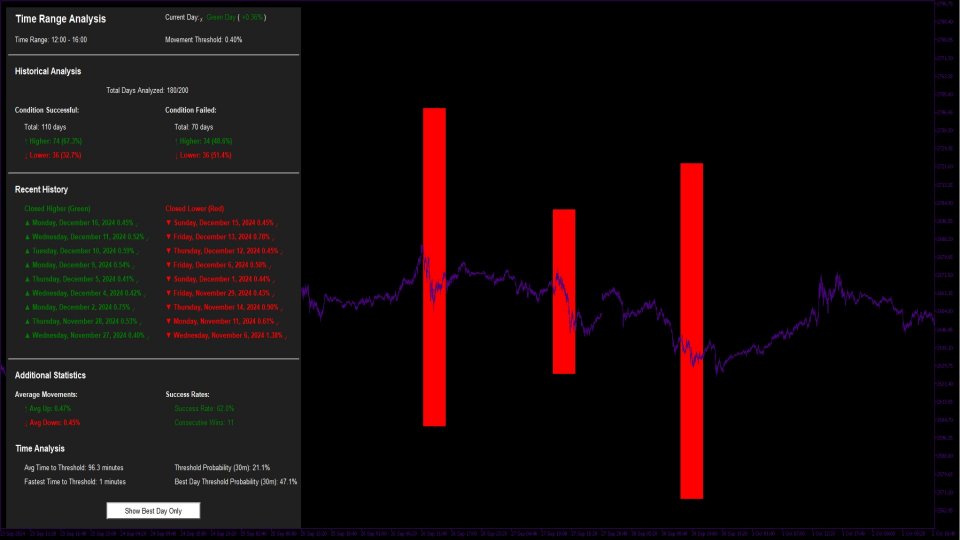
This indicator is designed to help traders pinpoint key moments during the trading day by focusing on specific time frames and significant price movements. Here's what it does:
- Highlight Key Time Periods: You can set a start and end time to track price action during specific hours. This makes it easy to see what’s happening when the market is most active for your trading strategy.
- Price Movement Threshold: With a built-in percentage threshold, the indicator spots and highlights periods where price movement exceeds a certain level, like 40% or more. This can help you identify periods of high volatility or notable market activity.
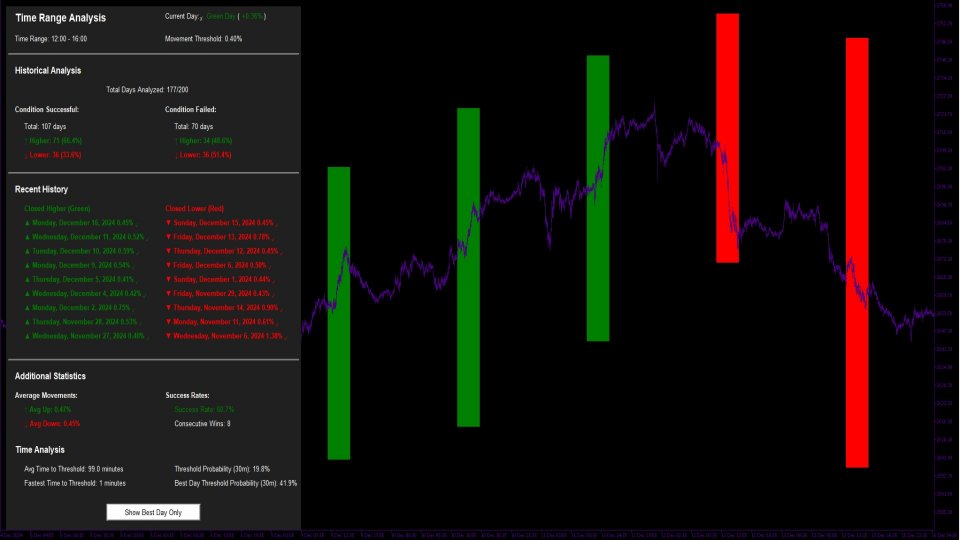
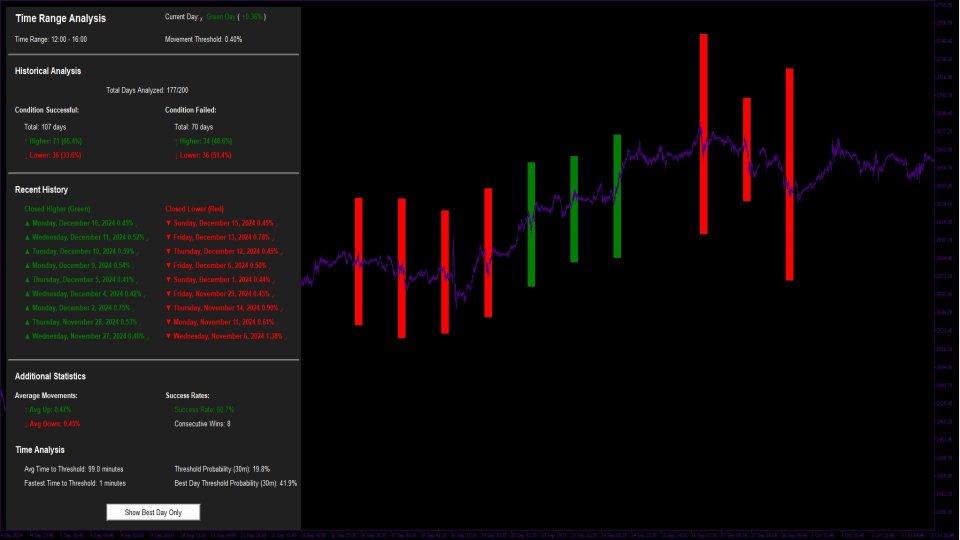
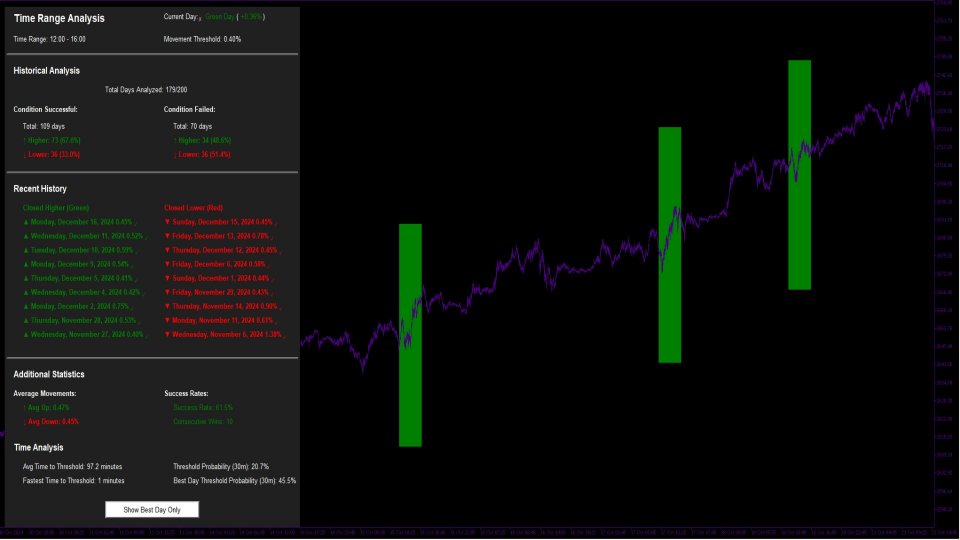
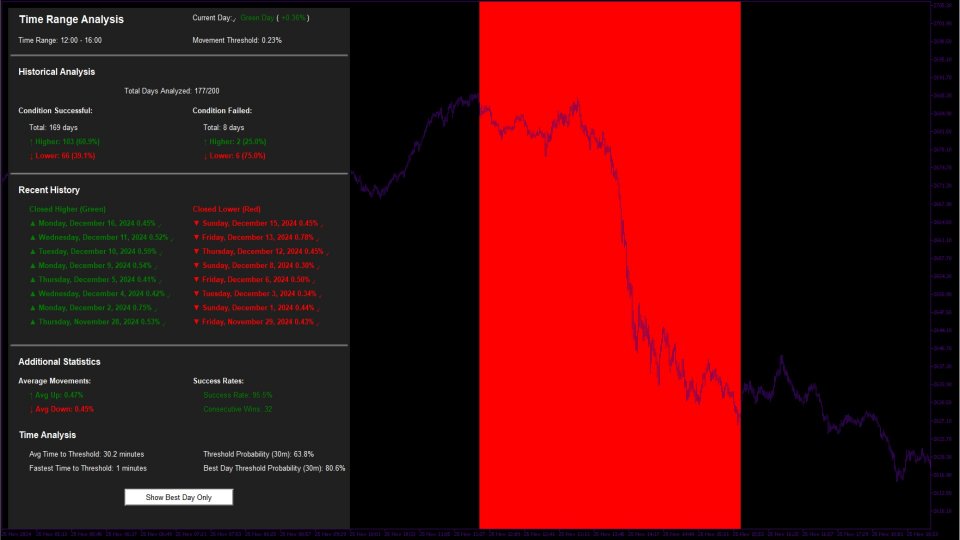
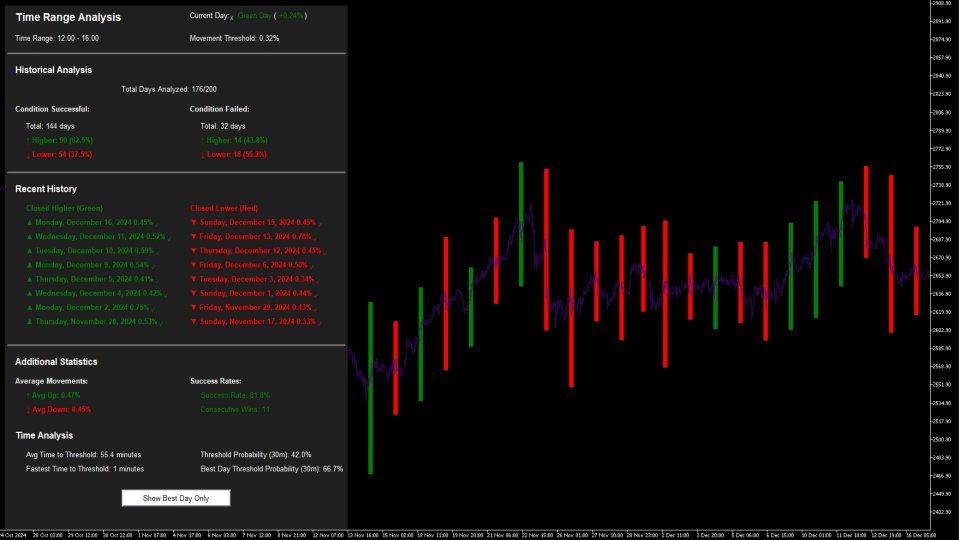
- Visual Cues: The indicator uses colored rectangles directly on your chart to highlight these moments, giving you a clear picture of when and where the action happened.
- Statistical Insights: It can also generate stats like the average time it takes for the price to hit specific thresholds. This data is invaluable for building a deeper understanding of market behavior and making smarter decisions.
Key Information Provided by the Panel
The indicator’s stats panel gives you a comprehensive view of market activity during your chosen time periods. Here’s what it offers and how it can benefit your trading:
-
Current Market Status:
Stay up-to-date with real-time insights into the market’s direction—whether prices are trending up or down. This keeps you grounded in the current state of play. -
Time Range Analysis:
Displays the exact time frame being analyzed, so you can stay laser-focused on the periods that align with your strategy. -
Movement Threshold Details:
Highlights the price movement threshold you’ve set, making it clear when the market action is significant enough to warrant attention. -
Historical Performance:
Gives you a snapshot of past market behavior, including how many days were analyzed and the success rate for price movements meeting your defined criteria. This data helps you assess how well the indicator aligns with your strategy. -
Condition Success Rates:
Tracks how often specific conditions are met—like prices closing higher or lower—so you can evaluate patterns and market tendencies. -
Average Price Movements:
Provides stats on average price changes during your selected time frames, helping you build a clearer picture of typical market behavior. -
Streak Tracking:
Monitors the number of consecutive successful trades or price movements, offering insights into the indicator’s reliability and the market’s consistency. -
Time Analysis:
Shows the average time it takes to reach key price thresholds, along with the fastest times recorded. This is great for understanding the speed of market reactions. -
Threshold Probability:
Calculates the likelihood of hitting your defined movement threshold within the chosen time frame, giving you an edge in assessing potential risks and opportunities. -
Best Day Insights:
Highlights the probability of reaching your threshold on the best-performing days, helping you pinpoint the most favorable trading conditions.
Why This Data Matters
This panel isn’t just about stats—it’s about turning raw numbers into actionable insights. By giving you a clear view of historical trends, probabilities, and market behavior, it helps you:
- Spot Opportunities Faster: Quickly identify when the market is moving in ways that align with your strategy.
- Improve Risk Management: Use probabilities and historical success rates to make more informed decisions.
- Refine Your Strategy: Leverage insights into average movements and time analysis to fine-tune your approach and better understand the rhythm of the markets.

