• Обзор
  • Отзывы
  • Обсуждение

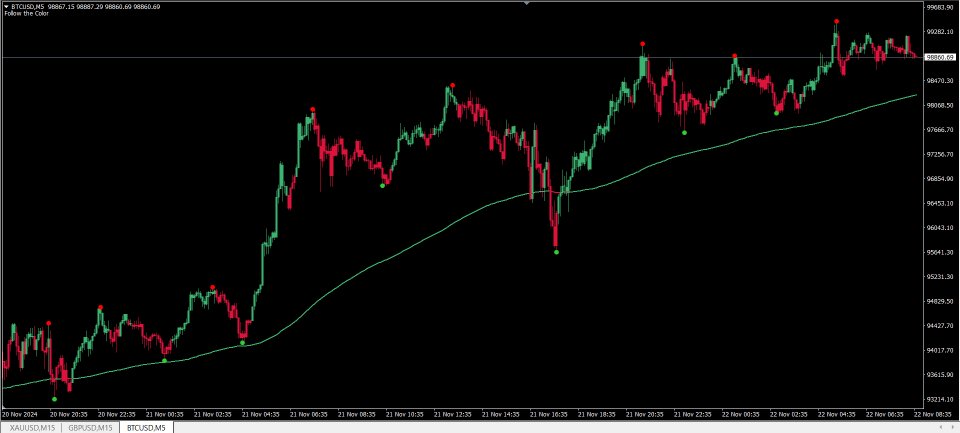
Follow the Color

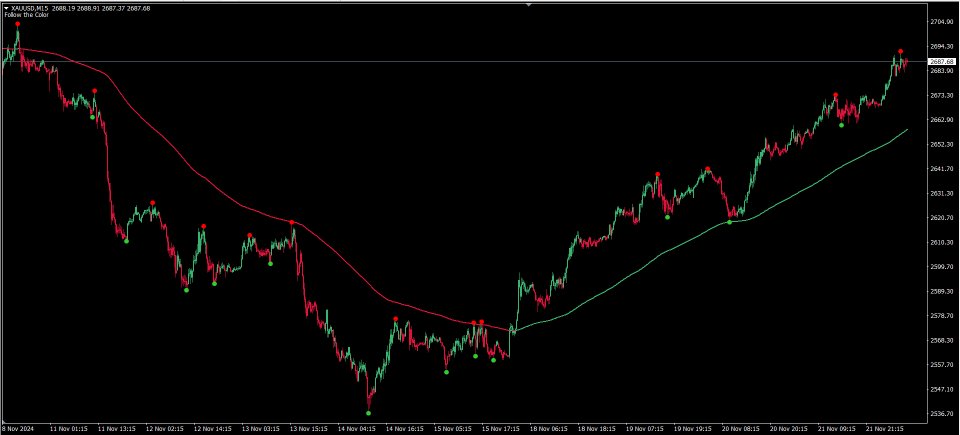
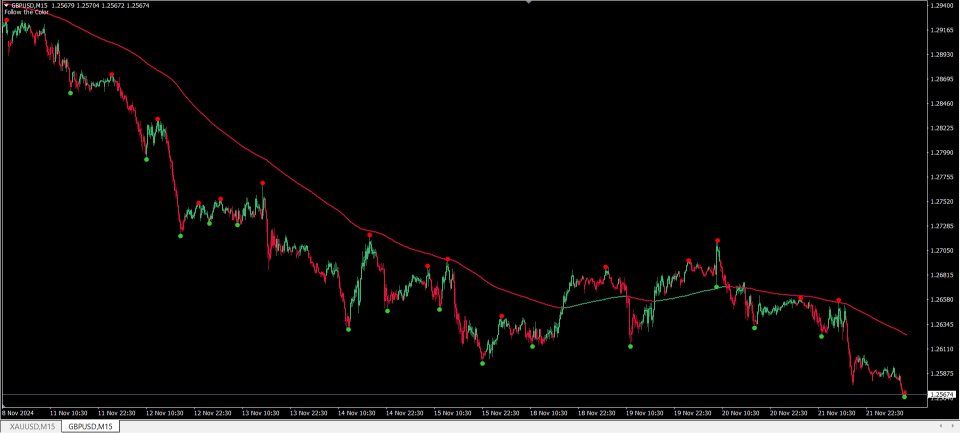
The indicator consist of a moving average, color candles and zigzag dots


The candles and moving average is non repaint but the zigzag dots repaint


The idea is to trade in the direction of the trend


Bullish signal - 1. Price above moving average

                       2. Green dot appeared below red candle

                       3. Enter after first green candle


Bearish signal - 1. Price below moving average

                       2. Red dot appeared above green candle

                       3. Enter after first red candle


Settings can be changed as preferred


Suitable for any symbol


Timeframe any with correct settings


Default - 5m to 15m


Please test before purchase

--------------------------------------------------------------------------------


Другие продукты этого автора
Pullback Arrows
Pieter Gerhardus Van Zyl
Индикатор предоставляет стрелки покупки и продажи со скользящей средней и цветом бара на основе EMA. Над скользящей средней показаны только стрелки покупки, а ниже скользящей средней показаны только стрелки продажи. Стрелки основаны на алгоритме разворота и, следовательно, пытаются найти точки отката. Оповещения можно активировать по желанию Подходит для любого таймфрейма и инструмента по выбору. Пожалуйста, протестируйте в демо-версии перед покупкой Насл
The Hill
Pieter Gerhardus Van Zyl
The indicator is a histogram for scalping the lower timeframes  When the hill behind appears go short and when it disappears go long  The indicator has only sound alerts  The colors can be adjusted as preferred  Suitable for lower timeframes - 1 - 5 minutes Test in demo before purchase Enjoy -----------------------------------------------------------------------
Boeta Rsi Histo
Pieter Gerhardus Van Zyl
The indicator is a double Rsi based histogram. The coloring can repaint one bar backwards because of smoothing but still gives early signals Check out my indicator - Pullback Arrows -  https://www.mql5.com/en/market/product/123506 The values and colors can be changed as preferred. Green bullish and red bearish Symbol: Any Timeframe: Any Enjoy! -----------
FREE
Arrow X
Pieter Gerhardus Van Zyl
Индикатор стрелки без перерисовки для помощи при вводе данных. Лучшие сигналы подаются на трендовых рынках. Подождите, пока текущий бар закроется, чтобы зафиксировать стрелку на месте. Просто загрузите график без каких-либо настроек, которые могли бы запутаться. Цвет и размер стрелки можно регулировать. Индикатор можно использовать с любой парой и любым таймфреймом – Форекс, криптовалюта..... Лучше торговать с трендом большего таймфрейма. -------------------------------------------------- ------
Boeta Rsi
Pieter Gerhardus Van Zyl
The indicator is a double Rsi based oscillator with color change.  The coloring sometimes repaints because of smoothing. Check out my indicator - Pullback Arrows -  https://www.mql5.com/en/market/product/123506 The values and colors can be changed as preferred. The fast line gives earlier signals but if you want confirmation wait for the cross or slow line to change color also. Buy when lines is closer to the 20 line and sell closer to the 80 line. Symbol: Any Timeframe: Any Enjo
FREE
MA with Arrow
Pieter Gerhardus Van Zyl
The indicator provides a moving average with buy and sell arrows Only buy arrows are shown above the moving average and only sell arrows are shown below the moving average Added a Rsi filter to reduce arrows The moving average can be adjusted as preferred - Default is 200 EMA The arrows is non repaint after close of candle to lock it in place The arrows also has alerts if needed Suitable to any timeframe or instrument of choice Test in demo before purchase Enjoy
Tjomma T3 Rsi
Pieter Gerhardus Van Zyl
The indicator is a T3 and Rsi based oscillator with color change.  The indicator repaints. Check out my indicator - Pullback Arrows -  https://www.mql5.com/en/market/product/123506 The values and colors can be changed as preferred. Please play around with the settings to get better signals. The fast line gives earlier signals but if you want confirmation wait for the cross or slow line to change color also. Buy when lines is closer to the 20 line and sell closer to the 80 line. Sym
FREE
Gold Key Levels
Pieter Gerhardus Van Zyl
The indicator reveals key levels for gold. The levels can be used for support and resistance, breakout, break and retest or most strategies. The major levels can be used for intraday trades from one level to the next or reversals. The mini levels can be used to scalp lower timeframes.  The color, line style and thickness can be adjusted as preferred. Symbol: XAUUSD Timeframe: Major levels - M30 - H4                   Mini Levels M15 - M1 The levels may enhance your current setup.
The indicator is a simple bar oscillator with green and red bars The calculation of the bars are Rsi based The values of the bars does not recalculate after bar has closed Higher green bars shows possible bullish momentum and vice versa The indicator has no settings or alerts  The colors can be adjusted as preferred but the bar width should remain on default  Suitable for any timeframe or instrument Test in demo before purchase Enjoy ----------------------------------------------
Crazy Arrows
Pieter Gerhardus Van Zyl
The indicator provides arrows and 2 moving averages The arrows is based on T3 and only shows bullish arrows above both moving averages and vice versa  - Where candle closes The moving average shows color change based on slope I didn't add alert because to many arrows Suitable for any timeframe and symbol Please test extensively in tester before purchase! Enjoy! ----------------------
The indicator is an ATR band with 2 types of arrows and a moving average Bullish arrows are only shown above the moving average and bearish arrows are only shown below the moving average The best conditions for this indicator is a trending market Usable on any timeframe and symbol Alerts for the arrows also available  Please test in tester before purchase  ----------------------------------------------------------------------
Simple T3
Pieter Gerhardus Van Zyl
The indicator is a very simple oscillator based on T3 Green and red bars shows bullish or bearish direction  Also above and below the zero line can show sentiment The T3 value and price can be adjusted according to your trading style The colors can also be changed as preferred Please test in tester before purchase Enjoy!!! ---------------------------------
Фильтр:
Нет отзывов
Ответ на отзыв