Linear Regression Channel with signal MT4
- Индикаторы
- Minh Truong Pham
- Версия: 1.0
- Активации: 5
Overview:
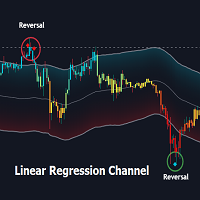
The Linear Regression Channel Indicator is a versatile tool designed for Metatrader to help traders visualize price trends and potential reversal points. By calculating and plotting linear regression channels, bands, and future projections, this indicator provides comprehensive insights into market dynamics. It can highlight overbought and oversold conditions, identify trend direction, and offer visual cues for future price movements.
Key Features:
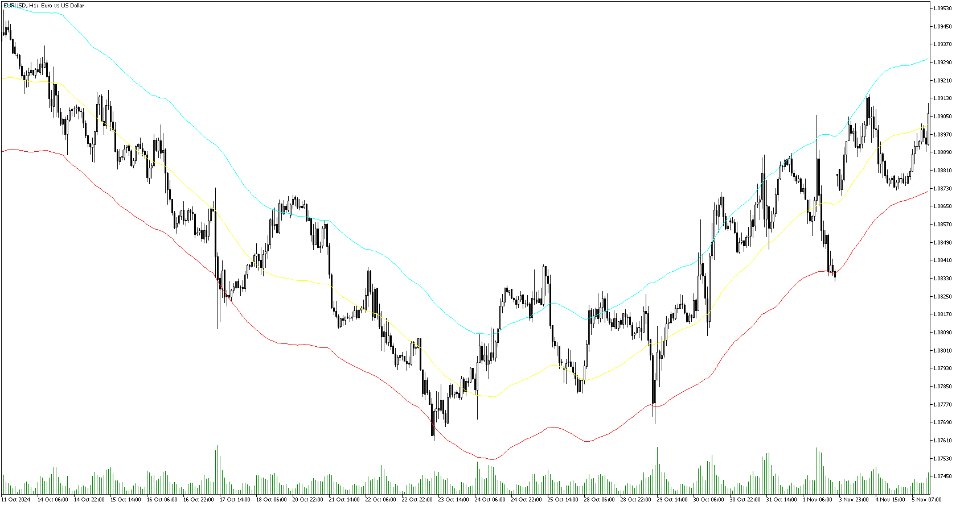
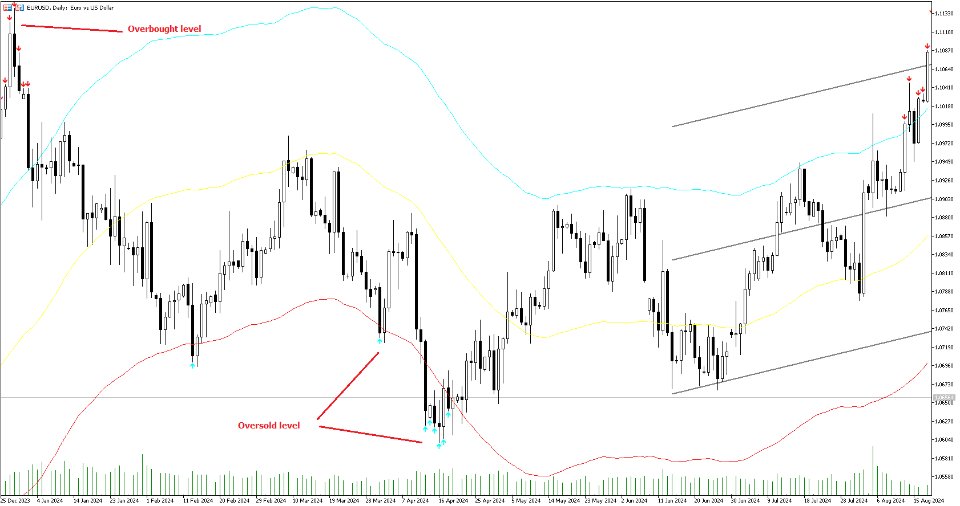
Linear Regression Bands: ( figure 1)
- Input: Plot Linear Regression Bands
- Description: Draws bands based on linear regression calculations, representing overbought and oversold levels.
- Customizable Parameters:
- Length: Defines the look-back period for the regression calculation.
- Deviation: Determines the width of the bands based on standard deviations.
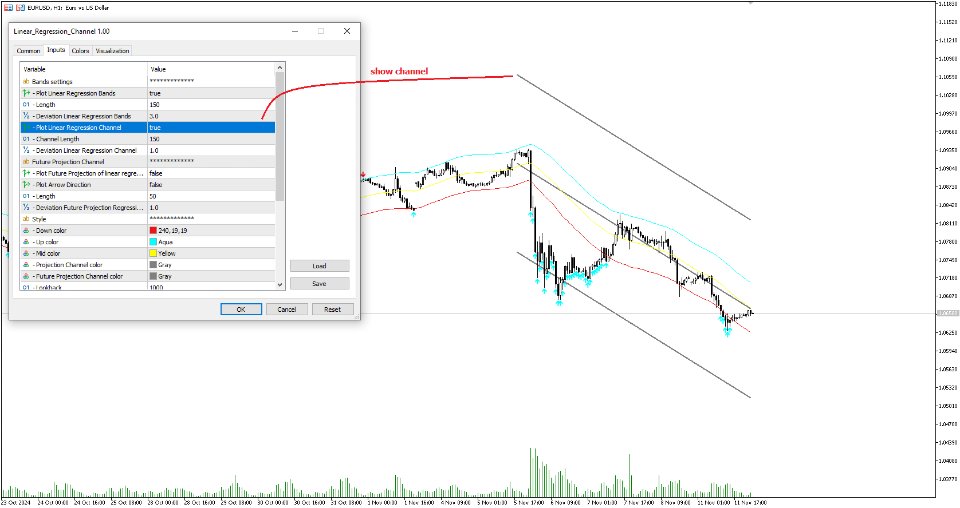
- Input: Plot Linear Regression Channel
- Description: Plots a channel using linear regression to visualize the main trend.
- Customizable Parameters:
- Channel Length: Defines the look-back period for the channel calculation.
- Deviation: Determines the channel's width.
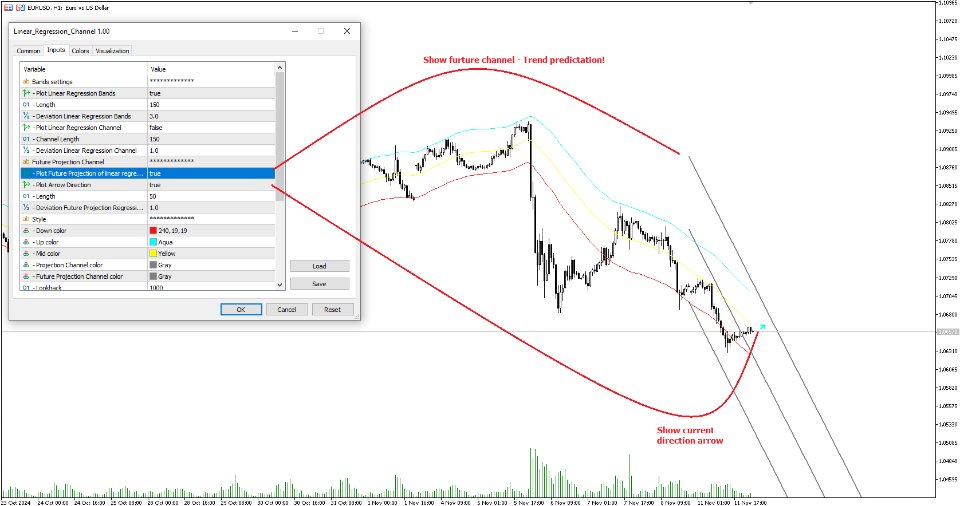
Future Projection Channel: (figure 3)
- Input: Plot Future Projection of Linear Regression
- Description: Projects a linear regression channel into the future, aiding in forecasting potential price movements.
- Customizable Parameters:
- Length: Defines the look-back period for the projection calculation.
- Deviation: Determines the width of the projected channel.
- Input: Plot Arrow Direction
- Description: Displays directional arrows based on future projection, indicating expected price movement direction.
- Input: Show band and channel
- Description: Displays oversold, overbought arrows at candler which closed outside bands. Trader may consider to buy/sell here, but need to confirm with other indicator, for example RSI ...
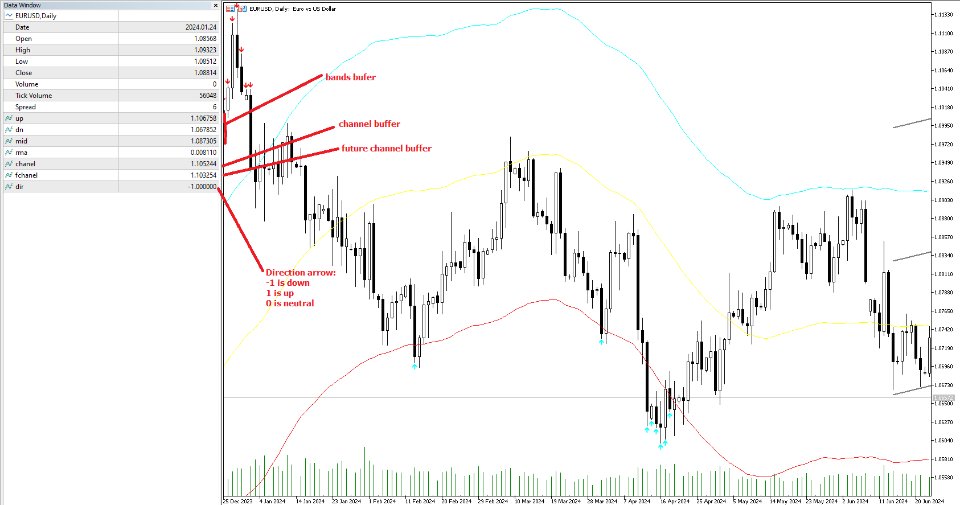
Buffer for easy to create EA: (figure 5)
- All calculated - element is avaiable at buffer.
