Mafaranga
- Индикаторы
- Phillimon Shumbusho
- Версия: 1.0
- Активации: 5
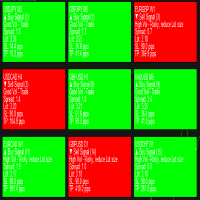
The real market buy/Sell signals, you can trust.
This indicator tracks the trend strength, the market strength, the real current volume, and the price direction to give traders and investors the optimum point for entry in the form of signals.
The time frames range from 5 minutes to one (1) hour chart.
Trading on higher time frames produce the best outcomes, but also do produce less frequent trades, compared to trading on lower time frames.














Пользователь не оставил комментарий к оценке
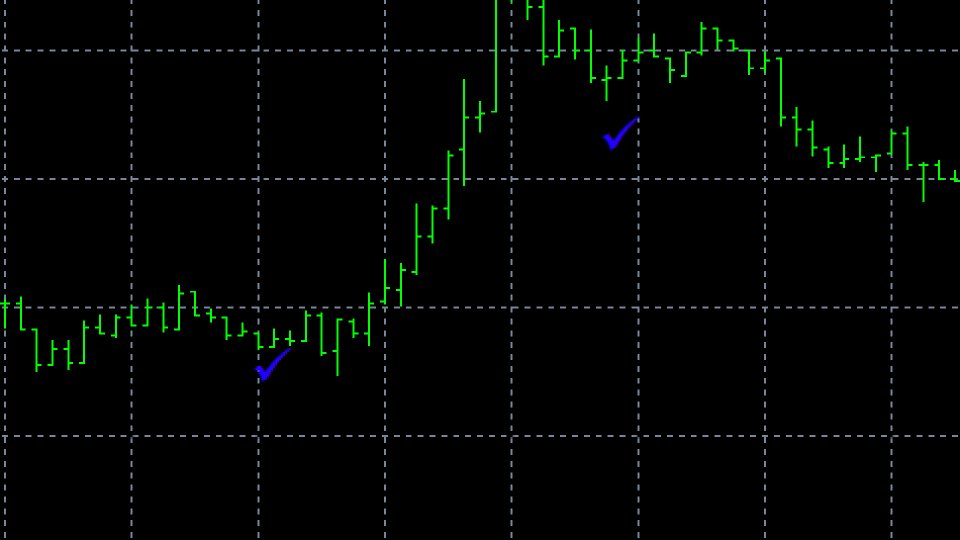
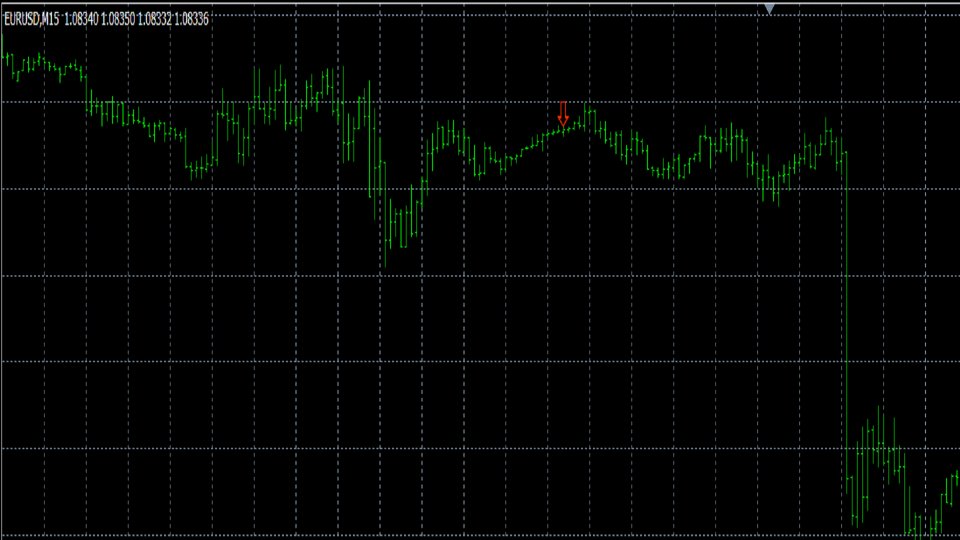
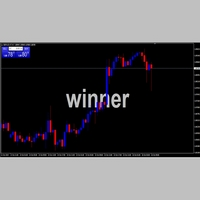
This indicator is only available as premium for buy or rent on MT4. Buy when the signal appears and the Relative Vigor Index (RVGI-10) is below or between the 20 and 30 marks of the MFI bottom lines, and MFI itself is near or below the Zero (0) mark line. Sell when the signal appears and the Relative Vigor Index (RVGI-10) is above or between the 80 and 70 marks of the MFI bottom lines, and MFI itself is near or above the Fifty (50) mark line. The best recommended time frame is 5 minutes for scalpers, and this works well on all major pairs, but if you want to see the effectiveness of it, then try it on XRP/USD. This one alone can be a very good experience for you, as a scalper. SL below the check mark signal (for a buy order) or above the down arrow (for a sell order). and take profit on the next fractal high for a buy order or the next fractal low for a sell order on the 5 minutes chart. However, a higher time frame like one hour is better than 5 minutes time frame in terms of the setup above, but the signal for a trade may not appear for a period of time as this indicator does the analysis for you and only appears if it is the perfect time for trading. Remember: For as far as a high timeframe is concerned, patience plays a major key role here. In other words, with patience, you could wait for the best trade opportunity to come and celebrate with joy. Notes: To have these lines together in one window, you must put those two indicators in one single window just below the main chart.
First add MFI or RVGI from the top Menu (left) in MT4. Step 1: First, Click on Insert
Second, click on Indicators
And third, click on MFI or RVGI, and leave it with its default settings. Step 2: Navigate to the Navigator (left pane just below the Market Watch) and click on the + sign preceding the indicators drop down menu to expand it, then click on the Volume section of the indicators for MFI or on the Oscillators for the RVGI, and then drag the second indicator to the window containing the first indicator, just below the main chart. Doing so will have both indicators, the Money Flow Index and Relative Vigor Index to be placed in one single window
instead of having them in separate windows. And you can use that method to combine as many indicators in one window as you want. I hope that this helps you. And I look forwards to more positive comments as you discover more and more benefits of using this wonderful indicator. Thank you, Phillimon Shumbusho, the Master of Information Technology,
and the Software Engineer.