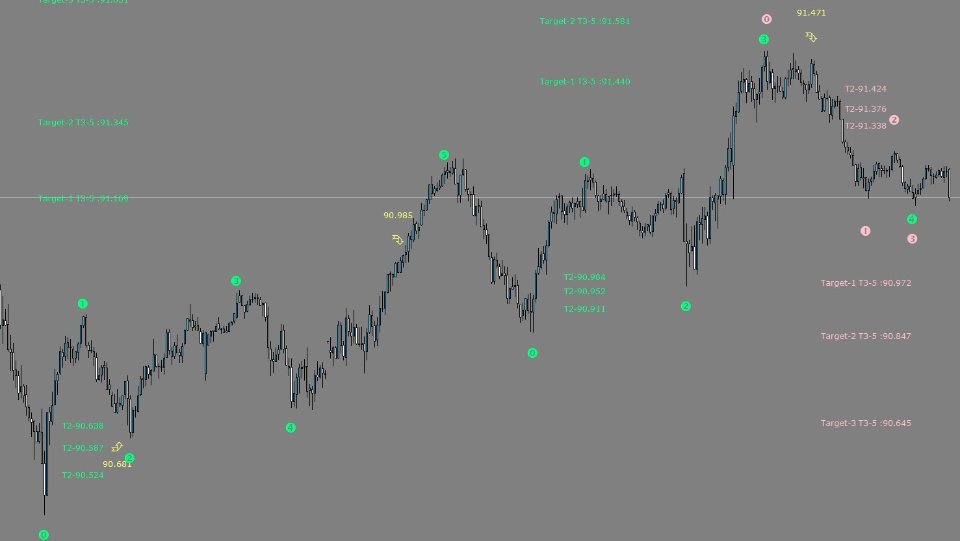
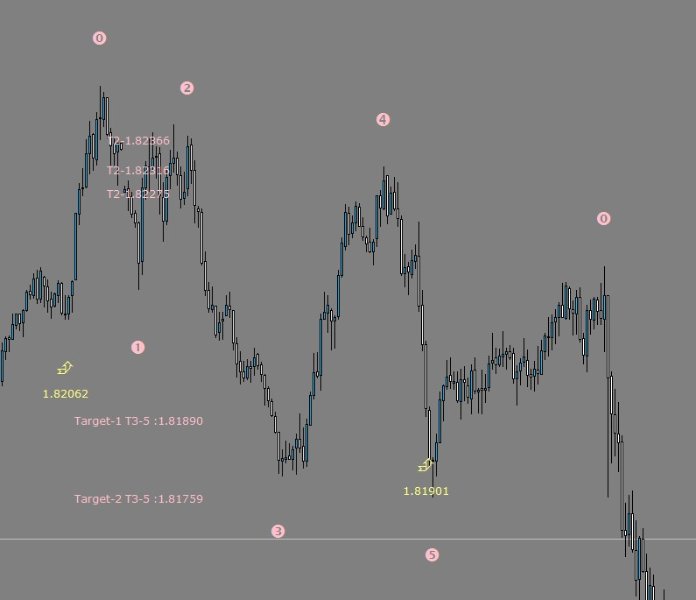
Elliot Trend with Signals
- Индикаторы
- Ersin Oelmez
- Версия: 1.0
- Активации: 5
What is Elliott Wave analysis all about?
You probably heard something about Elliott waves or even seen wave counts. That's because nowadays Elliott wave analysis becomes one of the most popular approaches of the Forex market forecasting. Why? Elliott Wave Principle is the only tool in our experience, which can sort out the price movement on every timeframe from the Monthly or even Yearly chars to just one-minute intraday intervals. The Elliott Wave Theory is a technical analysis concept used to forecast financial market trends, particularly in the stock market. Elliot Wave Theory is a technical analysis approach that suggests that financial markets, such as stocks or currencies, move in a series of predictable and repetitive waves. These waves reflect the natural behavior of market participants, who alternate between optimism and pessimism as they react to various economic and financial events.
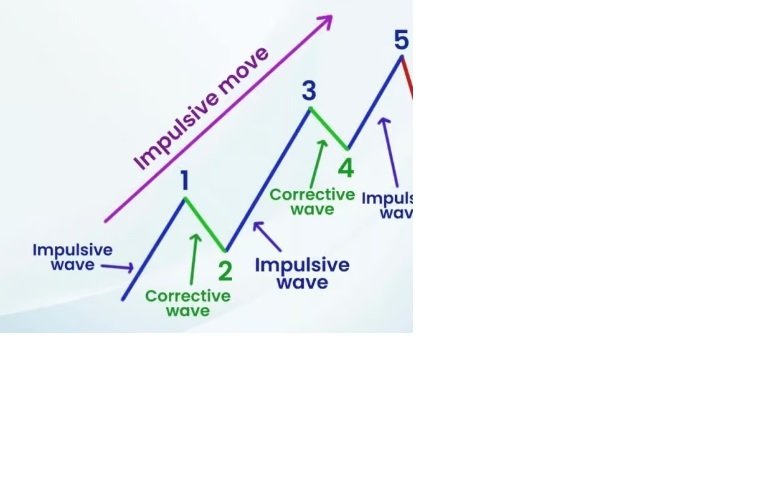
What are the Five Wave Patterns (Motive) of Elliott Wave Theory?
- Wave 1
Wave 1 begins the accumulation phase and the formation of the five-wave pattern. Wave 1 can be difficult to identify as it often looks as a short pullback against the previous trend. Compared to other waves, Wave 1 is highly uncertain. This is why traders confirm the establishment of Wave1 after the formation of Wave 2.
- Wave 2
Wave 2 marks the bottom of a five-wave structure. Wave 2 is comparatively shorter than Wave 1 as it must not go below the bottom of it. The pattern is considered as flawed if Wave 2 breaks below Wave 1. Wave 2 is a retracement of Wave 1. It goes against the direction of Wave 1.
- Wave 3
Wave 3 is the longest and strongest wave in a five-wave structure. Wave 3 is an extension of Wave 1. Traders often try to catch this wave as it offers an explosive price move. This wave represents the confidence of market participants in the newly established trend. Compared to other waves, Wave 3 is easy to spot because of its length.
- Wave 4
Wave 4 is the final retracement of a five-way structure. Wave 4 is comparatively weaker than Wave 2. This is why, Wave 3 and Wave 4 together often look like a wage or a flag and pole chart pattern. On the other hand, if Wave 4 goes below the bottom of Wave 3, then the five-wave pattern is considered as flawed.
- Wave 5
Wave 5 is the final wave of a five-wave structure. Wave 5 marks the end of the newly established trend and indicates that a correction is pending in the market. This wave is typically the weakest wave in a five-wave structure. Generally, traders and investors start booking their profits as the Wave 5 is the final impulse move of the existing trend.
This Indicator is also special developed with each wave you get an Signal on you're Phone, so in this case you don't need to watch 24/5 on you're Screen, when the big Movements happens. You can trade before the Movements happens

