Titan Gravity
- Индикаторы
- Marco De Donno
- Версия: 1.0
- Активации: 5
Have you ever wondered why most systems are not effective in live trading?
My answer is that it's all the fault of the so-called "Smart Money" or the institutional ones,, they constantly create spikes first up then down and vice versa to screw all the retail investors by tearing away their capital, confusing them and making the markets move randomly without any rules.
But in all this there is a famous strategy, which in 2009 won the world championship, exploiting and rowing against the institutions, I'm talking about Belkhayate's COG strategy.
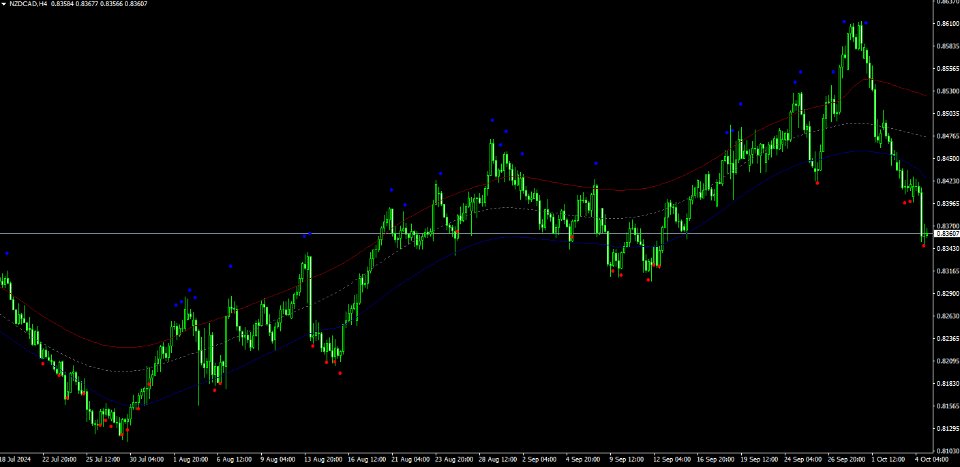
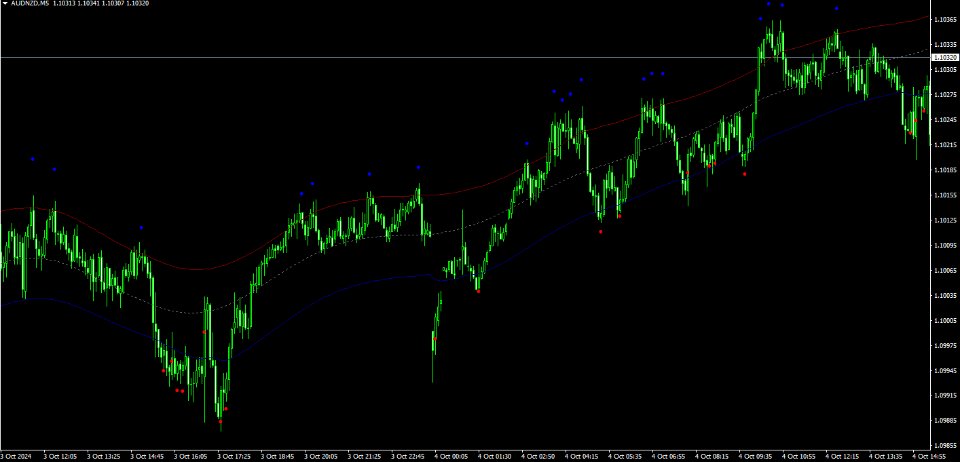
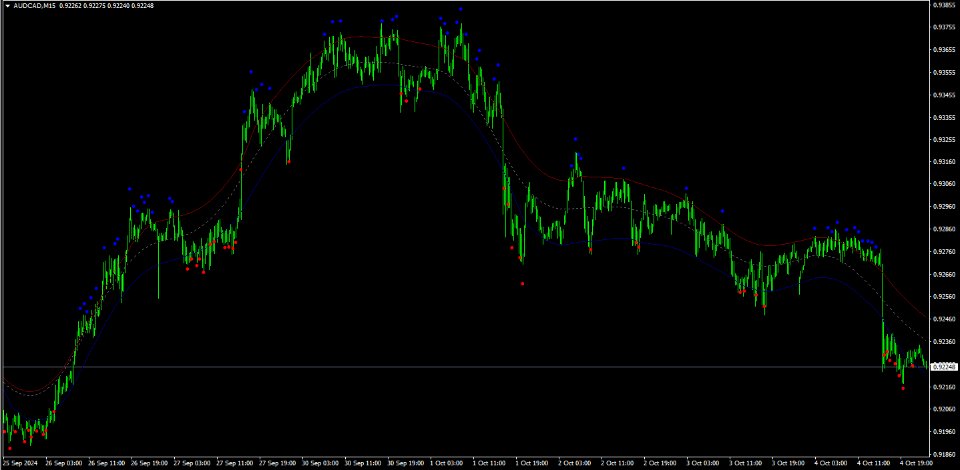
The strategy is based on the premise that the market prices evolve around a "centre of gravity". When the market price deviates strongly from this centre of gravity the probability is considered high that the market price will evolve back towards the centre of gravity, A position is opened when the real market price deviates significantly from the center of gravity of the market price, the indicator calculates the center of gravity based on the price movement and displays it as a single center line.
When the market price enters the Red or Blue Band, it is considered as a significant deviation from the center of gravity. So the probability that the market price will evolve back towards the center of gravity is 90%. When the market price deviates into the upper, red band, the trader opens a short position because the market is expected to fall, towards the gravity line. When the market price deviates into the lower, blue band, the trader opens a long position because the market is expected to rise, towards the gravity line.
This strategy does not use Stop Loss...what??? Yes you understood very well, we will use the same technique that the institutions use to go against them and, the more they try to scare us, the more we will open other operations.
Buy signal setup: when the price breaks the blue line and the red dot appears, at the close of the candle (only when the candle closes because it could be a false signal and the dot disappear while the candle is still open) we will open a buy, if the price continues to fall and another red dot appears at the close of the candle then we will open another position and so on, until the price reverses and it will do so and, it will touch the red band where we will close all positions.
Sell signal setup: when the price breaks the red line and the blue dot appears, at the close of the candle (only when the candle closes because it could be a false signal and the dot disappear while the candle is still open) we will open a sell, if the price continues to rise and another blue dot appears at the close of the candle then we will open another position and so on, until the price reverses and it will do so and, it will touch the blue band where we will close all positions.
- Favorite Pairs: AUDCAD, AUDNZD, and NZDCAD ( Not absolutly Xauusd and Crypto)
- Time Frames: M5/M15/M30/H1/H4 (preferably High Timeframe)
- Account Types: Any ECN account, low spread account
- Minimum capital: 500$ for 0.01 lot very Low Risk


Пользователь не оставил комментарий к оценке