Abiroid 3MA Cross Scanner
- Индикаторы
- Abir Pathak
- Версия: 1.2
- Активации: 20
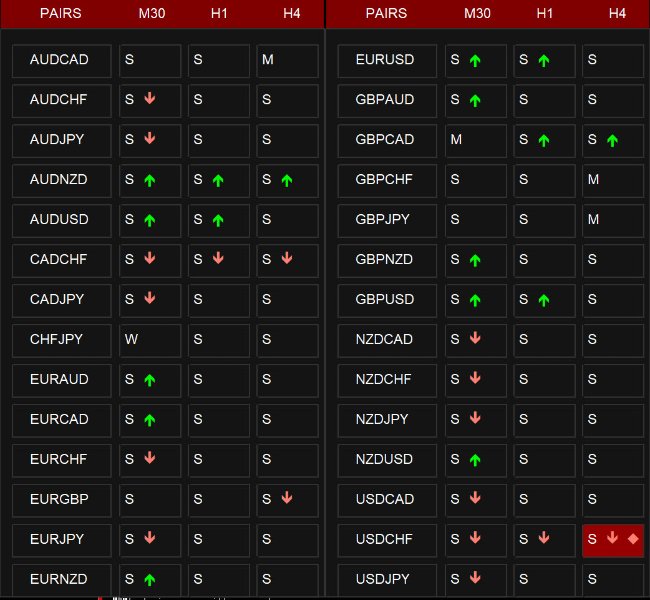
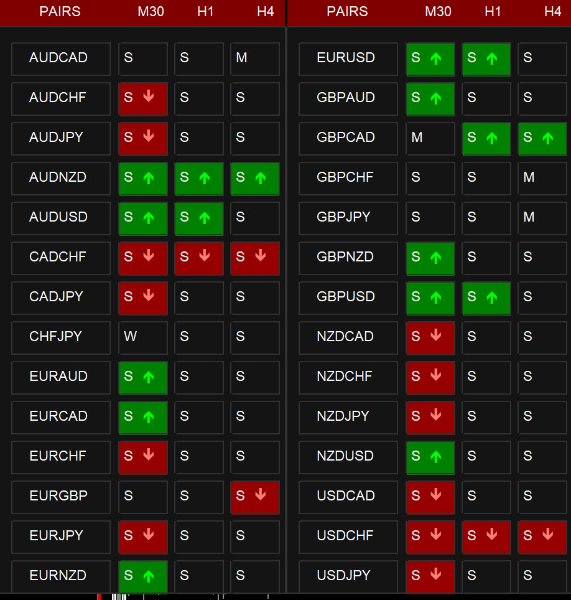
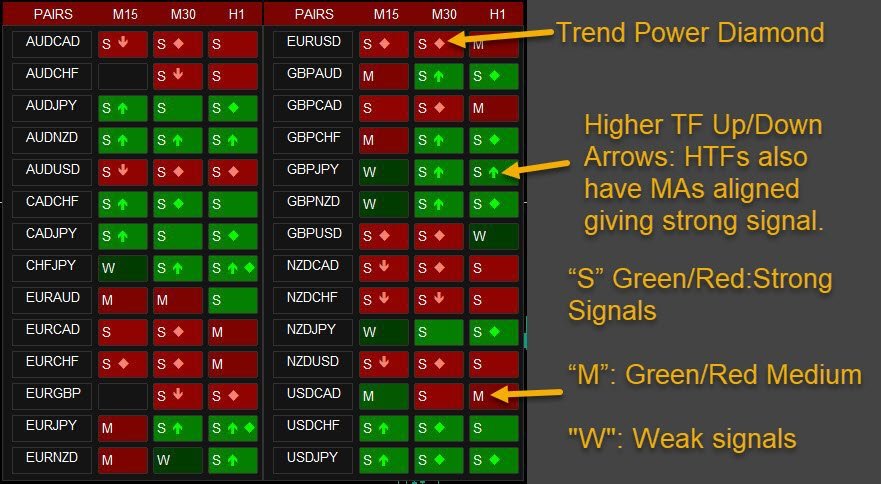
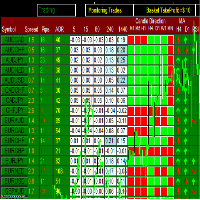
This dashboard shows you the 3MA Cross Overs current status for Multi-currency multi-timeframes. Works for Metatrader 4 (MT4) platform.
Detailed Post:
https://www.mql5.com/en/blogs/post/759238
How it Works:
MA Cross Signals
It will show “S” Green/Red Strong Signals and “M” or “W” Green/Red Medium or Weak signals.
We have 3 types of MA: Faster, Medium and Slower MA.
A strong signal is when FasterMA and MediumMA are both above/below SlowerMA.
A medium signal is when only FasterMA is above/below SlowerMA. MediumMA has still not crossed it.
A weak signal is when FasterMA has only crossed MediumMA but not yet SlowerMA.
Higher TF Up/Down Arrows:
If higher timeframe align option is true, it will check if given number of higher timeframes also have MAs aligned giving strong signal.
Trend Power Diamond:
If Trend Power Check is true, it will use trend_power indicator to check trend power and if trend is strong, give a red/green diamond.
Settings:
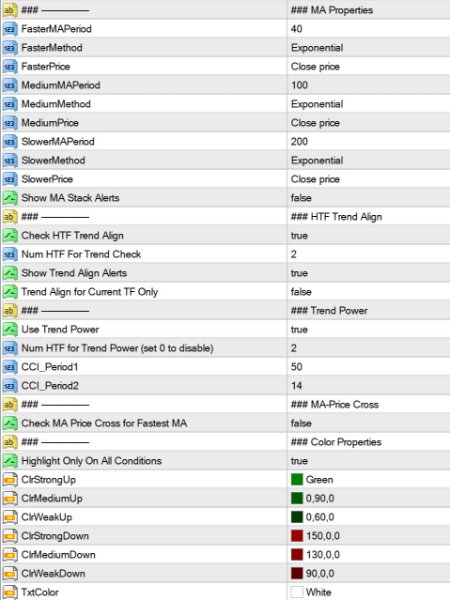
You can read details about Dashboard settings here:
https://www.mql5.com/en/blogs/post/747456
Trend Align for Current TF Only:If true and suppose main chart is M15, it will only check higher timeframes aligned with M15.
If false, it will check higher timeframe trends aligned with all timeframes you selected in the dash.
How to Use:
- When fastest MA crosses medium and slow MA.
- And 2 higher timeframes also have trend alignment (fastest MA there is also above medium and slow MA).
- And Trend Power shows a high trend
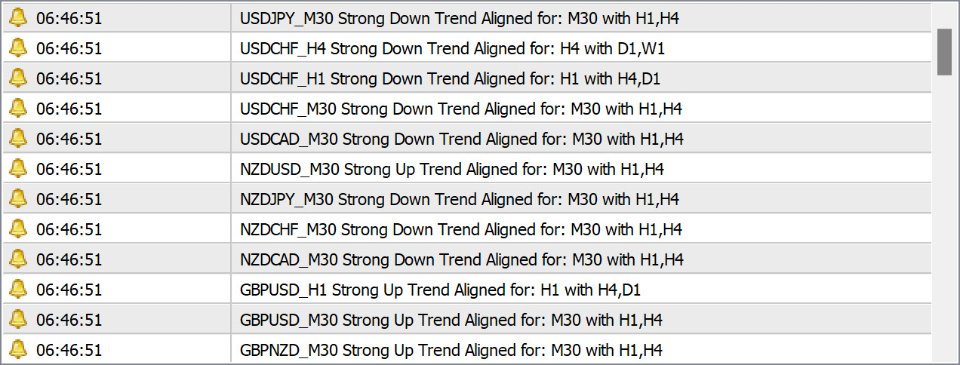
When all conditions align, you will get a BUY/SELL Signal alert.
Use this Telegram forwarder EA to get screenshot of chart with the template 3MACross.tpl applied:
https://www.mql5.com/en/blogs/post/758717
Note: All extra indicators and templates are also available in download package
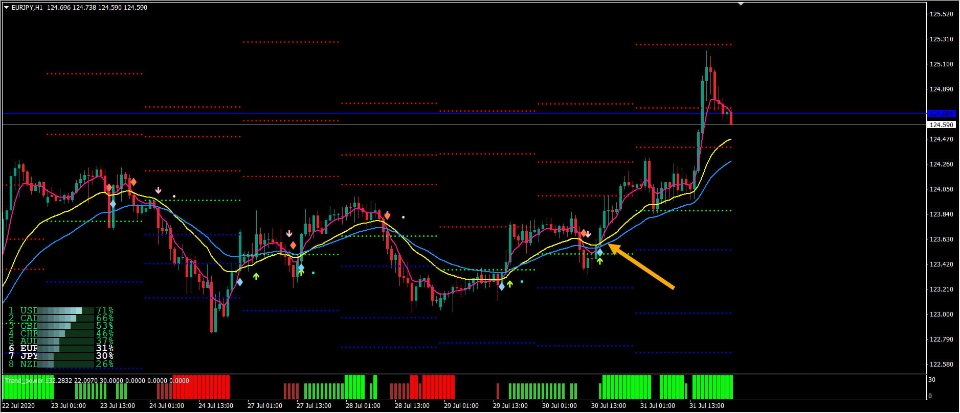
Take a look at where the 3 MAs cross pointed by the Yellow arrow in the figure.
All 3 conditions were met in the dashboard for EURJPY H1. You can specify “3MACross.tpl” in Dashboard “Use Template for New Window”.
Click on EURJPY H1 and it will open up the chart with this template.
Also, price has crossed above Pivot level.
So, you can now place a BUY signal and keep stop loss somewhere a little below the last price low. And Take Profit about 2-3 times more than stop loss.
Also, take a look at some of the other past arrows. When Trend Power is low or higher timeframes are not aligned, then signal might not be as strong.
So, be careful trading such signals.
Several Other Useful Strategies:
3MA Strategy is very useful to find the Strong Trend direction. But it needs to be combined with other supporting indicators for validation.
Here are some useful 3MA Strategies which use 3MA Crossover as base signal and use other indicators as validating signals.
E.g.: 3MA with Stochastic, with Trend Power, etc.

